Estimated zip code population in 2022: 2,343 Zip code population in 2010: 2,453 Zip code population in 2000: 2,142
Houses and condos: 977 Renter-occupied apartments: 144
% of renters here:
16%
State:
28%
March 2022 cost of living index in zip code 50240: 83.6 (less than average, U.S. average is 100)
Land area: 76.1 sq. mi. Water area: 0.3 sq. mi.
Population density: 31 people per square mile
(very low).
OSM Map
General Map
Google Map
MSN Map
OSM Map
General Map
Google Map
MSN Map
OSM Map
General Map
Google Map
MSN Map
OSM Map
General Map
Google Map
MSN Map
Please wait while loading the map...
Real estate property taxes paid for housing units in 2022:
This zip code:
1.2% ($3,276)
Iowa:
1.4% ($2,724)
Median real estate property taxes paid for housing units with mortgages in 2022: $3,055 (1.1%) Median real estate property taxes paid for housing units with no mortgage in 2022: $3,632 (1.4%)
Business Search- 14 Million verified businesses
Males: 1,167
(49.8%)
Females: 1,175
(50.2%)
For population 25 years and over in 50240:
High school or higher: 97.7%
Bachelor's degree or higher: 28.4%
Graduate or professional degree: 6.7%
Unemployed: 1.0%
Mean travel time to work (commute): 29.9 minutes
For population 15 years and over in 50240:
Never married: 23.0%
Now married: 65.8%
Separated: 1.7%
Widowed: 2.8%
Divorced: 6.8%
Zip code 50240 compared to state average:
Unemployed percentage significantly below state average.
Black race population percentage significantly below state average.
Hispanic race population percentage below state average.
Median age significantly above state average.
Foreign-born population percentage significantly below state average.
Renting percentage below state average.
Length of stay since moving in significantly above state average.
Estimated median house/condo value in 2022: $271,647
50240:
$271,647
Iowa:
$194,600
According to our research of Iowa and other state lists, there were 5 registered sex offenders living in 50240 zip code as of June 16, 2024. The ratio of all residents to sex offenders in zip code 50240 is 583 to 1. The ratio of registered sex offenders to all residents in this zip code is lower than the state average.
Median resident age:
This zip code:
48.6 years
Iowa median age:
38.9 years
Average household size:
This zip code:
2.5 people
Iowa:
2.3 people
Averages for the 2020 tax year for zip code 50240, filed in 2021:
Average Adjusted Gross Income (AGI) in 2020: $81,663 (Individual Income Tax Returns)
Here:
$81,663
State:
$71,087
Salary/wage: $74,380 (reported on 80.9% of returns)
Here:
$74,380
State:
$57,361
(% of AGI for various income ranges: 1056.0% for AGIs below $25k, 3605.9% for AGIs $25k-50k, 6599.2% for AGIs $50k-75k, 9654.5% for AGIs $75k-100k, 18813.1% for AGIs $100k-200k, 42730.0% for AGIs over 200k)
Taxable interest for individuals: $985 (reported on 40.9% of returns)
This zip code:
$985
Iowa:
$1,633
(% of AGI for various income ranges: 38.0% for AGIs below $25k, 29.4% for AGIs $25k-50k, 43.3% for AGIs $50k-75k, 78.2% for AGIs $75k-100k, 94.4% for AGIs $100k-200k, 223.3% for AGIs over 200k)
Ordinary dividends: $3,368 (reported on 21.7% of returns)
Here:
$3,368
State:
$5,432
(% of AGI for various income ranges: 25.3% for AGIs below $25k, 18.8% for AGIs $25k-50k, 49.2% for AGIs $50k-75k, 101.8% for AGIs $75k-100k, 257.5% for AGIs $100k-200k, 630.0% for AGIs over 200k)
Net capital gain/loss in AGI: +$16,800 (reported on 20.9% of returns)
Here:
+$16,800
State:
+$15,243
(% of AGI for various income ranges: 15.3% for AGIs below $25k, 44.1% for AGIs $25k-50k, 120.0% for AGIs $50k-75k, 78.2% for AGIs $75k-100k, 681.9% for AGIs $100k-200k, 8710.0% for AGIs over 200k)
Profit/loss from business: +$16,155 (reported on 19.1% of returns)
Here:
+$16,155
State:
+$11,763
(% of AGI for various income ranges: 241.3% for AGIs below $25k, 210.6% for AGIs $25k-50k, 262.5% for AGIs $50k-75k, 468.2% for AGIs $75k-100k, 1252.5% for AGIs $100k-200k)
Taxable individual retirement arrangement distribution: $15,973 (reported on 13.0% of returns)
50240:
$15,973
Iowa:
$17,324
(% of AGI for various income ranges: 131.3% for AGIs below $25k, 172.4% for AGIs $25k-50k, 282.5% for AGIs $50k-75k, 350.0% for AGIs $75k-100k, 738.8% for AGIs $100k-200k)
Total itemized deductions: $27,633 (reported on 7.8% of returns)
Here:
$27,633
State:
$33,775
(% of AGI for various income ranges: 688.2% for AGIs $75k-100k, 567.5% for AGIs $100k-200k, 2740.0% for AGIs over 200k)
Charity contributions: $6,340 (reported on 4.3% of returns)
Here:
$6,340
State:
$13,075
(% of AGI for various income ranges: 198.1% for AGIs $100k-200k)
Taxes paid: $8,667 (reported on 7.8% of returns)
50240:
$8,667
State:
$7,704
(% of AGI for various income ranges: 76.7% for AGIs below $25k, 142.7% for AGIs $75k-100k, 184.4% for AGIs $100k-200k, 710.0% for AGIs over 200k)
Earned income credit: $2,200 (reported on 7.0% of returns)
Here:
$2,200
State:
$2,195
(% of AGI for various income ranges: 60.0% for AGIs below $25k, 50.6% for AGIs $25k-50k)
Percentage of individuals using paid preparers for their 2020 taxes: 93.9%
Here:
94%
State:
95%
(% for various income ranges: 92.0% for AGIs below $25k, 95.5% for AGIs $25k-50k, 100.0% for AGIs $50k-75k, 94.1% for AGIs $75k-100k, 92.9% for AGIs $100k-200k, 85.7% for AGIs over 200k)
Averages for the 2012 tax year for zip code 50240, filed in 2013:
Average Adjusted Gross Income (AGI) in 2012: $61,164 (Individual Income Tax Returns)
Here:
$61,164
State:
$58,860
Salary/wage: $55,530 (reported on 84.1% of returns)
Here:
$55,530
State:
$46,659
(% of AGI for various income ranges: 71.6% for AGIs below $25k, 72.6% for AGIs $25k-50k, 74.8% for AGIs $50k-75k, 80.6% for AGIs $75k-100k, 81.0% for AGIs $100k-200k, 62.9% for AGIs over 200k)
Taxable interest for individuals: $1,335 (reported on 40.2% of returns)
This zip code:
$1,335
Iowa:
$1,537
(% of AGI for various income ranges: 1.8% for AGIs below $25k, 0.9% for AGIs $25k-50k, 0.9% for AGIs $50k-75k, 0.3% for AGIs $75k-100k, 1.3% for AGIs $100k-200k)
Ordinary dividends: $2,183 (reported on 21.5% of returns)
Here:
$2,183
State:
$4,542
(% of AGI for various income ranges: 0.9% for AGIs below $25k, 0.7% for AGIs $25k-50k, 0.8% for AGIs $50k-75k, 0.6% for AGIs $75k-100k, 1.1% for AGIs $100k-200k)
Net capital gain/loss in AGI: +$5,563 (reported on 17.8% of returns)
Here:
+$5,563
State:
+$11,802
(% of AGI for various income ranges: 0.8% for AGIs $25k-50k, 0.6% for AGIs $50k-75k, 0.1% for AGIs $75k-100k, 4.1% for AGIs $100k-200k)
Profit/loss from business: +$12,971 (reported on 19.6% of returns)
Here:
+$12,971
State:
+$10,509
(% of AGI for various income ranges: 9.6% for AGIs below $25k, 6.3% for AGIs $25k-50k, 5.0% for AGIs $50k-75k, 3.3% for AGIs $75k-100k, 3.9% for AGIs $100k-200k)
Taxable individual retirement arrangement distribution: $12,546 (reported on 12.1% of returns)
50240:
$12,546
Iowa:
$11,773
(% of AGI for various income ranges: 2.8% for AGIs below $25k, 4.3% for AGIs $25k-50k, 5.8% for AGIs $50k-75k, 2.1% for AGIs $100k-200k)
Total itemized deductions: $19,948 (20% of AGI, reported on 39.3% of returns)
Here:
$19,948
State:
$21,278
Here:
20.3% of AGI
State:
18.9% of AGI
(% of AGI for various income ranges: 10.7% for AGIs below $25k, 10.8% for AGIs $25k-50k, 13.1% for AGIs $50k-75k, 12.4% for AGIs $75k-100k, 14.3% for AGIs $100k-200k, 11.3% for AGIs over 200k)
Charity contributions: $2,339 (reported on 30.8% of returns)
Here:
$2,339
State:
$4,044
(% of AGI for various income ranges: 1.2% for AGIs $25k-50k, 1.0% for AGIs $50k-75k, 0.8% for AGIs $75k-100k, 1.5% for AGIs $100k-200k, 1.7% for AGIs over 200k)
Taxes paid: $8,110 (reported on 39.3% of returns)
50240:
$8,110
State:
$8,846
(% of AGI for various income ranges: 1.9% for AGIs below $25k, 2.6% for AGIs $25k-50k, 4.1% for AGIs $50k-75k, 5.4% for AGIs $75k-100k, 6.7% for AGIs $100k-200k, 6.8% for AGIs over 200k)
Earned income credit: $1,992 (reported on 11.2% of returns)
Here:
$1,992
State:
$2,098
(% of AGI for various income ranges: 5.2% for AGIs below $25k, 0.8% for AGIs $25k-50k)
Percentage of individuals using paid preparers for their 2012 taxes: 64.5%
Here:
64%
State:
65%
(% for various income ranges: 51.6% for AGIs below $25k, 68.2% for AGIs $25k-50k, 70.0% for AGIs $50k-75k, 66.7% for AGIs $75k-100k, 82.4% for AGIs $100k-200k)
Averages for the 2004 tax year for zip code 50240, filed in 2005:
Average Adjusted Gross Income (AGI) in 2004: $51,130 (Individual Income Tax Returns)
Here:
$51,130
State:
$43,875
Salary/wage: $46,736 (reported on 86.9% of returns)
Here:
$46,736
State:
$38,265
(% of AGI for various income ranges: 123.4% for AGIs below $10k, 68.9% for AGIs $10k-25k, 84.2% for AGIs $25k-50k, 85.0% for AGIs $50k-75k, 90.6% for AGIs $75k-100k, 63.4% for AGIs over 100k)
Taxable interest for individuals: $1,394 (reported on 52.1% of returns)
This zip code:
$1,394
Iowa:
$1,768
(% of AGI for various income ranges: 7.9% for AGIs below $10k, 4.5% for AGIs $10k-25k, 2.3% for AGIs $25k-50k, 1.3% for AGIs $50k-75k, 0.5% for AGIs $75k-100k, 0.8% for AGIs over 100k)
Taxable dividends: $1,011 (reported on 30.1% of returns)
Here:
$1,011
State:
$2,510
(% of AGI for various income ranges: 3.1% for AGIs below $10k, 1.9% for AGIs $10k-25k, 0.6% for AGIs $25k-50k, 0.5% for AGIs $50k-75k, 0.3% for AGIs $75k-100k, 0.6% for AGIs over 100k)
Net capital gain/loss: +$2,888 (reported on 20.7% of returns)
Here:
+$2,888
State:
+$6,139
(% of AGI for various income ranges: 13.0% for AGIs below $10k, 0.8% for AGIs $10k-25k, 0.8% for AGIs $25k-50k, 1.3% for AGIs $50k-75k, 0.0% for AGIs $75k-100k, 1.7% for AGIs over 100k)
Profit/loss from business: +$8,005 (reported on 19.3% of returns)
Here:
+$8,005
State:
+$8,574
(% of AGI for various income ranges: -18.8% for AGIs below $10k, 6.4% for AGIs $10k-25k, 4.7% for AGIs $25k-50k, 4.3% for AGIs $50k-75k, 1.5% for AGIs $75k-100k, 2.1% for AGIs over 100k)
IRA payment deduction: $2,286 (reported on 2.2% of returns)
50240:
$2,286
Iowa:
$2,970
Total itemized deductions: $18,158 (22% of AGI, reported on 40.9% of returns)
Here:
$18,158
State:
$16,976
Here:
22.2% of AGI
State:
20.8% of AGI
(% of AGI for various income ranges: 11.0% for AGIs $10k-25k, 12.1% for AGIs $25k-50k, 12.7% for AGIs $50k-75k, 14.6% for AGIs $75k-100k, 19.0% for AGIs over 100k)
Charity contributions deductions: $1,733 (2% of AGI, reported on 33.6% of returns)
Here:
$1,733
State:
$3,089
Here:
2.0% of AGI
State:
3.6% of AGI
(% of AGI for various income ranges: 1.4% for AGIs $10k-25k, 1.2% for AGIs $25k-50k, 1.0% for AGIs $50k-75k, 1.1% for AGIs $75k-100k, 1.3% for AGIs over 100k)
Total tax: $6,621 (reported on 82.3% of returns)
50240:
$6,621
State:
$6,177
(% of AGI for various income ranges: 6.4% for AGIs below $10k, 4.5% for AGIs $10k-25k, 6.9% for AGIs $25k-50k, 8.4% for AGIs $50k-75k, 10.0% for AGIs $75k-100k, 17.1% for AGIs over 100k)
Earned income credit: $1,776 (reported on 9.0% of returns)
Here:
$1,776
State:
$1,540
Percentage of individuals using paid preparers for their 2004 taxes: 73.7%
Here:
74%
State:
70%
(% for various income ranges: 66.0% for AGIs below $10k, 70.8% for AGIs $10k-25k, 77.6% for AGIs $25k-50k, 79.7% for AGIs $50k-75k, 70.9% for AGIs $75k-100k, 72.2% for AGIs over 100k)
Likely homosexual households (counted as self-reported same-sex unmarried-partner households)
Lesbian couples: 0.6% of all households
Gay men: 0.0% of all households
Household received Food Stamps/SNAP in the past 12 months: 6 Household did not receive Food Stamps/SNAP in the past 12 months: 931
Women who had a birth in the past 12 months: 20 (19 now married, 0 unmarried) Women who did not have a birth in the past 12 months: 527 (251 now married, 275 unmarried)
Housing units in zip code 50240 with a mortgage: 492 (64 second mortgage, 53 both second mortgage and home equity loan) Houses without a mortgage: 5
Median monthly owner costs for units with a mortgage: $1,575 Median monthly owner costs for units without a mortgage: $643
Residents with income below the poverty level in 2022:
This zip code:
4.4%
Whole state:
11.0%
Residents with income below 50% of the poverty level in 2022:
This zip code:
0.9%
Whole state:
5.5%
Median number of rooms in houses and condos:
Here:
6.4
State:
6.8
Median number of rooms in apartments:
Here:
6.4
State:
4.2
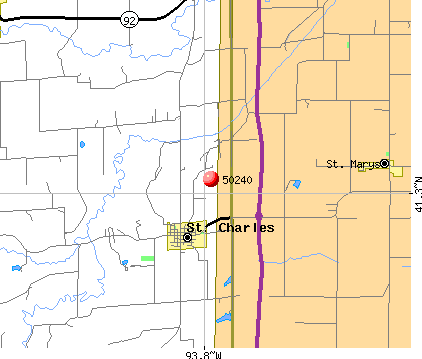
Notable locations in this zip code not listed on our city pages
Notable locations in zip code 50240: Saint Charles Fire and Rescue (A), Saint Charles City Hall (B), Saint Marys Fire Department (C). Display/hide their locations on the map
Churches in zip code 50240 include: Blair Chapel (A), Elm Grove Church (B), Yoke United Methodist Church (C), Saint Charles Parish (D), New Life Family Worship Center (E), Calvary Baptist Church (F), Immaculate Conception Church (G). Display/hide their locations on the map
Cemeteries: Blair Chapel Cemetery (1), Wallace Cemetery (2), Dillman Cemetery (3), Viney Cemetery (4), Close Cemetery (5), Brush Ridge Cemetery (6), Saint Charles Cemetery (7). Display/hide their locations on the map
Size of family households: 458 2-persons, 167 3-persons, 74 4-persons, 28 5-persons, 15 6-persons, 3 7-or-more-persons
Size of nonfamily households: 102 1-person, 61 2-persons, 22 5-persons
267 married couples with children.
51 single-parent households (14 men, 37 women).
96.4% of residents of 50240 zip code speak English at home.
3.7% of residents speak Spanish at home (100% very well).
Foreign born population: 53 (2.3%) (32.8% of them are naturalized citizens)
This zip code:
2.3%
Whole state:
6.0%
62%Costa Rica
34%Honduras
32%American
22%German
14%English
8%Irish
4%European
4%Italian
2%Danish
Year of entry for the foreign-born population
382010 or later
152000 to 2009
01990 to 1999
18Before 1990
Facilities with environmental interests located in this zip code:
ST. CHARLES CITY OF STP (113 LUMBER STREET in ST CHARLES, IA)
National Pollutant Discharge Elimination System NON-MAJOR (Tracking pollutant discharge elimination systems) - permit Business SIC classification: SEWERAGE SYSTEMS Organizations: CITY OF ST CHARLES (CONTACT/OWNER)
RO BANKS WELL CO INC (1595 G 50 HWY in ST CHARLES, IA)
Conditionally Exempt Small Quantity Generators, less than 100 kg/month of hazardous waste (Resource Conservation and Recovery Act (tracking hazardous waste)) Organizations: ROGER & CHARLOTTE BANKS (CONTACT/OPERATOR)
Housing units lacking complete plumbing facilities: 0.9% Housing units lacking complete kitchen facilities: 0.3%
43.7%Bottled, tank, or LP gas
33.4%Utility gas
16.5%Electricity
6.2%Wood
Population in 1990: 1,169. Population change in the 1990s: +973 (+83.2%).
Place of birth for U.S.-born residents:
This state: 1,991
Midwest: 152
South: 46
West: 82
66% of the 50240 zip code residents lived in the same house 5 years ago. Out of people who lived in different houses, 34% lived in this county. Out of people who lived in different counties, 50% lived in Iowa.
92% of the 50240 zip code residents lived in the same house 1 year ago. Out of people who lived in different houses, 6% moved from this county. Out of people who lived in different houses, 85% moved from different county within same state. Out of people who lived in different houses, 15% moved from different state.
Private vs. public school enrollment:
Students in private schools in grades 1 to 8 (elementary and middle school): 15
Here:
14.9%
Iowa:
10.6%
Students in private schools in grades 9 to 12 (high school): 5
Here:
3.4%
Iowa:
7.9%
Students in private undergraduate colleges: 8
Here:
14.1%
Iowa:
23.9%
Occupation by median earnings in the past 12 months ($)
92,771Architecture and engineering occupations
90,329Transportation occupations
73,765Computer and mathematical occupations
64,615Business and financial operations occupations
62,847Installation, maintenance, and repair occupations
62,703Education, training, and library occupations
Top industries in this zip code by the number of employees in 2005:
Construction: New Single-Family Housing Construction (except Operative Builders) (5-9: 2, 1-4: 1)
Construction: Tile and Terrazzo Contractors (10-19: 1)
Finance and Insurance: Third Party Administration of Insurance and Pension Funds (10-19: 1)
Accommodation and Food Services: Recreational and Vacation Camps (except Campgrounds) (5-9: 1)
Administrative and Support and Waste Management and Remediation Services: Office Administrative Services (5-9: 1)
Other Services (except Public Administration): Commercial and Industrial Machinery and Equipment (except Automotive and Electronic) Repair and Maintenance (5-9: 1)
Fatal accident statistics in 2013:
Fatal accident count: 3
Vehicles involved in fatal accidents: 5
Fatal accidents caused by drunken drivers: 2
Fatalities: 3
Persons involved in fatal accidents: 6
Pedestrians involved in fatal accidents: 2
Fatal accident statistics in 2012:
Fatal accident count: 1
Vehicles involved in fatal accidents: 1
Fatal accidents caused by drunken drivers: 0
Fatalities: 1
Persons involved in fatal accidents: 1
Pedestrians involved in fatal accidents: 0
Home Mortgage Disclosure Act Aggregated Statistics For Year 2009 (Based on 2 partial tracts)
A) FHA, FSA/RHS & VA Home Purchase Loans
B) Conventional Home Purchase Loans
C) Refinancings
D) Home Improvement Loans
F) Non-occupant Loans on < 5 Family Dwellings (A B C & D)
G) Loans On Manufactured Home Dwelling (A B C & D)
Number
Average Value
Number
Average Value
Number
Average Value
Number
Average Value
Number
Average Value
Number
Average Value
LOANS ORIGINATED
10
$147,805
12
$127,547
77
$170,919
6
$81,192
6
$77,737
1
$15,890
APPLICATIONS APPROVED, NOT ACCEPTED
1
$190,020
1
$373,830
10
$130,875
0
$0
1
$60,810
1
$91,210
APPLICATIONS DENIED
1
$235,630
0
$0
19
$168,349
2
$36,625
0
$0
1
$64,950
APPLICATIONS WITHDRAWN
0
$0
1
$248,760
12
$153,920
1
$116,090
1
$131,980
0
$0
FILES CLOSED FOR INCOMPLETENESS
1
$81,540
0
$0
3
$181,503
0
$0
0
$0
0
$0
Aggregated Statistics For Year 2008 (Based on 2 partial tracts)
A) FHA, FSA/RHS & VA Home Purchase Loans
B) Conventional Home Purchase Loans
C) Refinancings
D) Home Improvement Loans
E) Loans on Dwellings For 5+ Families
F) Non-occupant Loans on < 5 Family Dwellings (A B C & D)
G) Loans On Manufactured Home Dwelling (A B C & D)
Number
Average Value
Number
Average Value
Number
Average Value
Number
Average Value
Number
Average Value
Number
Average Value
Number
Average Value
LOANS ORIGINATED
3
$174,363
16
$147,701
45
$135,421
9
$49,444
1
$55,970
7
$78,873
1
$135,440
APPLICATIONS APPROVED, NOT ACCEPTED
0
$0
1
$226,650
6
$245,190
2
$26,605
0
$0
1
$161,000
0
$0
APPLICATIONS DENIED
1
$64,950
3
$116,317
25
$139,776
8
$61,758
0
$0
1
$85,680
2
$171,020
APPLICATIONS WITHDRAWN
0
$0
5
$224,160
9
$168,834
1
$174,130
0
$0
1
$317,860
0
$0
FILES CLOSED FOR INCOMPLETENESS
1
$163,080
2
$89,485
6
$158,700
1
$10,360
0
$0
0
$0
0
$0
Aggregated Statistics For Year 2007 (Based on 2 partial tracts)
A) FHA, FSA/RHS & VA Home Purchase Loans
B) Conventional Home Purchase Loans
C) Refinancings
D) Home Improvement Loans
F) Non-occupant Loans on < 5 Family Dwellings (A B C & D)
G) Loans On Manufactured Home Dwelling (A B C & D)
Number
Average Value
Number
Average Value
Number
Average Value
Number
Average Value
Number
Average Value
Number
Average Value
LOANS ORIGINATED
1
$210,060
37
$164,439
48
$135,422
12
$58,447
5
$137,508
3
$107,337
APPLICATIONS APPROVED, NOT ACCEPTED
1
$50,440
3
$514,797
16
$123,128
2
$19,350
1
$93,980
0
$0
APPLICATIONS DENIED
1
$64,950
6
$95,358
26
$210,383
3
$38,237
0
$0
0
$0
APPLICATIONS WITHDRAWN
0
$0
3
$151,100
10
$152,780
3
$82,690
0
$0
0
$0
FILES CLOSED FOR INCOMPLETENESS
0
$0
2
$142,000
6
$157,548
0
$0
0
$0
0
$0
Aggregated Statistics For Year 2006 (Based on 2 partial tracts)
A) FHA, FSA/RHS & VA Home Purchase Loans
B) Conventional Home Purchase Loans
C) Refinancings
D) Home Improvement Loans
E) Loans on Dwellings For 5+ Families
F) Non-occupant Loans on < 5 Family Dwellings (A B C & D)
G) Loans On Manufactured Home Dwelling (A B C & D)
Number
Average Value
Number
Average Value
Number
Average Value
Number
Average Value
Number
Average Value
Number
Average Value
Number
Average Value
LOANS ORIGINATED
1
$120,230
28
$112,683
55
$111,829
11
$32,979
1
$5,530
6
$97,892
4
$60,980
APPLICATIONS APPROVED, NOT ACCEPTED
1
$66,340
7
$132,080
12
$136,127
0
$0
0
$0
1
$29,020
0
$0
APPLICATIONS DENIED
1
$104,340
5
$106,966
30
$146,515
3
$55,050
0
$0
2
$121,615
1
$157,550
APPLICATIONS WITHDRAWN
0
$0
6
$85,798
13
$120,447
1
$69,100
0
$0
1
$29,020
0
$0
FILES CLOSED FOR INCOMPLETENESS
0
$0
1
$103,650
8
$102,268
0
$0
0
$0
0
$0
0
$0
Aggregated Statistics For Year 2005 (Based on 2 partial tracts)
A) FHA, FSA/RHS & VA Home Purchase Loans
B) Conventional Home Purchase Loans
C) Refinancings
D) Home Improvement Loans
E) Loans on Dwellings For 5+ Families
F) Non-occupant Loans on < 5 Family Dwellings (A B C & D)
G) Loans On Manufactured Home Dwelling (A B C & D)
Number
Average Value
Number
Average Value
Number
Average Value
Number
Average Value
Number
Average Value
Number
Average Value
Number
Average Value
LOANS ORIGINATED
1
$175,510
27
$114,117
63
$115,485
14
$25,074
1
$71,860
7
$76,109
0
$0
APPLICATIONS APPROVED, NOT ACCEPTED
0
$0
4
$121,442
18
$112,633
1
$124,380
0
$0
1
$62,190
0
$0
APPLICATIONS DENIED
0
$0
6
$121,385
46
$121,901
4
$36,105
0
$0
2
$41,805
1
$108,490
APPLICATIONS WITHDRAWN
0
$0
2
$144,075
17
$133,119
1
$27,640
0
$0
0
$0
1
$298,510
FILES CLOSED FOR INCOMPLETENESS
0
$0
2
$219,045
11
$152,145
1
$76,700
0
$0
0
$0
0
$0
Aggregated Statistics For Year 2004 (Based on 2 partial tracts)
A) FHA, FSA/RHS & VA Home Purchase Loans
B) Conventional Home Purchase Loans
C) Refinancings
D) Home Improvement Loans
F) Non-occupant Loans on < 5 Family Dwellings (A B C & D)
G) Loans On Manufactured Home Dwelling (A B C & D)
Number
Average Value
Number
Average Value
Number
Average Value
Number
Average Value
Number
Average Value
Number
Average Value
LOANS ORIGINATED
1
$181,040
23
$114,466
61
$101,350
10
$40,907
5
$108,486
1
$125,070
APPLICATIONS APPROVED, NOT ACCEPTED
0
$0
6
$76,240
8
$71,000
0
$0
1
$34,550
1
$26,260
APPLICATIONS DENIED
1
$122,310
7
$87,856
28
$101,602
6
$27,870
1
$64,950
1
$48,370
APPLICATIONS WITHDRAWN
0
$0
8
$61,499
18
$107,067
0
$0
3
$77,623
1
$68,410
FILES CLOSED FOR INCOMPLETENESS
0
$0
2
$99,505
5
$125,624
1
$33,170
0
$0
0
$0
Aggregated Statistics For Year 2003 (Based on 2 partial tracts)
A) FHA, FSA/RHS & VA Home Purchase Loans
B) Conventional Home Purchase Loans
C) Refinancings
D) Home Improvement Loans
E) Loans on Dwellings For 5+ Families
F) Non-occupant Loans on < 5 Family Dwellings (A B C & D)
Number
Average Value
Number
Average Value
Number
Average Value
Number
Average Value
Number
Average Value
Number
Average Value
LOANS ORIGINATED
2
$99,850
19
$108,087
108
$112,064
15
$22,342
1
$17,270
4
$74,972
APPLICATIONS APPROVED, NOT ACCEPTED
0
$0
5
$84,854
12
$108,027
1
$62,190
0
$0
0
$0
APPLICATIONS DENIED
0
$0
5
$79,326
47
$121,837
8
$24,962
1
$234,940
1
$91,900
APPLICATIONS WITHDRAWN
0
$0
6
$57,583
19
$116,343
0
$0
0
$0
1
$65,640
FILES CLOSED FOR INCOMPLETENESS
0
$0
3
$85,453
9
$109,254
0
$0
0
$0
1
$41,460
Aggregated Statistics For Year 2002 (Based on 2 partial tracts)
A) FHA, FSA/RHS & VA Home Purchase Loans
B) Conventional Home Purchase Loans
C) Refinancings
D) Home Improvement Loans
F) Non-occupant Loans on < 5 Family Dwellings (A B C & D)
Number
Average Value
Number
Average Value
Number
Average Value
Number
Average Value
Number
Average Value
LOANS ORIGINATED
6
$86,950
30
$129,079
101
$112,729
10
$26,880
4
$74,800
APPLICATIONS APPROVED, NOT ACCEPTED
0
$0
5
$105,862
21
$93,120
2
$11,745
0
$0
APPLICATIONS DENIED
0
$0
8
$91,126
26
$116,805
2
$19,350
0
$0
APPLICATIONS WITHDRAWN
1
$87,760
4
$122,480
20
$91,212
1
$17,270
0
$0
FILES CLOSED FOR INCOMPLETENESS
0
$0
3
$89,600
8
$150,984
0
$0
0
$0
Aggregated Statistics For Year 2001 (Based on 2 partial tracts)
A) FHA, FSA/RHS & VA Home Purchase Loans
B) Conventional Home Purchase Loans
C) Refinancings
D) Home Improvement Loans
F) Non-occupant Loans on < 5 Family Dwellings (A B C & D)
Number
Average Value
Number
Average Value
Number
Average Value
Number
Average Value
Number
Average Value
LOANS ORIGINATED
6
$89,253
26
$123,051
77
$95,834
8
$23,408
1
$66,340
APPLICATIONS APPROVED, NOT ACCEPTED
0
$0
3
$156,167
11
$104,718
1
$10,360
1
$93,280
APPLICATIONS DENIED
2
$98,815
7
$105,821
32
$93,954
5
$17,136
1
$4,150
APPLICATIONS WITHDRAWN
1
$81,540
2
$92,595
15
$71,357
1
$17,270
0
$0
FILES CLOSED FOR INCOMPLETENESS
0
$0
0
$0
3
$155,937
1
$41,460
0
$0
Aggregated Statistics For Year 2000 (Based on 2 partial tracts)
A) FHA, FSA/RHS & VA Home Purchase Loans
B) Conventional Home Purchase Loans
C) Refinancings
D) Home Improvement Loans
E) Loans on Dwellings For 5+ Families
F) Non-occupant Loans on < 5 Family Dwellings (A B C & D)
Number
Average Value
Number
Average Value
Number
Average Value
Number
Average Value
Number
Average Value
Number
Average Value
LOANS ORIGINATED
3
$99,733
32
$111,078
39
$70,801
15
$20,361
1
$73,250
2
$168,950
APPLICATIONS APPROVED, NOT ACCEPTED
0
$0
4
$75,492
9
$68,947
2
$13,130
0
$0
1
$17,270
APPLICATIONS DENIED
1
$47,680
11
$65,143
20
$66,163
8
$25,912
0
$0
1
$100,890
APPLICATIONS WITHDRAWN
0
$0
4
$68,410
4
$113,150
2
$24,185
0
$0
1
$15,890
FILES CLOSED FOR INCOMPLETENESS
0
$0
1
$100,890
6
$127,835
0
$0
0
$0
0
$0
Aggregated Statistics For Year 1999 (Based on 1 partial tract)
A) FHA, FSA/RHS & VA Home Purchase Loans
B) Conventional Home Purchase Loans
C) Refinancings
D) Home Improvement Loans
F) Non-occupant Loans on < 5 Family Dwellings (A B C & D)


 Nearest zip codes: 50033, 50229, 50160, 50218, 50257, 50210.


