Estimated zip code population in 2022: 1,301 Zip code population in 2010: 1,222 Zip code population in 2000: 1,232
Houses and condos: 576 Renter-occupied apartments: 95
% of renters here:
18%
State:
28%
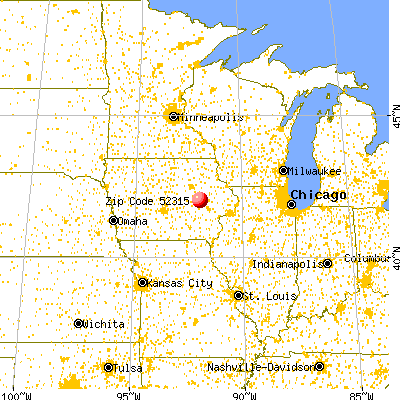
March 2022 cost of living index in zip code 52315: 81.7 (low, U.S. average is 100)
Land area: 29.0 sq. mi. Water area: 0.0 sq. mi.
Population density: 45 people per square mile
(very low).
OSM Map
General Map
Google Map
MSN Map
OSM Map
General Map
Google Map
MSN Map
OSM Map
General Map
Google Map
MSN Map
OSM Map
General Map
Google Map
MSN Map
Please wait while loading the map...
Real estate property taxes paid for housing units in 2022:
This zip code:
1.3% ($2,303)
Iowa:
1.4% ($2,724)
Median real estate property taxes paid for housing units with mortgages in 2022: $2,248 (1.2%) Median real estate property taxes paid for housing units with no mortgage in 2022: $2,395 (1.3%)
Business Search- 14 Million verified businesses
Males: 668
(51.4%)
Females: 633
(48.6%)
For population 25 years and over in 52315:
High school or higher: 96.9%
Bachelor's degree or higher: 19.6%
Graduate or professional degree: 2.3%
Unemployed: 3.0%
Mean travel time to work (commute): 26.9 minutes
For population 15 years and over in 52315:
Never married: 28.1%
Now married: 53.5%
Separated: 2.0%
Widowed: 7.2%
Divorced: 9.1%
Zip code 52315 compared to state average:
Black race population percentage significantly below state average.
Hispanic race population percentage significantly below state average.
Foreign-born population percentage significantly below state average.
Renting percentage below state average.
Number of college students below state average.
Percentage of population with a bachelor's degree or higher below state average.
Averages for the 2020 tax year for zip code 52315, filed in 2021:
Average Adjusted Gross Income (AGI) in 2020: $62,796 (Individual Income Tax Returns)
Here:
$62,796
State:
$71,087
Salary/wage: $56,540 (reported on 79.6% of returns)
Here:
$56,540
State:
$57,361
(% of AGI for various income ranges: 1215.0% for AGIs below $25k, 3283.6% for AGIs $25k-50k, 7764.0% for AGIs $50k-75k, 10734.0% for AGIs $75k-100k, 17870.0% for AGIs $100k-200k)
Taxable interest for individuals: $1,538 (reported on 48.1% of returns)
This zip code:
$1,538
Iowa:
$1,633
(% of AGI for various income ranges: 46.7% for AGIs below $25k, 53.6% for AGIs $25k-50k, 256.0% for AGIs $50k-75k, 130.0% for AGIs $75k-100k, 200.0% for AGIs $100k-200k)
Ordinary dividends: $1,836 (reported on 20.4% of returns)
Here:
$1,836
State:
$5,432
(% of AGI for various income ranges: 49.1% for AGIs $25k-50k, 164.0% for AGIs $50k-75k, 110.0% for AGIs $100k-200k)
Net capital gain/loss in AGI: +$3,440 (reported on 18.5% of returns)
Here:
+$3,440
State:
+$15,243
(% of AGI for various income ranges: 19.1% for AGIs $25k-50k, 456.0% for AGIs $50k-75k, 158.3% for AGIs $100k-200k)
Profit/loss from business: +$5,275 (reported on 14.8% of returns)
Here:
+$5,275
State:
+$11,763
(% of AGI for various income ranges: 211.8% for AGIs $25k-50k, 378.0% for AGIs $75k-100k)
Taxable individual retirement arrangement distribution: $12,614 (reported on 13.0% of returns)
52315:
$12,614
Iowa:
$17,324
(% of AGI for various income ranges: 287.3% for AGIs $25k-50k, 1134.0% for AGIs $50k-75k)
Total itemized deductions: $30,300 (reported on 5.6% of returns)
Here:
$30,300
State:
$33,775
(% of AGI for various income ranges: 1818.0% for AGIs $50k-75k)
Taxes paid: $6,050 (reported on 3.7% of returns)
52315:
$6,050
State:
$7,704
(% of AGI for various income ranges: 242.0% for AGIs $50k-75k)
Earned income credit: $1,760 (reported on 9.3% of returns)
Here:
$1,760
State:
$2,195
(% of AGI for various income ranges: 51.7% for AGIs below $25k, 51.8% for AGIs $25k-50k)
Percentage of individuals using paid preparers for their 2020 taxes: 96.3%
Here:
96%
State:
95%
(% for various income ranges: 100.0% for AGIs below $25k, 93.3% for AGIs $25k-50k, 90.0% for AGIs $50k-75k, 100.0% for AGIs $75k-100k, 100.0% for AGIs $100k-200k)
Averages for the 2012 tax year for zip code 52315, filed in 2013:
Average Adjusted Gross Income (AGI) in 2012: $54,818 (Individual Income Tax Returns)
Here:
$54,818
State:
$58,860
Salary/wage: $47,496 (reported on 80.7% of returns)
Here:
$47,496
State:
$46,659
(% of AGI for various income ranges: 70.0% for AGIs below $25k, 68.8% for AGIs $25k-50k, 74.3% for AGIs $50k-75k, 75.1% for AGIs $75k-100k, 64.1% for AGIs $100k-200k)
Taxable interest for individuals: $1,557 (reported on 49.1% of returns)
This zip code:
$1,557
Iowa:
$1,537
(% of AGI for various income ranges: 2.5% for AGIs below $25k, 1.9% for AGIs $25k-50k, 0.8% for AGIs $50k-75k, 1.2% for AGIs $75k-100k, 1.5% for AGIs $100k-200k)
Ordinary dividends: $2,267 (reported on 21.1% of returns)
Here:
$2,267
State:
$4,542
(% of AGI for various income ranges: 1.5% for AGIs $25k-50k, 0.4% for AGIs $75k-100k, 1.6% for AGIs $100k-200k)
Net capital gain/loss in AGI: +$2,422 (reported on 15.8% of returns)
Here:
+$2,422
State:
+$11,802
(% of AGI for various income ranges: 0.6% for AGIs $25k-50k, 0.7% for AGIs $50k-75k, 1.4% for AGIs $100k-200k)
Profit/loss from business: +$4,312 (reported on 14.0% of returns)
Here:
+$4,312
State:
+$10,509
Taxable individual retirement arrangement distribution: $7,843 (reported on 12.3% of returns)
52315:
$7,843
Iowa:
$11,773
Total itemized deductions: $15,665 (20% of AGI, reported on 35.1% of returns)
Here:
$15,665
State:
$21,278
Here:
20.4% of AGI
State:
18.9% of AGI
(% of AGI for various income ranges: 15.3% for AGIs $25k-50k, 7.7% for AGIs $50k-75k, 10.4% for AGIs $75k-100k, 10.4% for AGIs $100k-200k)
Charity contributions: $3,007 (reported on 26.3% of returns)
Here:
$3,007
State:
$4,044
(% of AGI for various income ranges: 1.9% for AGIs $25k-50k, 0.7% for AGIs $50k-75k, 1.6% for AGIs $75k-100k, 1.8% for AGIs $100k-200k)
Taxes paid: $5,800 (reported on 35.1% of returns)
52315:
$5,800
State:
$8,846
(% of AGI for various income ranges: 3.6% for AGIs $25k-50k, 2.9% for AGIs $50k-75k, 3.9% for AGIs $75k-100k, 4.8% for AGIs $100k-200k)
Earned income credit: $1,786 (reported on 12.3% of returns)
Here:
$1,786
State:
$2,098
(% of AGI for various income ranges: 3.7% for AGIs below $25k, 1.1% for AGIs $25k-50k)
Percentage of individuals using paid preparers for their 2012 taxes: 66.7%
Here:
67%
State:
65%
(% for various income ranges: 62.5% for AGIs below $25k, 64.3% for AGIs $25k-50k, 70.0% for AGIs $50k-75k, 66.7% for AGIs $75k-100k, 75.0% for AGIs $100k-200k)
Averages for the 2004 tax year for zip code 52315, filed in 2005:
Average Adjusted Gross Income (AGI) in 2004: $44,137 (Individual Income Tax Returns)
Here:
$44,137
State:
$43,875
Salary/wage: $39,835 (reported on 83.0% of returns)
Here:
$39,835
State:
$38,265
(% of AGI for various income ranges: 87.9% for AGIs below $10k, 63.4% for AGIs $10k-25k, 69.6% for AGIs $25k-50k, 80.7% for AGIs $50k-75k, 83.7% for AGIs $75k-100k, 64.7% for AGIs over 100k)
Taxable interest for individuals: $2,246 (reported on 56.9% of returns)
This zip code:
$2,246
Iowa:
$1,768
(% of AGI for various income ranges: 7.1% for AGIs below $10k, 6.8% for AGIs $10k-25k, 3.6% for AGIs $25k-50k, 1.3% for AGIs $50k-75k, 1.4% for AGIs $75k-100k, 4.2% for AGIs over 100k)
Taxable dividends: $1,048 (reported on 29.8% of returns)
Here:
$1,048
State:
$2,510
(% of AGI for various income ranges: 1.0% for AGIs below $10k, 1.5% for AGIs $10k-25k, 0.6% for AGIs $25k-50k, 0.6% for AGIs $50k-75k, 0.4% for AGIs $75k-100k, 1.0% for AGIs over 100k)
Net capital gain/loss: +$3,286 (reported on 22.3% of returns)
Here:
+$3,286
State:
+$6,139
(% of AGI for various income ranges: 5.8% for AGIs below $10k, 2.0% for AGIs $10k-25k, 1.2% for AGIs $25k-50k, 0.3% for AGIs $50k-75k, 0.9% for AGIs $75k-100k, 4.7% for AGIs over 100k)
Profit/loss from business: +$5,523 (reported on 15.2% of returns)
Here:
+$5,523
State:
+$8,574
(% of AGI for various income ranges: 3.8% for AGIs below $10k, 2.9% for AGIs $10k-25k, 4.2% for AGIs $25k-50k, 1.9% for AGIs $50k-75k, 0.8% for AGIs $75k-100k)
IRA payment deduction: $1,600 (reported on 1.8% of returns)
52315:
$1,600
Iowa:
$2,970
Total itemized deductions: $13,966 (22% of AGI, reported on 41.1% of returns)
Here:
$13,966
State:
$16,976
Here:
22.1% of AGI
State:
20.8% of AGI
(% of AGI for various income ranges: 20.8% for AGIs $10k-25k, 10.0% for AGIs $25k-50k, 12.9% for AGIs $50k-75k, 14.1% for AGIs $75k-100k, 12.7% for AGIs over 100k)
Charity contributions deductions: $2,579 (4% of AGI, reported on 37.1% of returns)
Here:
$2,579
State:
$3,089
Here:
3.9% of AGI
State:
3.6% of AGI
(% of AGI for various income ranges: 2.5% for AGIs $10k-25k, 2.5% for AGIs $25k-50k, 2.1% for AGIs $50k-75k, 1.5% for AGIs $75k-100k, 2.7% for AGIs over 100k)
Total tax: $4,812 (reported on 84.0% of returns)
52315:
$4,812
State:
$6,177
(% of AGI for various income ranges: 2.8% for AGIs below $10k, 3.9% for AGIs $10k-25k, 7.3% for AGIs $25k-50k, 8.8% for AGIs $50k-75k, 9.3% for AGIs $75k-100k, 14.9% for AGIs over 100k)
Earned income credit: $1,292 (reported on 8.5% of returns)
Here:
$1,292
State:
$1,540
Percentage of individuals using paid preparers for their 2004 taxes: 68.6%
Here:
69%
State:
70%
(% for various income ranges: 53.4% for AGIs below $10k, 71.4% for AGIs $10k-25k, 76.3% for AGIs $25k-50k, 68.1% for AGIs $50k-75k, 69.2% for AGIs $75k-100k, 68.6% for AGIs over 100k)
Likely homosexual households (counted as self-reported same-sex unmarried-partner households)
Lesbian couples: 0.9% of all households
Gay men: 0.0% of all households
Household received Food Stamps/SNAP in the past 12 months: 28 Household did not receive Food Stamps/SNAP in the past 12 months: 502
Women who had a birth in the past 12 months: 21 (22 now married, 0 unmarried) Women who did not have a birth in the past 12 months: 246 (111 now married, 135 unmarried)
Housing units in zip code 52315 with a mortgage: 293 (26 second mortgage, 22 both second mortgage and home equity loan) Houses without a mortgage: 15
Median monthly owner costs for units with a mortgage: $1,369 Median monthly owner costs for units without a mortgage: $659
Residents with income below the poverty level in 2022:
This zip code:
9.4%
Whole state:
11.0%
Residents with income below 50% of the poverty level in 2022:
This zip code:
6.5%
Whole state:
5.5%
Median number of rooms in houses and condos:
Here:
6.3
State:
6.8
Median number of rooms in apartments:
Here:
3.9
State:
4.2
Notable locations in this zip code not listed on our city pages
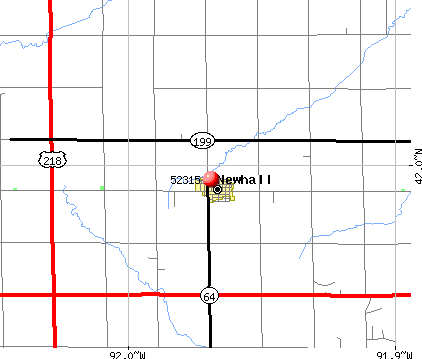
Notable locations in zip code 52315: Newhall Public Library (A), Newhall Fire Department (B), Newhall City Hall (C). Display/hide their locations on the map
Churches in zip code 52315 include: Central Presbyterian Church (A), Saint John Lutheran Church (B), Saint Paul's Catholic Church (C). Display/hide their locations on the map
Size of family households: 121 2-persons, 60 3-persons, 59 4-persons, 41 5-persons, 16 6-persons, 12 7-or-more-persons
Size of nonfamily households: 203 1-person, 12 2-persons
269 married couples with children.
79 single-parent households (22 men, 57 women).
99.7% of residents of 52315 zip code speak English at home.
0.1% of residents speak Asian or Pacific Island language at home (100% well).
Foreign born population: 2 (0.2%) (0.0% of them are naturalized citizens)
:
0.2%
Whole state:
6.0%
50%Malaysia
41%German
14%Irish
9%Czech
7%English
5%American
3%European
3%Swedish
Year of entry for the foreign-born population
22010 or later
02000 to 2009
01990 to 1999
0Before 1990
Facilities with environmental interests located in this zip code:
CENTRAL LUTHERAN SCH K-8 (310 3RD ST in NEWHALL, IA)
(Integrated Compliance Information System) - ICIS-07-1986-0237, FORMAL ENFORCEMENT ACTION COMPLIANCE ACTIVITY (Tracking inspections of insecticide, fungicide, and rodenticide, and toxic substances) Business SIC classification: ELEMENTARY AND SECONDARY SCHOOLS Alternative names: CENTRAL LUTHERAN SCHOOL
NEWHALL SEWER TREATMENT PLANT C/O CITY HALL (220 1ST STREET EAST in NEWHALL, IA)
National Pollutant Discharge Elimination System NON-MAJOR (Tracking pollutant discharge elimination systems) - permit Business SIC classification: SEWERAGE SYSTEMS Organizations: CITY OF NEWHALL (CONTACT/OWNER)
Alternative names: NEWHALL CITY OF STP
Housing units lacking complete kitchen facilities: 0.9%
61.4%Utility gas
25.4%Electricity
12.9%Bottled, tank, or LP gas
0.6%Fuel oil, kerosene, etc.
Population in 1990: 1,216. Population change in the 1990s: +16 (+1.3%).
Place of birth for U.S.-born residents:
This state: 1,109
Northeast: 65
Midwest: 63
South: 42
West: 18
74% of the 52315 zip code residents lived in the same house 5 years ago. Out of people who lived in different houses, 40% lived in this county. Out of people who lived in different counties, 50% lived in Iowa.
92% of the 52315 zip code residents lived in the same house 1 year ago. Out of people who lived in different houses, 87% moved from this county. Out of people who lived in different houses, 10% moved from different county within same state.
Private vs. public school enrollment:
Students in private schools in grades 1 to 8 (elementary and middle school): 21
Here:
16.7%
Iowa:
10.6%
Students in private schools in grades 9 to 12 (high school):
Here:
0.0%
Iowa:
7.9%
Students in private undergraduate colleges: 1
Here:
7.2%
Iowa:
23.9%
Occupation by median earnings in the past 12 months ($)
86,558Community and social service occupations
72,906Material moving occupations
67,641Management occupations
64,959Transportation occupations
54,925Business and financial operations occupations
54,235Construction and extraction occupations
Top industries in this zip code by the number of employees in 2005:
Educational Services: Elementary and Secondary Schools (20-49 employees: 1 establishment)
Wholesale Trade: Grain and Field Bean Merchant Wholesalers (10-19: 1, 1-4: 1)
Other Services (except Public Administration): Religious Organizations (5-9: 1)
Construction: Framing Contractors (5-9: 1)
Finance and Insurance: Insurance Agencies and Brokerages (1-4: 3)
Fatal accident statistics in 2011:
Fatal accident count: 1
Vehicles involved in fatal accidents: 2
Fatal accidents caused by drunken drivers: 0
Fatalities: 1
Persons involved in fatal accidents: 4
Pedestrians involved in fatal accidents: 0
Fatal accident statistics in 2010:
Fatal accident count: 1
Vehicles involved in fatal accidents: 2
Fatal accidents caused by drunken drivers: 0
Fatalities: 1
Persons involved in fatal accidents: 12
Pedestrians involved in fatal accidents: 0
2002 - 2018 National Fire Incident Reporting System (NFIRS) incidents
Based on the data from the years 2002 - 2018 the average number of fire incidents per year is 7. The highest number of fire incidents - 12 took place in 2003, and the least - 1 in 2017. The data has a decreasing trend.
When looking into fire subcategories, the most reports belonged to: Outside Fires (54.0%), and Structure Fires (25.0%).
Fire incident types reported to NFIRS in Zip Code 52315


 Nearest zip codes: 52206, 52354, 52346, 52332, 52318, 52209.


 Based on the data from the years 2002 - 2018 the average number of fire incidents per year is 7. The highest number of fire incidents - 12 took place in 2003, and the least - 1 in 2017. The data has a decreasing trend.
 When looking into fire subcategories, the most reports belonged to: Outside Fires (54.0%), and Structure Fires (25.0%).