Estimated zip code population in 2022: 1,825 Zip code population in 2010: 2,006 Zip code population in 2000: 2,085
Houses and condos: 778 Renter-occupied apartments: 73
% of renters here:
10%
State:
28%
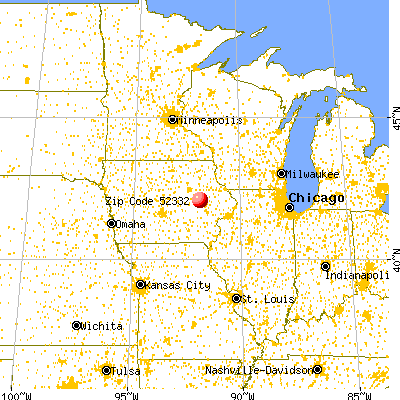
March 2022 cost of living index in zip code 52332: 83.6 (less than average, U.S. average is 100)
Land area: 42.3 sq. mi. Water area: 0.4 sq. mi.
Population density: 43 people per square mile
(very low).
OSM Map
General Map
Google Map
MSN Map
OSM Map
General Map
Google Map
MSN Map
OSM Map
General Map
Google Map
MSN Map
OSM Map
General Map
Google Map
MSN Map
Please wait while loading the map...
Real estate property taxes paid for housing units in 2022:
This zip code:
1.1% ($2,873)
Iowa:
1.4% ($2,724)
Median real estate property taxes paid for housing units with mortgages in 2022: $3,093 (1.2%) Median real estate property taxes paid for housing units with no mortgage in 2022: $2,701 (1.1%)
Business Search- 14 Million verified businesses
Males: 894
(49.0%)
Females: 931
(51.0%)
For population 25 years and over in 52332:
High school or higher: 94.8%
Bachelor's degree or higher: 18.7%
Graduate or professional degree: 6.6%
Unemployed: 0.4%
Mean travel time to work (commute): 27.1 minutes
For population 15 years and over in 52332:
Never married: 26.1%
Now married: 52.1%
Separated: 0.5%
Widowed: 6.9%
Divorced: 14.4%
Zip code 52332 compared to state average:
Unemployed percentage significantly below state average.
Black race population percentage significantly below state average.
Hispanic race population percentage below state average.
Median age above state average.
Foreign-born population percentage significantly below state average.
Renting percentage significantly below state average.
Length of stay since moving in above state average.
Percentage of population with a bachelor's degree or higher below state average.
Estimated median house/condo value in 2022: $252,037
52332:
$252,037
Iowa:
$194,600
According to our research of Iowa and other state lists, there were 2 registered sex offenders living in 52332 zip code as of June 16, 2024. The ratio of all residents to sex offenders in zip code 52332 is 1,121 to 1. The ratio of registered sex offenders to all residents in this zip code is lower than the state average.
Median resident age:
This zip code:
43.9 years
Iowa median age:
38.9 years
Average household size:
This zip code:
2.5 people
Iowa:
2.3 people
Averages for the 2020 tax year for zip code 52332, filed in 2021:
Average Adjusted Gross Income (AGI) in 2020: $65,817 (Individual Income Tax Returns)
Here:
$65,817
State:
$71,087
Salary/wage: $57,319 (reported on 81.1% of returns)
Here:
$57,319
State:
$57,361
(% of AGI for various income ranges: 1081.1% for AGIs below $25k, 3565.9% for AGIs $25k-50k, 7035.6% for AGIs $50k-75k, 10075.7% for AGIs $75k-100k, 15146.7% for AGIs $100k-200k)
Taxable interest for individuals: $809 (reported on 36.8% of returns)
This zip code:
$809
Iowa:
$1,633
(% of AGI for various income ranges: 21.1% for AGIs below $25k, 14.1% for AGIs $25k-50k, 27.8% for AGIs $50k-75k, 70.0% for AGIs $75k-100k, 95.8% for AGIs $100k-200k)
Ordinary dividends: $3,262 (reported on 22.1% of returns)
Here:
$3,262
State:
$5,432
(% of AGI for various income ranges: 12.1% for AGIs below $25k, 17.1% for AGIs $25k-50k, 100.0% for AGIs $50k-75k, 88.6% for AGIs $75k-100k, 400.8% for AGIs $100k-200k)
Net capital gain/loss in AGI: +$5,339 (reported on 18.9% of returns)
Here:
+$5,339
State:
+$15,243
(% of AGI for various income ranges: 7.9% for AGIs below $25k, 14.7% for AGIs $25k-50k, 167.8% for AGIs $50k-75k, 35.7% for AGIs $75k-100k, 620.8% for AGIs $100k-200k)
Profit/loss from business: +$10,000 (reported on 14.7% of returns)
Here:
+$10,000
State:
+$11,763
(% of AGI for various income ranges: 84.7% for AGIs below $25k, 79.4% for AGIs $25k-50k, 578.6% for AGIs $75k-100k, 582.5% for AGIs $100k-200k)
Taxable individual retirement arrangement distribution: $24,467 (reported on 12.6% of returns)
52332:
$24,467
Iowa:
$17,324
(% of AGI for various income ranges: 187.4% for AGIs below $25k, 318.9% for AGIs $50k-75k, 768.6% for AGIs $75k-100k, 1462.5% for AGIs $100k-200k)
Total itemized deductions: $28,830 (reported on 10.5% of returns)
Here:
$28,830
State:
$33,775
(% of AGI for various income ranges: 1417.8% for AGIs $50k-75k, 1339.2% for AGIs $100k-200k)
Charity contributions: $5,933 (reported on 3.2% of returns)
Here:
$5,933
State:
$13,075
(% of AGI for various income ranges: 254.3% for AGIs $75k-100k)
Taxes paid: $8,020 (reported on 5.3% of returns)
52332:
$8,020
State:
$7,704
(% of AGI for various income ranges: 176.7% for AGIs $50k-75k, 201.7% for AGIs $100k-200k)
Earned income credit: $2,127 (reported on 11.6% of returns)
Here:
$2,127
State:
$2,195
(% of AGI for various income ranges: 78.9% for AGIs below $25k, 49.4% for AGIs $25k-50k)
Percentage of individuals using paid preparers for their 2020 taxes: 94.7%
Here:
95%
State:
95%
(% for various income ranges: 96.2% for AGIs below $25k, 95.2% for AGIs $25k-50k, 92.9% for AGIs $50k-75k, 91.7% for AGIs $75k-100k, 94.7% for AGIs $100k-200k, 100.0% for AGIs over 200k)
Averages for the 2012 tax year for zip code 52332, filed in 2013:
Average Adjusted Gross Income (AGI) in 2012: $54,096 (Individual Income Tax Returns)
Here:
$54,096
State:
$58,860
Salary/wage: $47,912 (reported on 84.4% of returns)
Here:
$47,912
State:
$46,659
(% of AGI for various income ranges: 78.9% for AGIs below $25k, 80.0% for AGIs $25k-50k, 73.8% for AGIs $50k-75k, 85.7% for AGIs $75k-100k, 66.7% for AGIs $100k-200k)
Taxable interest for individuals: $837 (reported on 39.6% of returns)
This zip code:
$837
Iowa:
$1,537
(% of AGI for various income ranges: 1.4% for AGIs below $25k, 1.0% for AGIs $25k-50k, 0.4% for AGIs $50k-75k, 0.3% for AGIs $75k-100k, 0.5% for AGIs $100k-200k)
Ordinary dividends: $1,925 (reported on 20.8% of returns)
Here:
$1,925
State:
$4,542
(% of AGI for various income ranges: 0.9% for AGIs below $25k, 0.4% for AGIs $25k-50k, 0.8% for AGIs $50k-75k, 0.4% for AGIs $75k-100k, 1.0% for AGIs $100k-200k)
Net capital gain/loss in AGI: +$2,387 (reported on 15.6% of returns)
Here:
+$2,387
State:
+$11,802
(% of AGI for various income ranges: 0.2% for AGIs $25k-50k, 0.5% for AGIs $75k-100k, 1.5% for AGIs $100k-200k)
Profit/loss from business: +$4,308 (reported on 13.5% of returns)
Here:
+$4,308
State:
+$10,509
(% of AGI for various income ranges: 3.1% for AGIs below $25k, 1.2% for AGIs $25k-50k, 1.6% for AGIs $50k-75k, 2.0% for AGIs $75k-100k)
Taxable individual retirement arrangement distribution: $11,060 (reported on 10.4% of returns)
52332:
$11,060
Iowa:
$11,773
(% of AGI for various income ranges: 1.9% for AGIs below $25k, 2.1% for AGIs $25k-50k, 2.9% for AGIs $50k-75k, 5.9% for AGIs $75k-100k)
Total itemized deductions: $18,319 (21% of AGI, reported on 37.5% of returns)
Here:
$18,319
State:
$21,278
Here:
21.4% of AGI
State:
18.9% of AGI
(% of AGI for various income ranges: 12.7% for AGIs below $25k, 12.9% for AGIs $25k-50k, 12.6% for AGIs $50k-75k, 11.6% for AGIs $75k-100k, 13.2% for AGIs $100k-200k)
Charity contributions: $2,315 (reported on 28.1% of returns)
Here:
$2,315
State:
$4,044
(% of AGI for various income ranges: 1.6% for AGIs $25k-50k, 1.0% for AGIs $50k-75k, 1.3% for AGIs $75k-100k, 1.3% for AGIs $100k-200k)
Taxes paid: $6,800 (reported on 37.5% of returns)
52332:
$6,800
State:
$8,846
(% of AGI for various income ranges: 2.0% for AGIs below $25k, 3.2% for AGIs $25k-50k, 4.0% for AGIs $50k-75k, 4.7% for AGIs $75k-100k, 6.2% for AGIs $100k-200k)
Earned income credit: $2,000 (reported on 14.6% of returns)
Here:
$2,000
State:
$2,098
(% of AGI for various income ranges: 4.9% for AGIs below $25k, 1.0% for AGIs $25k-50k)
Percentage of individuals using paid preparers for their 2012 taxes: 59.4%
Here:
59%
State:
65%
(% for various income ranges: 50.0% for AGIs below $25k, 54.2% for AGIs $25k-50k, 71.4% for AGIs $50k-75k, 66.7% for AGIs $75k-100k, 71.4% for AGIs $100k-200k)
Averages for the 2004 tax year for zip code 52332, filed in 2005:
Average Adjusted Gross Income (AGI) in 2004: $43,561 (Individual Income Tax Returns)
Here:
$43,561
State:
$43,875
Salary/wage: $41,654 (reported on 88.0% of returns)
Here:
$41,654
State:
$38,265
(% of AGI for various income ranges: 85.3% for AGIs below $10k, 75.8% for AGIs $10k-25k, 83.5% for AGIs $25k-50k, 83.1% for AGIs $50k-75k, 90.9% for AGIs $75k-100k, 83.5% for AGIs over 100k)
Taxable interest for individuals: $1,089 (reported on 49.2% of returns)
This zip code:
$1,089
Iowa:
$1,768
(% of AGI for various income ranges: 5.7% for AGIs below $10k, 4.7% for AGIs $10k-25k, 0.9% for AGIs $25k-50k, 0.4% for AGIs $50k-75k, 1.0% for AGIs $75k-100k, 1.0% for AGIs over 100k)
Taxable dividends: $1,026 (reported on 26.0% of returns)
Here:
$1,026
State:
$2,510
(% of AGI for various income ranges: 1.2% for AGIs below $10k, 0.8% for AGIs $10k-25k, 0.7% for AGIs $25k-50k, 0.4% for AGIs $50k-75k, 0.7% for AGIs $75k-100k, 0.5% for AGIs over 100k)
Net capital gain/loss: +$1,852 (reported on 18.2% of returns)
Here:
+$1,852
State:
+$6,139
(% of AGI for various income ranges: -1.8% for AGIs below $10k, -0.3% for AGIs $10k-25k, 0.6% for AGIs $25k-50k, 0.3% for AGIs $50k-75k, 2.0% for AGIs $75k-100k, 1.0% for AGIs over 100k)
Profit/loss from business: +$4,139 (reported on 12.9% of returns)
Here:
+$4,139
State:
+$8,574
(% of AGI for various income ranges: 12.2% for AGIs below $10k, -2.4% for AGIs $10k-25k, 2.9% for AGIs $25k-50k, 2.3% for AGIs $50k-75k, 0.0% for AGIs $75k-100k)
Profit/loss from farming: +$525 (reported on 6.6% of returns)
Here:
+$525
State:
-$74
(% of AGI for various income ranges: 2.3% for AGIs below $10k, -0.2% for AGIs $25k-50k, -1.5% for AGIs $50k-75k, 2.6% for AGIs $75k-100k)
IRA payment deduction: $2,400 (reported on 1.7% of returns)
52332:
$2,400
Iowa:
$2,970
Total itemized deductions: $14,618 (21% of AGI, reported on 36.7% of returns)
Here:
$14,618
State:
$16,976
Here:
20.7% of AGI
State:
20.8% of AGI
(% of AGI for various income ranges: 10.9% for AGIs $10k-25k, 10.5% for AGIs $25k-50k, 12.7% for AGIs $50k-75k, 14.6% for AGIs $75k-100k, 12.9% for AGIs over 100k)
Charity contributions deductions: $1,922 (3% of AGI, reported on 31.6% of returns)
Here:
$1,922
State:
$3,089
Here:
2.6% of AGI
State:
3.6% of AGI
(% of AGI for various income ranges: 1.2% for AGIs $10k-25k, 0.9% for AGIs $25k-50k, 1.7% for AGIs $50k-75k, 1.2% for AGIs $75k-100k, 2.0% for AGIs over 100k)
Total tax: $5,240 (reported on 79.5% of returns)
52332:
$5,240
State:
$6,177
(% of AGI for various income ranges: 3.3% for AGIs below $10k, 4.0% for AGIs $10k-25k, 6.9% for AGIs $25k-50k, 8.9% for AGIs $50k-75k, 9.2% for AGIs $75k-100k, 16.4% for AGIs over 100k)
Earned income credit: $1,508 (reported on 14.3% of returns)
Here:
$1,508
State:
$1,540
Percentage of individuals using paid preparers for their 2004 taxes: 65.7%
Here:
66%
State:
70%
(% for various income ranges: 52.2% for AGIs below $10k, 68.4% for AGIs $10k-25k, 70.6% for AGIs $25k-50k, 73.7% for AGIs $50k-75k, 53.9% for AGIs $75k-100k, 62.7% for AGIs over 100k)
Household received Food Stamps/SNAP in the past 12 months: 33 Household did not receive Food Stamps/SNAP in the past 12 months: 682
Women who had a birth in the past 12 months: 20 (20 now married, 0 unmarried) Women who did not have a birth in the past 12 months: 363 (155 now married, 208 unmarried)
Housing units in zip code 52332 with a mortgage: 358 (22 second mortgage, 18 both second mortgage and home equity loan) Houses without a mortgage: 7
Median monthly owner costs for units with a mortgage: $1,545 Median monthly owner costs for units without a mortgage: $594
Residents with income below the poverty level in 2022:
This zip code:
6.7%
Whole state:
11.0%
Residents with income below 50% of the poverty level in 2022:
This zip code:
4.3%
Whole state:
5.5%
Median number of rooms in houses and condos:
Here:
6.4
State:
6.8
Median number of rooms in apartments:
Here:
5.7
State:
4.2
Notable locations in this zip code not listed on our city pages
Notable locations in zip code 52332: Shellsburg Elevator (A), Shellsburg (B), Shellsburg Public Library (C), Canton - Benton - Shellsburg Fire Administration (D). Display/hide their locations on the map
Churches in zip code 52332 include: First Presbyterian Church (A), Zion Lutheran Church (B), Oak Grove Church (C), Parkers Grove Church (D). Display/hide their locations on the map
Cemeteries: Oakwood Cemetery (1), Parkers Grove Cemetery (2), Pleasant Ridge Cemetery (3), McBroom Cemetery (4), Shellsburg Cemetery (5). Display/hide their locations on the map
In group quarters: 20 (-1 institutionalized population)
Size of family households: 263 2-persons, 66 3-persons, 76 4-persons, 45 5-persons, 13 6-persons, 6 7-or-more-persons
Size of nonfamily households: 159 1-person, 66 2-persons, 12 3-persons
277 married couples with children.
26 single-parent households (18 men, 8 women).
98.6% of residents of 52332 zip code speak English at home.
1.0% of residents speak Spanish at home (47% very well, 53% not well).
0.1% of residents speak other Indo-European language at home (100% very well).
Foreign born population: 11 (0.7%) (100.0% of them are naturalized citizens)
This zip code:
0.7%
Whole state:
6.0%
91%Honduras
24%American
22%German
16%English
10%Irish
8%Czech
5%European
4%Norwegian
Year of entry for the foreign-born population
02010 or later
02000 to 2009
21990 to 1999
19Before 1990
Facilities with environmental interests located in this zip code:
SHELLSBURG ELEMENTARY SCHOOL (203 COTTAGE ST in SHELLSBURG, IA)
(Geographic Names Information System) (National Center for Education Statistics) - STATE ID-066660 421 Organizations: VINTON-SHELLSBURG COMM SCHOOL DISTRICT (SCHOOL DISTRICT)
SHELLSBURG COMMUNITY SCHOOL (203 COTTAGE ST in SHELLSBURG, IA)
COMPLIANCE ACTIVITY (Tracking inspections of insecticide, fungicide, and rodenticide, and toxic substances) (Resource Conservation and Recovery Act (tracking hazardous waste)) Organizations: SHELLSBURG COMMUNITY SCHOOL DISTRICT (CONTACT/OWNER)
Alternative names: SHELLSBURG COMM SCHOOLS, SHELLSBURG COMM SCHOOL DIST
SHELLSBURG CITY OF STP (CITY CLERK in SHELLSBURG, IA)
National Pollutant Discharge Elimination System NON-MAJOR (Tracking pollutant discharge elimination systems) - permit Business SIC classification: SEWERAGE SYSTEMS
CROELL REDI MIX (111 OAK STREET SOUTHWEST in SHELLSBURG, IA)
AIR MINOR (AIRS/AFS) Business SIC classification: READY-MIXED CONCRETE
SHELLSBURG GRAIN & LUMBER (207 COMMERCIAL STREET in SHELLSBURG, IA)
AIR MINOR (AIRS/AFS) Business SIC classification: NONCLASSIFIABLE ESTABLISHMENTS Alternative names: SHELLSBURG GRN & LBR
Housing units lacking complete plumbing facilities: 4.8% Housing units lacking complete kitchen facilities: 6.2%
39.7%Utility gas
29.2%Bottled, tank, or LP gas
25.0%Electricity
3.6%Other fuel
1.9%Wood
1.0%Fuel oil, kerosene, etc.
Population in 1990: 1,463. Population change in the 1990s: +622 (+42.5%).
Place of birth for U.S.-born residents:
This state: 1,584
Northeast: 10
Midwest: 80
South: 116
West: 10
51% of the 52332 zip code residents lived in the same house 5 years ago. Out of people who lived in different houses, 31% lived in this county. Out of people who lived in different counties, 50% lived in Iowa.
91% of the 52332 zip code residents lived in the same house 1 year ago. Out of people who lived in different houses, 35% moved from this county. Out of people who lived in different houses, 66% moved from different county within same state.
Private vs. public school enrollment:
Students in private schools in grades 1 to 8 (elementary and middle school): 22
Here:
15.9%
Iowa:
10.6%
Students in private schools in grades 9 to 12 (high school): 10
Here:
10.2%
Iowa:
7.9%
Students in private undergraduate colleges:
Here:
0.0%
Iowa:
23.9%
Occupation by median earnings in the past 12 months ($)
80,992Installation, maintenance, and repair occupations
72,560Management occupations
67,483Production occupations
55,755Health diagnosing and treating practitioners and other technical occupations
54,961Construction and extraction occupations
52,580Office and administrative support occupations
Top industries in this zip code by the number of employees in 2005:
Health Care and Social Assistance: Continuing Care Retirement Communities (20-49 employees: 1 establishment)
Arts, Entertainment, and Recreation: Golf Courses and Country Clubs (10-19: 1)
Construction: Poured Concrete Foundation and Structure Contractors (10-19: 1)
Accommodation and Food Services: Full-Service Restaurants (5-9: 1)
Construction: Masonry Contractors (5-9: 1)
Construction: New Single-Family Housing Construction (except Operative Builders) (1-4: 3)
People in group quarters in 2010:
23 people in nursing facilities/skilled-nursing facilities
People in group quarters in 2000:
23 people in other noninstitutional group quarters
Fatal accident statistics in 2013:
Fatal accident count: 1
Vehicles involved in fatal accidents: 1
Fatal accidents caused by drunken drivers: 1
Fatalities: 1
Persons involved in fatal accidents: 1
Pedestrians involved in fatal accidents: 0
Fatal accident statistics in 2012:
Fatal accident count: 1
Vehicles involved in fatal accidents: 1
Fatal accidents caused by drunken drivers: 1
Fatalities: 1
Persons involved in fatal accidents: 1
Pedestrians involved in fatal accidents: 0
2002 - 2018 National Fire Incident Reporting System (NFIRS) incidents
Based on the data from the years 2002 - 2018 the average number of fire incidents per year is 10. The highest number of fire incidents - 31 took place in 2003, and the least - 0 in 2017. The data has a decreasing trend.
When looking into fire subcategories, the most reports belonged to: Outside Fires (57.2%), and Structure Fires (32.9%).
Fire incident types reported to NFIRS in Zip Code 52332


+$525
-$74
(% of AGI for various income ranges: 2.3% for AGIs below $10k, -0.2% for AGIs $25k-50k, -1.5% for AGIs $50k-75k, 2.6% for AGIs $75k-100k)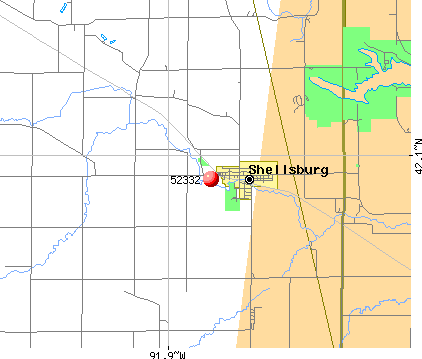 Nearest zip codes: 52324, 52206, 52315, 52349, 52345, 52341.


 Based on the data from the years 2002 - 2018 the average number of fire incidents per year is 10. The highest number of fire incidents - 31 took place in 2003, and the least - 0 in 2017. The data has a decreasing trend.
 When looking into fire subcategories, the most reports belonged to: Outside Fires (57.2%), and Structure Fires (32.9%).