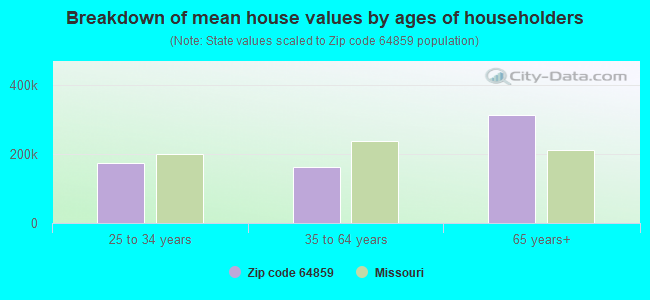
Estimated median house/condo value in 2022: $111,820
64859:
$111,820
Missouri:
$221,200
According to our research of Missouri and other state lists, there were 3 registered sex offenders living in 64859 zip code as of June 16, 2024. The ratio of all residents to sex offenders in zip code 64859 is 490 to 1. The ratio of registered sex offenders to all residents in this zip code is lower than the state average.
Median resident age:
This zip code:
44.2 years
Missouri median age:
39.1 years
Average household size:
This zip code:
2.4 people
Missouri:
2.4 people
Averages for the 2020 tax year for zip code 64859, filed in 2021:
Average Adjusted Gross Income (AGI) in 2020: $40,807 (Individual Income Tax Returns)
Here:
$40,807
State:
$68,151
Salary/wage: $39,209 (reported on 77.6% of returns)
Here:
$39,209
State:
$56,131
(% of AGI for various income ranges: 1371.7% for AGIs below $25k, 3748.2% for AGIs $25k-50k, 6920.0% for AGIs $50k-75k, 7295.0% for AGIs $75k-100k)
Taxable interest for individuals: $300 (reported on 19.0% of returns)
This zip code:
$300
Missouri:
$1,586
(% of AGI for various income ranges: 8.3% for AGIs below $25k, 14.0% for AGIs $50k-75k, 18.3% for AGIs $75k-100k)
Ordinary dividends: $1,412 (reported on 13.8% of returns)
Here:
$1,412
State:
$10,947
(% of AGI for various income ranges: 59.1% for AGIs $25k-50k, 80.0% for AGIs $75k-100k)
Net capital gain/loss in AGI: +$4,043 (reported on 12.1% of returns)
Here:
+$4,043
State:
+$18,453
(% of AGI for various income ranges: 95.5% for AGIs $25k-50k, 296.7% for AGIs $75k-100k)
Profit/loss from business: +$7,922 (reported on 15.5% of returns)
Here:
+$7,922
State:
+$12,260
(% of AGI for various income ranges: 164.4% for AGIs below $25k, 175.5% for AGIs $25k-50k, 448.0% for AGIs $50k-75k)
Taxable individual retirement arrangement distribution: $8,300 (reported on 5.2% of returns)
64859:
$8,300
Missouri:
$19,719
(% of AGI for various income ranges: 226.4% for AGIs $25k-50k)
Earned income credit: $2,571 (reported on 24.1% of returns)
Here:
$2,571
State:
$2,315
(% of AGI for various income ranges: 138.9% for AGIs below $25k, 100.0% for AGIs $25k-50k)
Percentage of individuals using paid preparers for their 2020 taxes: 96.6%
Here:
97%
State:
93%
(% for various income ranges: 92.3% for AGIs below $25k, 100.0% for AGIs $25k-50k, 100.0% for AGIs $50k-75k, 100.0% for AGIs $75k-100k, 100.0% for AGIs $100k-200k)
Averages for the 2012 tax year for zip code 64859, filed in 2013:
Average Adjusted Gross Income (AGI) in 2012: $35,994 (Individual Income Tax Returns)
Here:
$35,994
State:
$55,896
Salary/wage: $34,111 (reported on 88.7% of returns)
Here:
$34,111
State:
$46,205
(% of AGI for various income ranges: 83.3% for AGIs below $25k, 88.2% for AGIs $25k-50k, 87.2% for AGIs $50k-75k, 85.5% for AGIs $75k-100k, 72.4% for AGIs $100k-200k)
Taxable interest for individuals: $250 (reported on 18.9% of returns)
This zip code:
$250
Missouri:
$1,559
(% of AGI for various income ranges: 0.1% for AGIs $25k-50k, 0.2% for AGIs $50k-75k, 0.3% for AGIs $75k-100k)
Ordinary dividends: $1,233 (reported on 11.3% of returns)
Here:
$1,233
State:
$7,410
Net capital gain/loss in AGI: +$3,300 (reported on 7.5% of returns)
Here:
+$3,300
State:
+$11,579
Profit/loss from business: +$4,812 (reported on 15.1% of returns)
Here:
+$4,812
State:
+$11,688
Taxable individual retirement arrangement distribution: $4,333 (reported on 5.7% of returns)
64859:
$4,333
Missouri:
$14,773
(% of AGI for various income ranges: 4.2% for AGIs below $25k)
Total itemized deductions: $20,500 (27% of AGI, reported on 15.1% of returns)
Here:
$20,500
State:
$22,730
Here:
27.3% of AGI
State:
19.2% of AGI
Charity contributions: $4,380 (reported on 9.4% of returns)
Here:
$4,380
State:
$4,745
Taxes paid: $4,412 (reported on 15.1% of returns)
64859:
$4,412
State:
$8,399
Earned income credit: $2,280 (reported on 28.3% of returns)
Here:
$2,280
State:
$2,288
(% of AGI for various income ranges: 7.6% for AGIs below $25k, 1.9% for AGIs $25k-50k)
Percentage of individuals using paid preparers for their 2012 taxes: 62.3%
Here:
62%
State:
55%
(% for various income ranges: 56.0% for AGIs below $25k, 62.5% for AGIs $25k-50k, 71.4% for AGIs $50k-75k, 66.7% for AGIs $75k-100k, 100.0% for AGIs $100k-200k)
Averages for the 2004 tax year for zip code 64859, filed in 2005:
Average Adjusted Gross Income (AGI) in 2004: $29,949 (Individual Income Tax Returns)
Here:
$29,949
State:
$44,591
Salary/wage: $29,544 (reported on 89.4% of returns)
Here:
$29,544
State:
$38,941
(% of AGI for various income ranges: 120.5% for AGIs below $10k, 82.2% for AGIs $10k-25k, 89.9% for AGIs $25k-50k, 91.4% for AGIs $50k-75k, 79.8% for AGIs $75k-100k)
Taxable interest for individuals: $701 (reported on 32.4% of returns)
This zip code:
$701
Missouri:
$1,801
(% of AGI for various income ranges: 2.9% for AGIs below $10k, 2.6% for AGIs $10k-25k, 0.4% for AGIs $25k-50k, 0.1% for AGIs $50k-75k, 0.1% for AGIs $75k-100k)
Taxable dividends: $452 (reported on 16.1% of returns)
Here:
$452
State:
$3,677
Net capital gain/loss: +$3,169 (reported on 15.6% of returns)
Here:
+$3,169
State:
+$8,915
Profit/loss from business: +$1,690 (reported on 12.8% of returns)
Here:
+$1,690
State:
+$9,793
Total itemized deductions: $14,925 (28% of AGI, reported on 14.8% of returns)
Here:
$14,925
State:
$18,261
Here:
28.2% of AGI
State:
20.5% of AGI
(% of AGI for various income ranges: 6.5% for AGIs $10k-25k, 5.9% for AGIs $25k-50k, 9.7% for AGIs $50k-75k, 9.0% for AGIs $75k-100k)
Charity contributions deductions: $2,975 (5% of AGI, reported on 8.8% of returns)
Here:
$2,975
State:
$3,665
Here:
5.1% of AGI
State:
3.9% of AGI
Total tax: $2,520 (reported on 70.3% of returns)
64859:
$2,520
State:
$6,999
(% of AGI for various income ranges: 2.0% for AGIs below $10k, 3.4% for AGIs $10k-25k, 5.4% for AGIs $25k-50k, 7.3% for AGIs $50k-75k, 8.7% for AGIs $75k-100k)
Earned income credit: $1,779 (reported on 22.9% of returns)
Here:
$1,779
State:
$1,728
Percentage of individuals using paid preparers for their 2004 taxes: 72.0%
Here:
72%
State:
62%
(% for various income ranges: 69.0% for AGIs below $10k, 68.9% for AGIs $10k-25k, 79.7% for AGIs $25k-50k, 69.8% for AGIs $50k-75k, 61.9% for AGIs $75k-100k)
Household received Food Stamps/SNAP in the past 12 months: 126 Household did not receive Food Stamps/SNAP in the past 12 months: 393
Women who had a birth in the past 12 months: 15 (11 now married, 4 unmarried) Women who did not have a birth in the past 12 months: 271 (116 now married, 154 unmarried)
Housing units in zip code 64859 with a mortgage: 174 (16 second mortgage, 15 both second mortgage and home equity loan) Houses without a mortgage: 4
Median monthly owner costs for units with a mortgage: $1,131 Median monthly owner costs for units without a mortgage: $301
Residents with income below the poverty level in 2022:
This zip code:
24.7%
Whole state:
13.2%
Residents with income below 50% of the poverty level in 2022:
This zip code:
6.5%
Whole state:
6.8%
Median number of rooms in houses and condos:
Here:
5.9
State:
6.4
Median number of rooms in apartments:
Here:
5.9
State:
4.4
Notable locations in this zip code not listed on our city pages
Cemeteries: Harvey Cemetery (1), New Hope Cemetery (2), Arthur Cemetery (3), Reeds Cemetery (4), Avilla Cemetery (5), Stemons Cemetery (6), Williams Cemetery (7). Display/hide their locations on the map
Size of family households: 157 2-persons, 120 3-persons, 59 4-persons, 7 5-persons, 20 6-persons
Size of nonfamily households: 146 1-person, 8 2-persons
114 married couples with children.
24 single-parent households (24 women).
97.1% of residents of 64859 zip code speak English at home.
2.5% of residents speak Spanish at home (53% very well, 20% well, 27% not well).
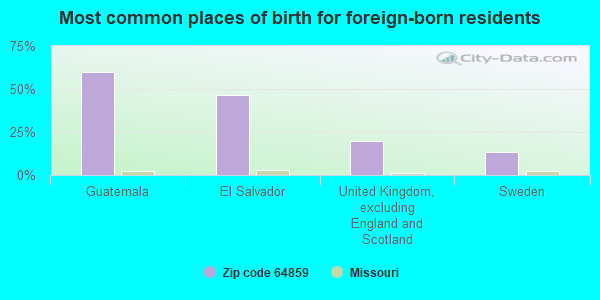
Foreign born population: 15 (1.2%) (18.9% of them are naturalized citizens)
This zip code:
1.2%
Whole state:
4.1%
60%Guatemala
47%El Salvador
20%United Kingdom, excluding England and Scotland
13%Sweden
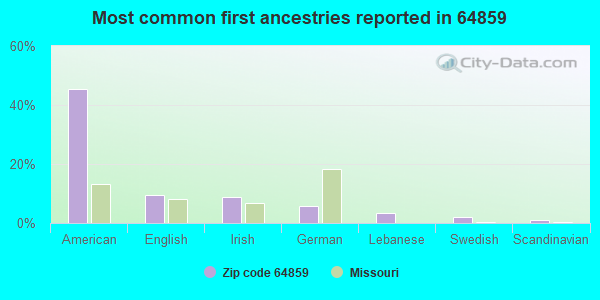
46%American
9%English
9%Irish
6%German
3%Lebanese
2%Swedish
1%Scandinavian
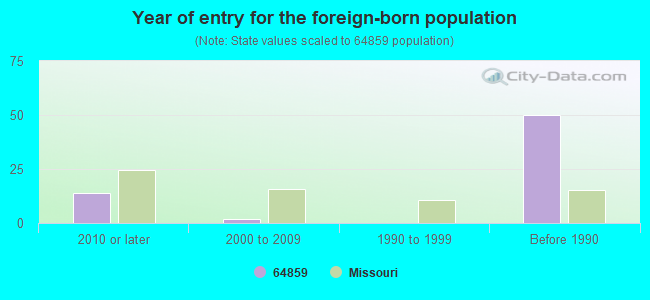
Year of entry for the foreign-born population
142010 or later
22000 to 2009
01990 to 1999
50Before 1990
Facilities with environmental interests located in this zip code:
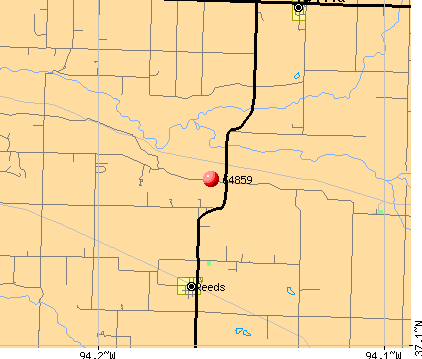
CHRIS HUFF (7470 ELM ROAD in REEDS, MO)
STATE MASTER (Missouri monitoring and compilance) - PCS-MOG010348, NPDES NON-MAJOR National Pollutant Discharge Elimination System NON-MAJOR (Tracking pollutant discharge elimination systems) - permit Business SIC classification: CHICKEN EGGS Alternative names: HUFF, CHRIS, PAGE, GLEN
Housing units lacking complete plumbing facilities: 1.1% Housing units lacking complete kitchen facilities: 1.1%
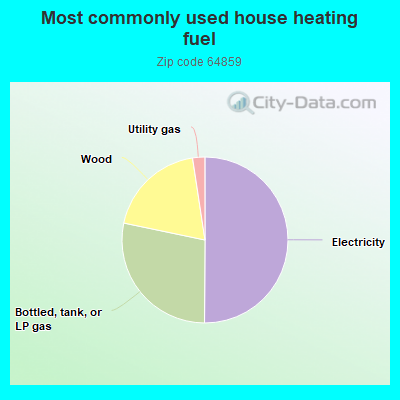
50.3%Electricity
28.3%Bottled, tank, or LP gas
19.4%Wood
2.4%Utility gas
Population in 1990: 222. Population change in the 1990s: +929 (+418.5%).
Place of birth for U.S.-born residents:
This state: 872
Northeast: 5
Midwest: 203
South: 62
West: 38
60% of the 64859 zip code residents lived in the same house 5 years ago. Out of people who lived in different houses, 63% lived in this county. Out of people who lived in different counties, 50% lived in Missouri.
97% of the 64859 zip code residents lived in the same house 1 year ago. Out of people who lived in different houses, 64% moved from this county. Out of people who lived in different houses, 48% moved from different state.
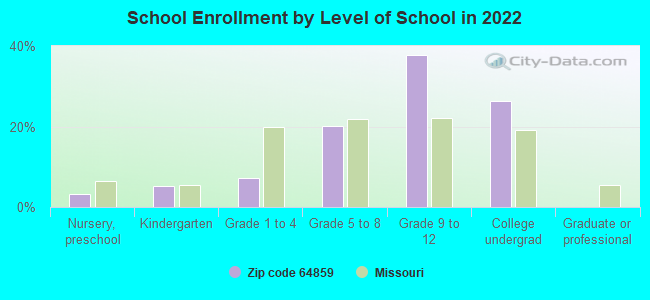
Private vs. public school enrollment:
Students in private schools in grades 1 to 8 (elementary and middle school): 2
Here:
5.4%
Missouri:
15.4%
Students in private schools in grades 9 to 12 (high school): 7
Here:
9.5%
Missouri:
13.9%
Students in private undergraduate colleges:
Here:
0.0%
Missouri:
22.6%
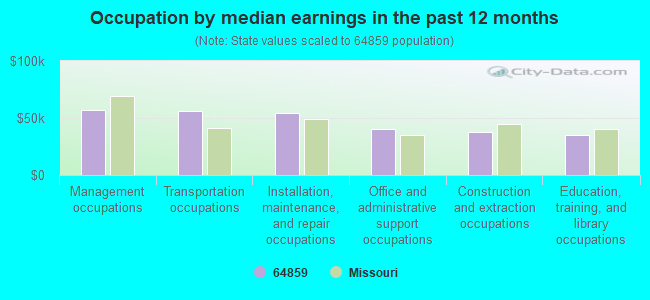
Occupation by median earnings in the past 12 months ($)
56,604Management occupations
55,706Transportation occupations
54,787Installation, maintenance, and repair occupations
40,247Office and administrative support occupations
37,826Construction and extraction occupations
35,020Education, training, and library occupations
Top industries in this zip code by the number of employees in 2005:
Construction: Commercial and Institutional Building Construction (5-9 employees: 2 establishments)
Other Services (except Public Administration): Commercial and Industrial Machinery and Equipment (except Automotive and Electronic) Repair and Maintenance (1-4: 1)
Professional, Scientific, and Technical Services: Offices of Certified Public Accountants (1-4: 1)
Construction: Framing Contractors (1-4: 1)
Construction: Electrical Contractors (1-4: 1)
Home Mortgage Disclosure Act Aggregated Statistics For Year 2009 (Based on 4 partial tracts)
A) FHA, FSA/RHS & VA Home Purchase Loans
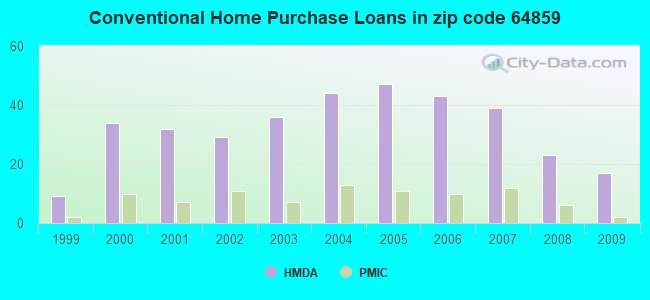
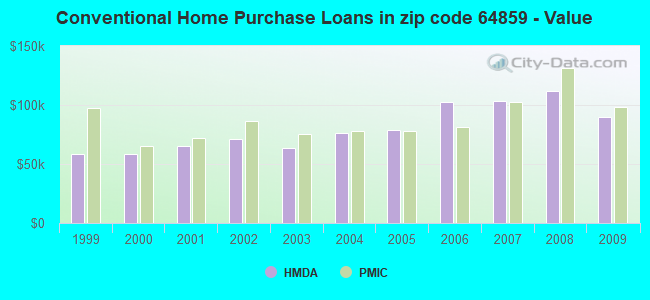
B) Conventional Home Purchase Loans
C) Refinancings
D) Home Improvement Loans
F) Non-occupant Loans on < 5 Family Dwellings (A B C & D)
G) Loans On Manufactured Home Dwelling (A B C & D)
Number
Average Value
Number
Average Value
Number
Average Value
Number
Average Value
Number
Average Value
Number
Average Value
LOANS ORIGINATED
10
$102,299
17
$89,894
65
$125,328
9
$55,156
5
$61,238
8
$52,426
APPLICATIONS APPROVED, NOT ACCEPTED
0
$0
0
$0
5
$136,484
1
$32,790
0
$0
1
$41,700
APPLICATIONS DENIED
1
$70,190
3
$52,980
25
$145,752
5
$48,294
1
$56,070
1
$58,390
APPLICATIONS WITHDRAWN
1
$56,670
1
$58,630
12
$122,651
1
$20,000
0
$0
2
$46,660
FILES CLOSED FOR INCOMPLETENESS
0
$0
0
$0
3
$104,440
0
$0
0
$0
0
$0
Aggregated Statistics For Year 2008 (Based on 4 partial tracts)
A) FHA, FSA/RHS & VA Home Purchase Loans
B) Conventional Home Purchase Loans
C) Refinancings
D) Home Improvement Loans
F) Non-occupant Loans on < 5 Family Dwellings (A B C & D)
G) Loans On Manufactured Home Dwelling (A B C & D)
Number
Average Value
Number
Average Value
Number
Average Value
Number
Average Value
Number
Average Value
Number
Average Value
LOANS ORIGINATED
6
$102,812
23
$112,198
46
$109,098
8
$30,041
7
$83,673
8
$69,551
APPLICATIONS APPROVED, NOT ACCEPTED
0
$0
2
$146,870
6
$111,727
4
$39,232
0
$0
3
$77,877
APPLICATIONS DENIED
2
$123,315
13
$74,675
29
$116,888
10
$34,462
0
$0
9
$53,030
APPLICATIONS WITHDRAWN
0
$0
1
$215,510
10
$108,784
3
$114,587
1
$97,080
1
$95,820
FILES CLOSED FOR INCOMPLETENESS
0
$0
1
$264,690
4
$103,952
0
$0
0
$0
0
$0
Aggregated Statistics For Year 2007 (Based on 4 partial tracts)
A) FHA, FSA/RHS & VA Home Purchase Loans
B) Conventional Home Purchase Loans
C) Refinancings
D) Home Improvement Loans
F) Non-occupant Loans on < 5 Family Dwellings (A B C & D)
G) Loans On Manufactured Home Dwelling (A B C & D)
Number
Average Value
Number
Average Value
Number
Average Value
Number
Average Value
Number
Average Value
Number
Average Value
LOANS ORIGINATED
6
$113,727
39
$103,476
55
$100,002
9
$41,334
13
$88,608
13
$52,106
APPLICATIONS APPROVED, NOT ACCEPTED
0
$0
2
$118,520
8
$91,548
1
$83,400
0
$0
2
$59,110
APPLICATIONS DENIED
0
$0
9
$86,161
41
$122,130
14
$37,273
3
$102,447
7
$63,847
APPLICATIONS WITHDRAWN
0
$0
3
$130,303
15
$117,141
2
$24,240
0
$0
0
$0
FILES CLOSED FOR INCOMPLETENESS
0
$0
0
$0
6
$184,923
1
$50,870
0
$0
0
$0
Aggregated Statistics For Year 2006 (Based on 4 partial tracts)
A) FHA, FSA/RHS & VA Home Purchase Loans
B) Conventional Home Purchase Loans
C) Refinancings
D) Home Improvement Loans
F) Non-occupant Loans on < 5 Family Dwellings (A B C & D)
G) Loans On Manufactured Home Dwelling (A B C & D)
Number
Average Value
Number
Average Value
Number
Average Value
Number
Average Value
Number
Average Value
Number
Average Value
LOANS ORIGINATED
5
$81,290
43
$102,731
50
$92,641
14
$27,749
7
$94,719
14
$50,009
APPLICATIONS APPROVED, NOT ACCEPTED
0
$0
5
$63,522
8
$71,555
1
$37,480
0
$0
3
$40,867
APPLICATIONS DENIED
1
$74,530
15
$70,595
35
$93,359
9
$35,641
1
$163,370
10
$48,870
APPLICATIONS WITHDRAWN
0
$0
4
$124,505
19
$100,251
2
$32,945
0
$0
1
$90,070
FILES CLOSED FOR INCOMPLETENESS
0
$0
0
$0
5
$108,214
0
$0
0
$0
0
$0
Aggregated Statistics For Year 2005 (Based on 4 partial tracts)
A) FHA, FSA/RHS & VA Home Purchase Loans
B) Conventional Home Purchase Loans
C) Refinancings
D) Home Improvement Loans
F) Non-occupant Loans on < 5 Family Dwellings (A B C & D)
G) Loans On Manufactured Home Dwelling (A B C & D)
Number
Average Value
Number
Average Value
Number
Average Value
Number
Average Value
Number
Average Value
Number
Average Value
LOANS ORIGINATED
5
$97,608
47
$78,577
70
$99,774
14
$38,090
7
$47,999
17
$57,672
APPLICATIONS APPROVED, NOT ACCEPTED
1
$64,220
5
$43,582
10
$100,464
0
$0
0
$0
5
$39,508
APPLICATIONS DENIED
0
$0
19
$52,838
45
$97,304
9
$35,226
1
$41,330
15
$45,789
APPLICATIONS WITHDRAWN
0
$0
4
$80,438
28
$100,235
6
$121,968
1
$398,140
2
$75,410
FILES CLOSED FOR INCOMPLETENESS
0
$0
0
$0
4
$83,732
0
$0
0
$0
0
$0
Aggregated Statistics For Year 2004 (Based on 4 partial tracts)
A) FHA, FSA/RHS & VA Home Purchase Loans
B) Conventional Home Purchase Loans
C) Refinancings
D) Home Improvement Loans
F) Non-occupant Loans on < 5 Family Dwellings (A B C & D)
G) Loans On Manufactured Home Dwelling (A B C & D)
Number
Average Value
Number
Average Value
Number
Average Value
Number
Average Value
Number
Average Value
Number
Average Value
LOANS ORIGINATED
2
$84,235
44
$76,428
59
$93,894
15
$68,719
9
$42,649
14
$58,452
APPLICATIONS APPROVED, NOT ACCEPTED
0
$0
5
$69,660
14
$96,028
1
$48,370
1
$65,890
4
$61,912
APPLICATIONS DENIED
2
$90,285
16
$55,114
44
$86,726
6
$48,687
0
$0
17
$57,262
APPLICATIONS WITHDRAWN
1
$104,780
3
$125,267
26
$92,740
2
$82,700
0
$0
2
$79,515
FILES CLOSED FOR INCOMPLETENESS
0
$0
0
$0
6
$89,080
0
$0
0
$0
0
$0
Aggregated Statistics For Year 2003 (Based on 4 partial tracts)
A) FHA, FSA/RHS & VA Home Purchase Loans
B) Conventional Home Purchase Loans
C) Refinancings
D) Home Improvement Loans
F) Non-occupant Loans on < 5 Family Dwellings (A B C & D)
Number
Average Value
Number
Average Value
Number
Average Value
Number
Average Value
Number
Average Value
LOANS ORIGINATED
5
$84,846
36
$63,611
105
$98,721
18
$26,363
12
$31,828
APPLICATIONS APPROVED, NOT ACCEPTED
1
$71,450
2
$97,880
9
$99,223
1
$37,530
0
$0
APPLICATIONS DENIED
1
$90,160
15
$61,891
50
$79,827
10
$15,319
3
$83,487
APPLICATIONS WITHDRAWN
0
$0
3
$72,347
30
$85,689
2
$26,090
0
$0
FILES CLOSED FOR INCOMPLETENESS
0
$0
0
$0
5
$76,444
0
$0
1
$35,400
Aggregated Statistics For Year 2002 (Based on 4 partial tracts)
A) FHA, FSA/RHS & VA Home Purchase Loans
B) Conventional Home Purchase Loans
C) Refinancings
D) Home Improvement Loans
F) Non-occupant Loans on < 5 Family Dwellings (A B C & D)
Number
Average Value
Number
Average Value
Number
Average Value
Number
Average Value
Number
Average Value
LOANS ORIGINATED
3
$45,403
29
$71,188
78
$85,811
8
$21,145
5
$75,220
APPLICATIONS APPROVED, NOT ACCEPTED
0
$0
7
$66,021
10
$86,942
0
$0
1
$35,220
APPLICATIONS DENIED
0
$0
12
$84,338
36
$73,922
3
$15,190
1
$25,440
APPLICATIONS WITHDRAWN
1
$94,130
4
$79,375
17
$77,239
1
$35,030
0
$0
FILES CLOSED FOR INCOMPLETENESS
0
$0
2
$48,465
4
$70,520
0
$0
0
$0
Aggregated Statistics For Year 2001 (Based on 4 partial tracts)
A) FHA, FSA/RHS & VA Home Purchase Loans
B) Conventional Home Purchase Loans
C) Refinancings
D) Home Improvement Loans
F) Non-occupant Loans on < 5 Family Dwellings (A B C & D)
Number
Average Value
Number
Average Value
Number
Average Value
Number
Average Value
Number
Average Value
LOANS ORIGINATED
8
$68,659
32
$65,568
69
$85,308
9
$35,622
7
$53,406
APPLICATIONS APPROVED, NOT ACCEPTED
0
$0
4
$42,278
2
$67,010
1
$43,250
0
$0
APPLICATIONS DENIED
1
$97,720
20
$55,226
29
$70,123
8
$16,860
1
$6,380
APPLICATIONS WITHDRAWN
0
$0
4
$109,952
19
$69,389
1
$11,320
0
$0
FILES CLOSED FOR INCOMPLETENESS
0
$0
0
$0
3
$51,987
0
$0
0
$0
Aggregated Statistics For Year 2000 (Based on 4 partial tracts)
A) FHA, FSA/RHS & VA Home Purchase Loans
B) Conventional Home Purchase Loans
C) Refinancings
D) Home Improvement Loans
F) Non-occupant Loans on < 5 Family Dwellings (A B C & D)
Number
Average Value
Number
Average Value
Number
Average Value
Number
Average Value
Number
Average Value
LOANS ORIGINATED
2
$93,200
34
$58,238
36
$80,313
5
$21,934
5
$29,424
APPLICATIONS APPROVED, NOT ACCEPTED
0
$0
5
$54,312
4
$45,312
2
$28,980
1
$31,690
APPLICATIONS DENIED
2
$179,120
25
$44,200
20
$53,632
3
$17,903
0
$0
APPLICATIONS WITHDRAWN
0
$0
2
$84,025
12
$58,842
1
$8,340
0
$0
FILES CLOSED FOR INCOMPLETENESS
0
$0
0
$0
3
$64,160
0
$0
0
$0
Aggregated Statistics For Year 1999 (Based on 2 partial tracts)
A) FHA, FSA/RHS & VA Home Purchase Loans
B) Conventional Home Purchase Loans
C) Refinancings
D) Home Improvement Loans
F) Non-occupant Loans on < 5 Family Dwellings (A B C & D)

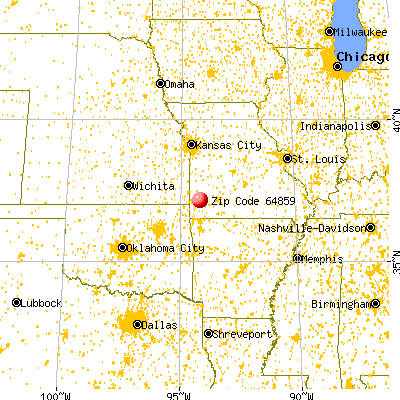


 Nearest zip codes: 64833, 64862, 64836, 64848, 64873, 65756.