Bridge Statistics for Murray, Utah (UT)
Condition, Traffic, Stress, Structural Evaluation, Project Costs
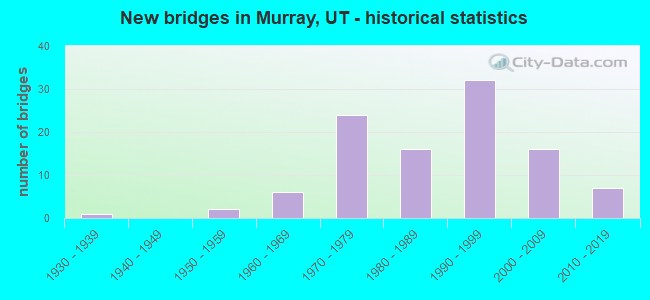
- New bridges - historical statistics
- 11930-1939
- 21950-1959
- 61960-1969
- 241970-1979
- 161980-1989
- 321990-1999
- 162000-2009
- 72010-2019
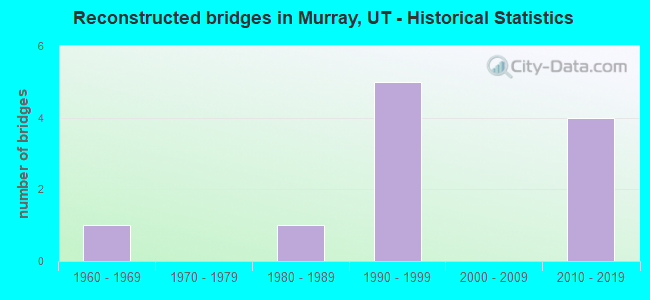
- Reconstructed bridges - Historical Statistics
- 11960-1969
- 01970-1979
- 11980-1989
- 51990-1999
- 02000-2009
- 42010-2019
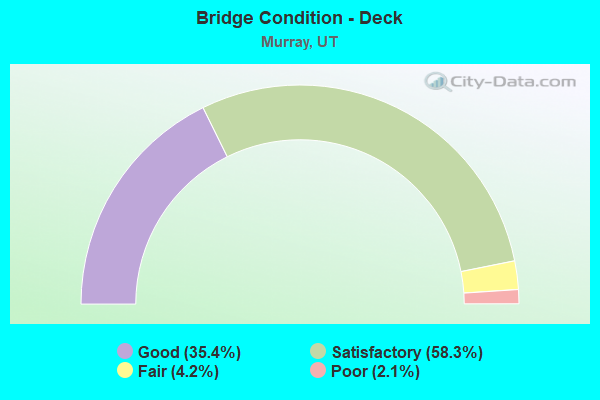
- Bridge Condition - Deck
- 35.4%Good
- 58.3%Satisfactory
- 4.2%Fair
- 2.1%Poor
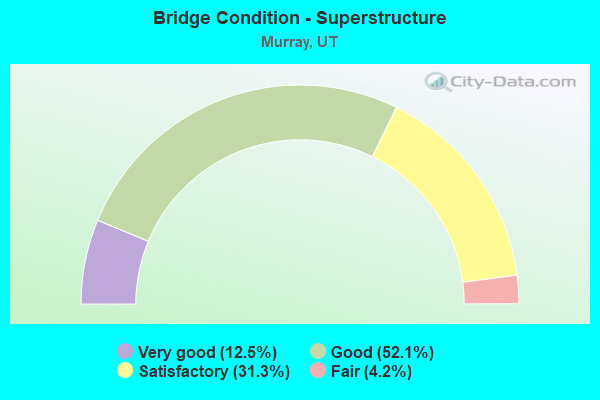
- Bridge Condition - Superstructure
- 12.5%Very good
- 52.1%Good
- 31.3%Satisfactory
- 4.2%Fair
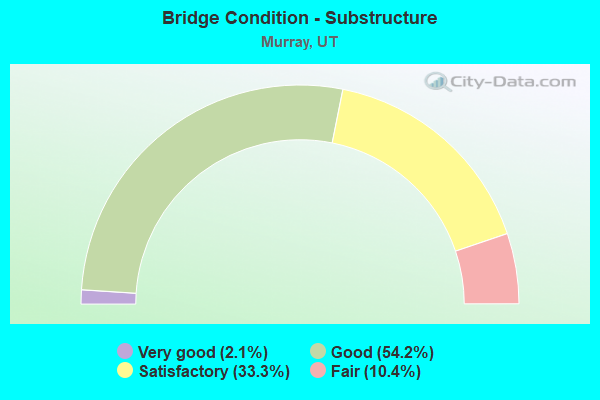
- Bridge Condition - Substructure
- 2.1%Very good
- 54.2%Good
- 33.3%Satisfactory
- 10.4%Fair
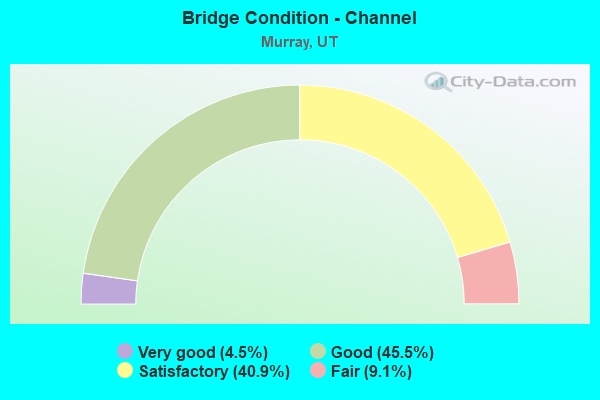
- Bridge Condition - Channel
- 4.5%Very good
- 45.5%Good
- 40.9%Satisfactory
- 9.1%Fair
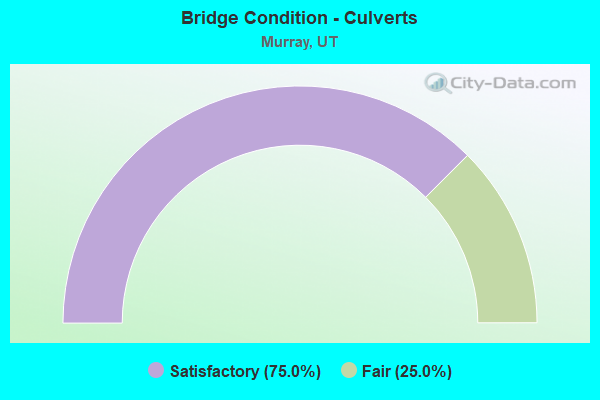
- Bridge Condition - Culverts
- 75.0%Satisfactory
- 25.0%Fair