Percentage of residents living in poverty in 2022: 29.0%
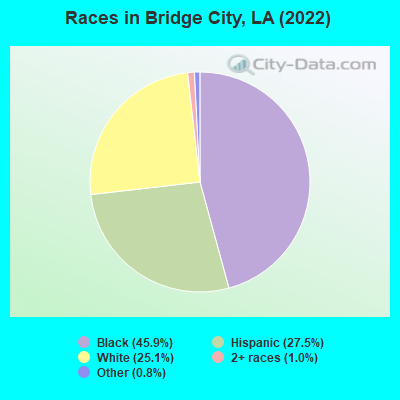
(13.1% for White Non-Hispanic residents, 30.7% for Black residents, 42.1% for Hispanic or Latino residents, 100.0% for American Indian residents, 61.0% for other race residents, 4.6% for two or more races residents)
According to our research of Louisiana and other state lists, there were 14 registered sex offenders living in Bridge City, Louisiana as of May 04, 2024. The ratio of all residents to sex offenders in Bridge City is 477 to 1. The ratio of registered sex offenders to all residents in this city is lower than the state average.
Recent articles from our blog. Our writers, many of them Ph.D. graduates or candidates, create easy-to-read articles on a wide variety of topics.
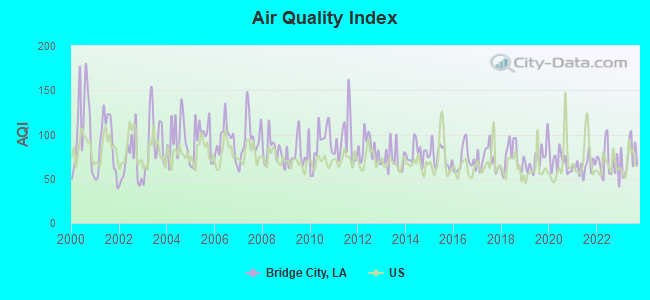
Air Quality Index (AQI) level in 2023 was 75.0. This is about average.
City:
75.0
U.S.:
72.6
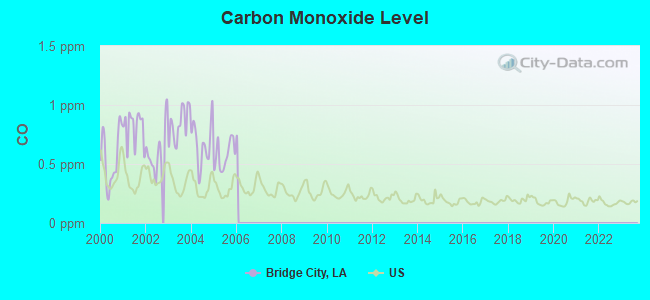
Carbon Monoxide (CO) [ppm] level in 2005 was 0.575. This is significantly worse than average.Closest monitor was 6.2 miles away from the city center.
City:
0.575
U.S.:
0.251
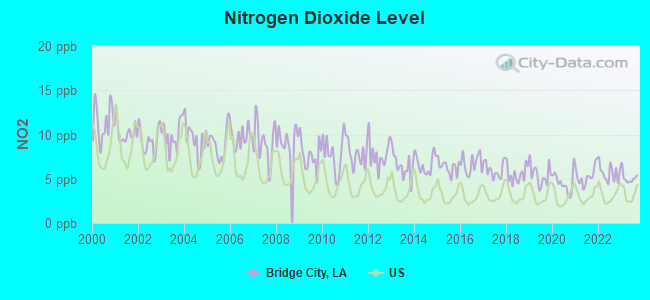
Nitrogen Dioxide (NO2) [ppb] level in 2023 was 5.12. This is about average.Closest monitor was 3.5 miles away from the city center.
City:
5.12
U.S.:
5.11
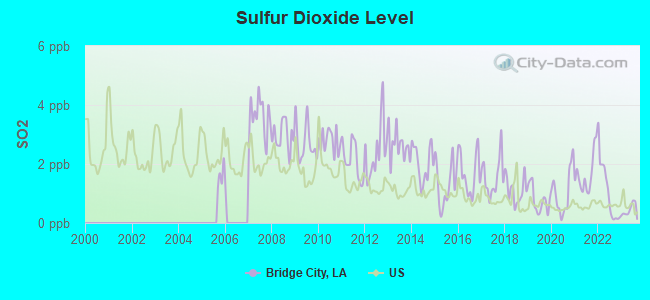
Sulfur Dioxide (SO2) [ppb] level in 2023 was 0.421. This is significantly better than average.Closest monitor was 3.5 miles away from the city center.
City:
0.421
U.S.:
1.515
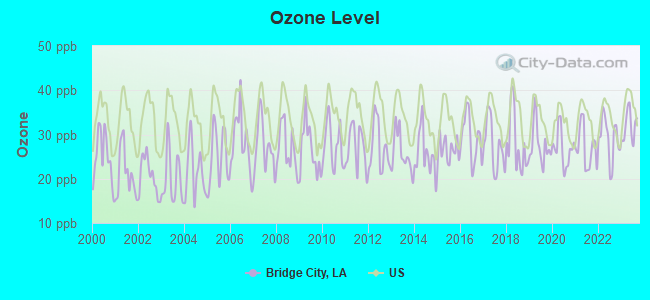
Ozone [ppb] level in 2023 was 31.9. This is about average.Closest monitor was 3.7 miles away from the city center.
City:
31.9
U.S.:
33.3
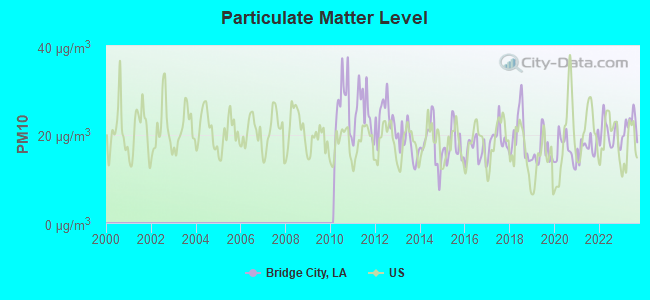
Particulate Matter (PM10) [µg/m3] level in 2023 was 22.2. This is about average.Closest monitor was 3.4 miles away from the city center.
City:
22.2
U.S.:
19.2
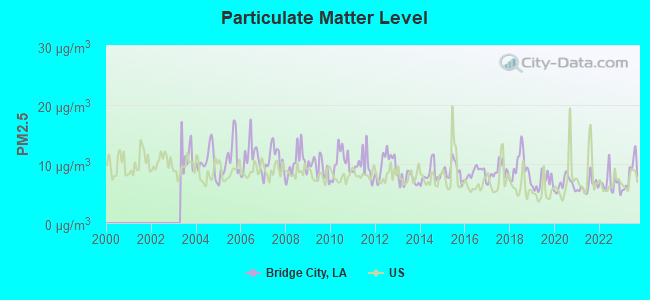
Particulate Matter (PM2.5) [µg/m3] level in 2023 was 8.17. This is about average.Closest monitor was 4.0 miles away from the city center.
City:
8.17
U.S.:
8.11
Tornado activity:
Bridge City-area historical tornado activity is slightly below Louisiana state average. It is 23% greater than the overall U.S. average.
On 12/6/1983, a category F4 (max. wind speeds 207-260 mph) tornado 18.7 miles away from the Bridge City place center injured 25 peopleand causedbetween $5,000,000 and $50,000,000 in damages.
On 10/3/1964, a category F4 tornado 25.5 miles away from the place center killed 22 peopleand injured 165 peopleand causedbetween $500,000 and $5,000,000 in damages.
Earthquake activity:
Bridge City-area historical earthquake activity is significantly above Louisiana state average. It is 56% smaller than the overall U.S. average.
On 9/10/2006 at 14:56:08, a magnitude 5.9 (5.9 MB, 5.5 MS, 5.8 MW, Class: Moderate, Intensity: VI - VII) earthquake occurred 333.3 miles away from the city center On 10/24/1997 at 08:35:17, a magnitude 4.9 (4.8 MB, 4.2 MS, 4.9 LG, Depth: 6.2 mi, Class: Light, Intensity: IV - V) earthquake occurred 191.3 miles away from Bridge City center On 5/6/2018 at 16:47:09, a magnitude 4.6 (4.6 MB, Depth: 6.2 mi) earthquake occurred 168.2 miles away from the city center On 6/30/1994 at 01:08:24, a magnitude 4.2 (4.2 MB, Depth: 6.2 mi) earthquake occurred 139.2 miles away from Bridge City center On 5/17/2012 at 08:12:00, a magnitude 4.8 (4.8 MW, Depth: 3.1 mi) earthquake occurred 285.2 miles away from Bridge City center On 1/18/1999 at 07:00:53, a magnitude 4.8 (4.8 MB, 4.0 LG, Depth: 0.6 mi) earthquake occurred 295.5 miles away from the city center Magnitude types: regional Lg-wave magnitude (LG), body-wave magnitude (MB), surface-wave magnitude (MS), moment magnitude (MW)
Natural disasters:
The number of natural disasters in Jefferson Parish (31) is a lot greater than the US average (15). Major Disasters (Presidential) Declared: 23 Emergencies Declared: 5
Causes of natural disasters: Hurricanes: 17, Floods: 6, Storms: 6, Tropical Storms: 6, Heavy Rain: 1, Tornado: 1, Other: 2 (Note: some incidents may be assigned to more than one category).
Hospitals and medical centers near Bridge City:
MAGNOLIA MAISON ST GEORGE COMM (Hospital, about 3 miles away; JEFFERSON, LA)
OMNI HOME CARE, LLC (Home Health Center, about 3 miles away; HARAHAN, LA)
MAGNOLIA DODGE AVENUE GROUP HO (Hospital, about 3 miles away; JEFFERSON, LA)
MAGNOLIA MAISON CENTRAL AVENUE (Hospital, about 3 miles away; JEFFERSON, LA)
CHILDRENS HOSPITAL-DIALYSIS (Dialysis Facility, about 3 miles away; NEW ORLEANS, LA)
CHILDRENS HOSPITAL (Hospital, about 3 miles away; NEW ORLEANS, LA)
MILLER MANOR (Hospital, about 3 miles away; NEW ORLEANS, LA)
Amtrak station near Bridge City:
6 miles: NEW ORLEANS (1001 LOYOLA AVE.) . Services: ticket office, fully wheelchair accessible, enclosed waiting area, public restrooms, public payphones, snack bar, paid short-term parking, paid long-term parking, call for car rental service, taxi stand, intercity bus service, public transit connection.
Operable nuclear power plant near Bridge City:
18 miles: Waterford 3 in Taft, LA.
Colleges/universities with over 2000 students nearest to Bridge City:
Loyola University New Orleans (about 3 miles; New Orleans, LA; Full-time enrollment: 3,912)
Tulane University of Louisiana (about 3 miles; New Orleans, LA; FT enrollment: 11,089)
Xavier University of Louisiana (about 5 miles; New Orleans, LA; FT enrollment: 2,492)
Delgado Community College (about 6 miles; New Orleans, LA; FT enrollment: 12,843)
University of New Orleans (about 10 miles; New Orleans, LA; FT enrollment: 8,201)
Nicholls State University (about 40 miles; Thibodaux, LA; FT enrollment: 5,997)
Southeastern Louisiana University (about 45 miles; Hammond, LA; FT enrollment: 12,713)
Public high schools in Bridge City:
RIVERSIDE ALTERNATIVE HIGH SCHOOL (Location: 3225 RIVER ROAD, Grades: 1-12)
RIVERSIDE ALTERNATIVE HIGH SCHOOL (Location: 3225 RIVER ROAD, Grades: KG-12)
Public elementary/middle school in Bridge City:
MILDRED S. HARRIS ELEMENTARY SCHOOL (Location: 1805 BRIDGE CITY AVENUE, Grades: PK-5)
Notable locations in Bridge City: Bridge City Wastewater Treatment Plant (A), Nine Mile Point Volunteer Fire Department (B), Bridge City Volunteer Fire Company 1 (C), Jefferson Parish Fire Training Center (D). Display/hide their locations on the map
Churches in Bridge City include: Ephesus Missionary Baptist Church (A), Bible Tabernacle Church (B), Good Shepherd Convent (C), Third Emanuel Baptist Church (D), Second Salvation Baptist Church (E), Mount Zion African Methodist Episcopal Church (F), Bridge City Baptist Church (G), Apostolic Gospel Church (H). Display/hide their locations on the map
Jefferson Parish has a predicted average indoor radon screening level less than 2 pCi/L (pico curies per liter) - Low Potential
Average household size:
This place:
2.8 people
Louisiana:
2.5 people
Percentage of family households:
This place:
70.9%
Whole state:
67.1%
Percentage of households with unmarried partners:
This place:
8.5%
Whole state:
6.8%
Likely homosexual households (counted as self-reported same-sex unmarried-partner households)
Lesbian couples: 0.4% of all households
Gay men: 0.3% of all households
127 people in correctional facilities intended for juveniles in 2010
178 people in training schools for juvenile delinquents in 2000
2 people in religious group quarters in 2000
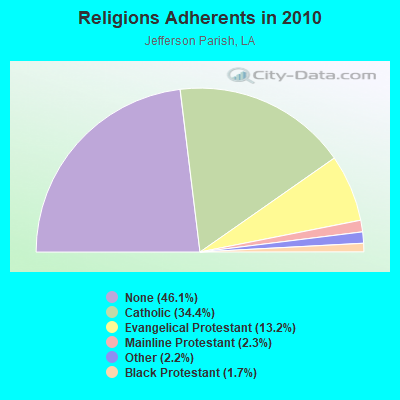
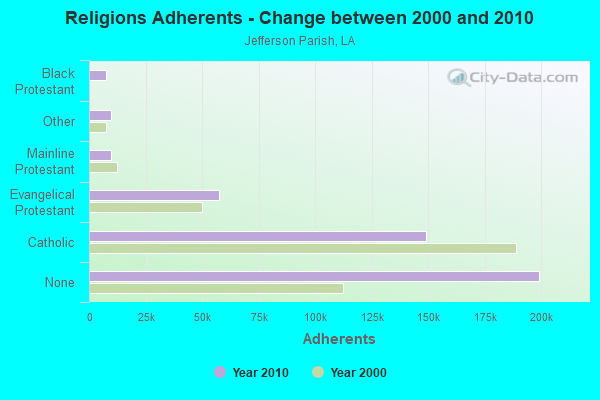
Religion statistics for Bridge City, LA (based on Jefferson Parish data)
Religion
Adherents
Congregations
Catholic
148,827
43
Evangelical Protestant
57,266
160
Mainline Protestant
9,908
30
Other
9,666
23
Black Protestant
7,394
32
Orthodox
300
1
None
199,191
-
Source: Clifford Grammich, Kirk Hadaway, Richard Houseal, Dale E.Jones, Alexei Krindatch, Richie Stanley and Richard H.Taylor. 2012. 2010 U.S.Religion Census: Religious Congregations & Membership Study. Association of Statisticians of American Religious Bodies. Jones, Dale E., et al. 2002. Congregations and Membership in the United States 2000. Nashville, TN: Glenmary Research Center. Graphs represent county-level data
Call Sign: KA5HXH, Licensee ID: L00951587, Grant Date: 12/14/2004, Expiration Date: 03/09/2015, Cancellation Date: 03/10/2017, Certifier: Jon G Carmel, Registrant: Jon G Carmel, 921 Barnes St, Bridge City, LA 70094
Call Sign: KB5SRK, Licensee ID: L00456964, Grant Date: 02/29/2012, Expiration Date: 05/26/2022, Certifier: Linda G Daussin, Registrant: Linda G Daussin, 203 10th St, Bridge City, LA 70094
Home Mortgage Disclosure Act Aggregated Statistics For Year 2009 (Based on 1 partial tract)
A) FHA, FSA/RHS & VA Home Purchase Loans
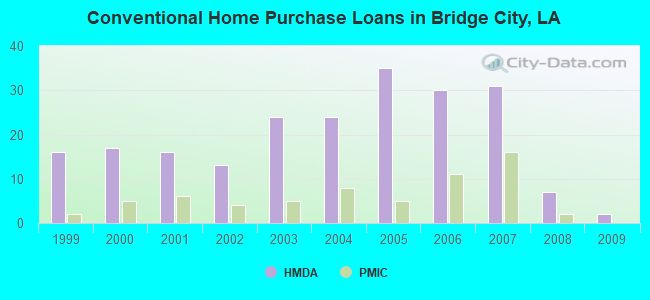
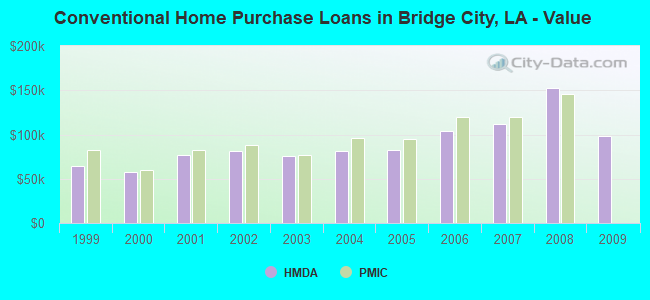
B) Conventional Home Purchase Loans
C) Refinancings
D) Home Improvement Loans
E) Loans on Dwellings For 5+ Families
F) Non-occupant Loans on < 5 Family Dwellings (A B C & D)
G) Loans On Manufactured Home Dwelling (A B C & D)
Number
Average Value
Number
Average Value
Number
Average Value
Number
Average Value
Number
Average Value
Number
Average Value
Number
Average Value
LOANS ORIGINATED
9
$113,127
2
$98,595
25
$162,431
3
$30,113
2
$85,240
4
$201,702
0
$0
APPLICATIONS APPROVED, NOT ACCEPTED
0
$0
0
$0
4
$122,358
1
$39,280
0
$0
1
$50,280
0
$0
APPLICATIONS DENIED
2
$92,310
2
$126,090
23
$114,937
9
$33,607
0
$0
3
$61,277
2
$69,135
APPLICATIONS WITHDRAWN
2
$55,385
1
$127,270
8
$127,464
2
$62,850
0
$0
0
$0
0
$0
FILES CLOSED FOR INCOMPLETENESS
0
$0
1
$79,350
3
$103,177
1
$2,360
0
$0
0
$0
0
$0
Aggregated Statistics For Year 2008 (Based on 1 partial tract)
A) FHA, FSA/RHS & VA Home Purchase Loans
B) Conventional Home Purchase Loans
C) Refinancings
D) Home Improvement Loans
E) Loans on Dwellings For 5+ Families
F) Non-occupant Loans on < 5 Family Dwellings (A B C & D)
G) Loans On Manufactured Home Dwelling (A B C & D)
Number
Average Value
Number
Average Value
Number
Average Value
Number
Average Value
Number
Average Value
Number
Average Value
Number
Average Value
LOANS ORIGINATED
7
$121,207
7
$152,294
31
$109,300
5
$33,466
2
$329,950
5
$93,330
2
$78,560
APPLICATIONS APPROVED, NOT ACCEPTED
0
$0
2
$78,560
9
$104,572
2
$32,600
0
$0
1
$47,140
0
$0
APPLICATIONS DENIED
3
$216,303
8
$101,735
24
$101,997
11
$60,563
0
$0
5
$73,060
1
$7,860
APPLICATIONS WITHDRAWN
0
$0
4
$88,182
11
$89,630
0
$0
0
$0
1
$33,780
0
$0
FILES CLOSED FOR INCOMPLETENESS
0
$0
1
$95,060
4
$106,645
0
$0
0
$0
0
$0
0
$0
Aggregated Statistics For Year 2007 (Based on 1 partial tract)
A) FHA, FSA/RHS & VA Home Purchase Loans
B) Conventional Home Purchase Loans
C) Refinancings
D) Home Improvement Loans
E) Loans on Dwellings For 5+ Families
F) Non-occupant Loans on < 5 Family Dwellings (A B C & D)
G) Loans On Manufactured Home Dwelling (A B C & D)
Number
Average Value
Number
Average Value
Number
Average Value
Number
Average Value
Number
Average Value
Number
Average Value
Number
Average Value
LOANS ORIGINATED
11
$99,985
31
$112,138
38
$117,344
9
$59,094
2
$1,164,260
6
$79,083
2
$39,280
APPLICATIONS APPROVED, NOT ACCEPTED
0
$0
6
$115,483
10
$130,174
3
$85,630
0
$0
5
$94,114
1
$108,410
APPLICATIONS DENIED
1
$92,700
9
$104,398
38
$99,916
16
$36,285
0
$0
5
$91,600
4
$58,330
APPLICATIONS WITHDRAWN
0
$0
5
$90,186
11
$123,125
4
$62,455
0
$0
2
$88,380
0
$0
FILES CLOSED FOR INCOMPLETENESS
0
$0
1
$66,780
9
$96,018
1
$70,700
0
$0
1
$98,990
0
$0
Aggregated Statistics For Year 2006 (Based on 1 partial tract)
A) FHA, FSA/RHS & VA Home Purchase Loans
B) Conventional Home Purchase Loans
C) Refinancings
D) Home Improvement Loans
E) Loans on Dwellings For 5+ Families
F) Non-occupant Loans on < 5 Family Dwellings (A B C & D)
G) Loans On Manufactured Home Dwelling (A B C & D)
Number
Average Value
Number
Average Value
Number
Average Value
Number
Average Value
Number
Average Value
Number
Average Value
Number
Average Value
LOANS ORIGINATED
13
$105,149
30
$103,437
24
$118,495
16
$50,671
0
$0
6
$65,728
0
$0
APPLICATIONS APPROVED, NOT ACCEPTED
0
$0
2
$92,310
9
$76,378
2
$37,315
1
$868,870
1
$70,700
1
$21,210
APPLICATIONS DENIED
2
$131,195
7
$136,357
21
$105,458
17
$31,239
0
$0
3
$71,490
1
$3,930
APPLICATIONS WITHDRAWN
2
$84,060
7
$99,434
18
$96,672
2
$68,740
0
$0
2
$60,490
0
$0
FILES CLOSED FOR INCOMPLETENESS
0
$0
2
$65,990
3
$109,723
0
$0
0
$0
0
$0
0
$0
Aggregated Statistics For Year 2005 (Based on 1 partial tract)
A) FHA, FSA/RHS & VA Home Purchase Loans
B) Conventional Home Purchase Loans
C) Refinancings
D) Home Improvement Loans
F) Non-occupant Loans on < 5 Family Dwellings (A B C & D)
G) Loans On Manufactured Home Dwelling (A B C & D)
Number
Average Value
Number
Average Value
Number
Average Value
Number
Average Value
Number
Average Value
Number
Average Value
LOANS ORIGINATED
13
$88,592
35
$81,949
45
$82,715
9
$47,398
12
$64,616
0
$0
APPLICATIONS APPROVED, NOT ACCEPTED
0
$0
10
$111,477
12
$89,755
4
$28,675
2
$41,245
0
$0
APPLICATIONS DENIED
1
$40,850
10
$65,990
42
$78,766
22
$30,139
6
$80,523
2
$54,205
APPLICATIONS WITHDRAWN
1
$77,770
8
$59,312
24
$125,958
6
$68,347
2
$39,675
0
$0
FILES CLOSED FOR INCOMPLETENESS
0
$0
1
$62,850
20
$78,403
0
$0
0
$0
0
$0
Aggregated Statistics For Year 2004 (Based on 1 partial tract)
A) FHA, FSA/RHS & VA Home Purchase Loans
B) Conventional Home Purchase Loans
C) Refinancings
D) Home Improvement Loans
F) Non-occupant Loans on < 5 Family Dwellings (A B C & D)
G) Loans On Manufactured Home Dwelling (A B C & D)
Number
Average Value
Number
Average Value
Number
Average Value
Number
Average Value
Number
Average Value
Number
Average Value
LOANS ORIGINATED
9
$74,458
24
$81,113
65
$72,360
11
$34,138
8
$53,225
0
$0
APPLICATIONS APPROVED, NOT ACCEPTED
0
$0
6
$113,388
15
$76,308
2
$13,355
0
$0
0
$0
APPLICATIONS DENIED
1
$26,710
13
$72,819
40
$83,431
18
$32,209
2
$29,855
3
$54,207
APPLICATIONS WITHDRAWN
0
$0
5
$107,156
23
$70,875
1
$62,850
1
$89,560
0
$0
FILES CLOSED FOR INCOMPLETENESS
0
$0
5
$56,406
24
$77,643
1
$16,500
1
$47,140
1
$63,630
Aggregated Statistics For Year 2003 (Based on 1 partial tract)
A) FHA, FSA/RHS & VA Home Purchase Loans
B) Conventional Home Purchase Loans
C) Refinancings
D) Home Improvement Loans
E) Loans on Dwellings For 5+ Families
F) Non-occupant Loans on < 5 Family Dwellings (A B C & D)
Number
Average Value
Number
Average Value
Number
Average Value
Number
Average Value
Number
Average Value
Number
Average Value
LOANS ORIGINATED
16
$76,792
24
$75,221
94
$86,876
9
$12,831
1
$131,980
13
$70,462
APPLICATIONS APPROVED, NOT ACCEPTED
1
$63,630
4
$120,785
12
$61,866
4
$18,658
0
$0
5
$55,306
APPLICATIONS DENIED
2
$42,815
9
$63,110
57
$73,612
13
$17,767
0
$0
4
$60,490
APPLICATIONS WITHDRAWN
1
$51,060
3
$84,060
27
$75,941
0
$0
0
$0
0
$0
FILES CLOSED FOR INCOMPLETENESS
0
$0
1
$62,850
2
$124,520
0
$0
0
$0
0
$0
Aggregated Statistics For Year 2002 (Based on 1 partial tract)
A) FHA, FSA/RHS & VA Home Purchase Loans
B) Conventional Home Purchase Loans
C) Refinancings
D) Home Improvement Loans
E) Loans on Dwellings For 5+ Families
F) Non-occupant Loans on < 5 Family Dwellings (A B C & D)
Number
Average Value
Number
Average Value
Number
Average Value
Number
Average Value
Number
Average Value
Number
Average Value
LOANS ORIGINATED
13
$66,655
13
$81,763
62
$74,594
13
$33,599
2
$166,940
14
$80,244
APPLICATIONS APPROVED, NOT ACCEPTED
1
$104,480
1
$19,640
24
$66,514
5
$30,638
0
$0
2
$59,705
APPLICATIONS DENIED
1
$65,990
9
$54,904
44
$75,810
14
$16,441
0
$0
4
$212,112
APPLICATIONS WITHDRAWN
2
$53,030
2
$77,775
12
$69,329
4
$30,442
0
$0
0
$0
FILES CLOSED FOR INCOMPLETENESS
1
$54,990
0
$0
9
$66,164
1
$39,280
0
$0
2
$50,280
Aggregated Statistics For Year 2001 (Based on 1 partial tract)
A) FHA, FSA/RHS & VA Home Purchase Loans
B) Conventional Home Purchase Loans
C) Refinancings
D) Home Improvement Loans
E) Loans on Dwellings For 5+ Families
F) Non-occupant Loans on < 5 Family Dwellings (A B C & D)
Number
Average Value
Number
Average Value
Number
Average Value
Number
Average Value
Number
Average Value
Number
Average Value
LOANS ORIGINATED
14
$79,514
16
$77,382
43
$65,132
10
$21,683
0
$0
10
$60,884
APPLICATIONS APPROVED, NOT ACCEPTED
0
$0
7
$52,411
13
$62,606
2
$53,030
0
$0
3
$26,973
APPLICATIONS DENIED
1
$36,920
9
$38,582
45
$52,408
13
$15,349
1
$1,414,080
6
$36,138
APPLICATIONS WITHDRAWN
0
$0
5
$77,304
24
$53,290
2
$12,175
0
$0
0
$0
FILES CLOSED FOR INCOMPLETENESS
0
$0
1
$11,780
3
$46,350
0
$0
0
$0
0
$0
Aggregated Statistics For Year 2000 (Based on 1 partial tract)
A) FHA, FSA/RHS & VA Home Purchase Loans
B) Conventional Home Purchase Loans
C) Refinancings
D) Home Improvement Loans
E) Loans on Dwellings For 5+ Families
F) Non-occupant Loans on < 5 Family Dwellings (A B C & D)
Number
Average Value
Number
Average Value
Number
Average Value
Number
Average Value
Number
Average Value
Number
Average Value
LOANS ORIGINATED
16
$58,772
17
$57,765
28
$47,781
12
$20,491
2
$97,415
11
$42,351
APPLICATIONS APPROVED, NOT ACCEPTED
2
$42,815
5
$52,478
9
$58,309
5
$17,598
0
$0
2
$34,565
APPLICATIONS DENIED
1
$58,920
13
$32,331
46
$44,591
5
$13,198
0
$0
4
$29,852
APPLICATIONS WITHDRAWN
1
$40,850
2
$60,885
24
$45,565
2
$29,460
0
$0
2
$62,455
FILES CLOSED FOR INCOMPLETENESS
0
$0
2
$62,850
11
$53,064
0
$0
0
$0
0
$0
Aggregated Statistics For Year 1999 (Based on 1 partial tract)
A) FHA, FSA/RHS & VA Home Purchase Loans
B) Conventional Home Purchase Loans
C) Refinancings
D) Home Improvement Loans
E) Loans on Dwellings For 5+ Families
F) Non-occupant Loans on < 5 Family Dwellings (A B C & D)
Detailed PMIC statistics for the following Tracts:0274.00
2002 - 2018 National Fire Incident Reporting System (NFIRS) incidents
Based on the data from the years 2002 - 2018 the average number of fires per year is 17. The highest number of reported fire incidents - 31 took place in 2009, and the least - 2 in 2006. The data has an increasing trend.
When looking into fire subcategories, the most incidents belonged to: Structure Fires (51.8%), and Outside Fires (26.8%).
Fire incident types reported to NFIRS in Bridge City, LA
#30 on the list of "Top 101 cities with the largest percentage of people in training schools for juvenile delinquents (population 1,000+)"
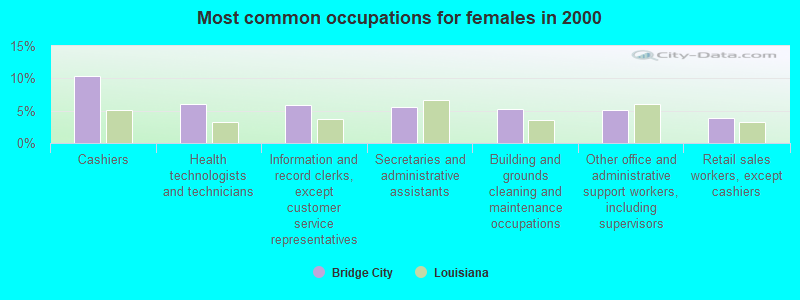
#33 on the list of "Top 101 cities with largest percentage of females in occupations: sales and related occupations (population 5,000+)"
#34 on the list of "Top 101 cities with the most people below 50% of the poverty level, excluding cities with 15% or more of residents in college and with the median age below 28 (population 5,000+)"
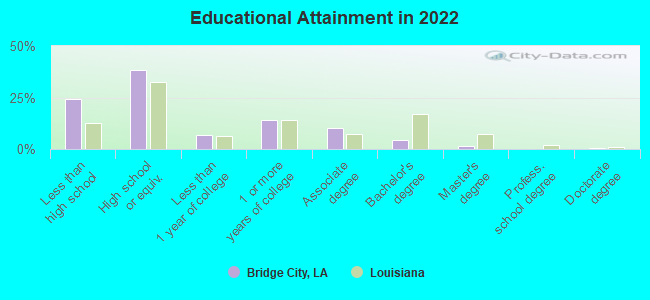
#36 on the list of "Top 101 cities with the least people having Master's or Doctorate degrees (population 5,000+)"
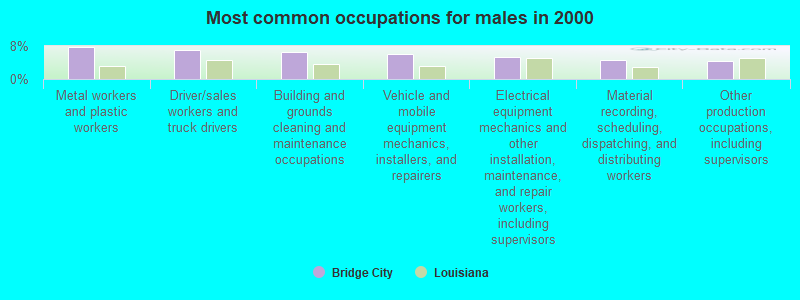
#45 on the list of "Top 101 cities with largest percentage of males in industries: management of companies and enterprises (population 5,000+)"
#70 on the list of "Top 101 cities with the most residents born in Other Caribbean (population 500+)"
#76 on the list of "Top 101 cities with largest percentage of females in industries: retail trade (population 5,000+)"
#95 on the list of "Top 101 cities with the most residents born in Dominican Republic (population 500+)"
#78 (70094) on the list of "Top 101 zip codes with the largest percentage of French first ancestries"
#46 on the list of "Top 101 counties with the lowest percentage of residents that drank alcohol in the past 30 days"
#49 on the list of "Top 101 counties with the largest decrease in the number of infant deaths per 1000 residents 2000-2006 to 2007-2013 (pop. 50,000+)"
#50 on the list of "Top 101 counties with the largest increase in the number of births per 1000 residents 2000-2006 to 2007-2013 (pop 50,000+)"
#64 on the list of "Top 101 counties with the highest number of infant deaths per 1000 residents 2007-2013 (pop. 50,000+)"
#68 on the list of "Top 101 counties with the highest surface withdrawal of fresh water for public supply (pop. 50,000+)"


 Recent articles from our blog. Our writers, many of them Ph.D. graduates or candidates, create easy-to-read articles on a wide variety of topics.

 (5.2 miles

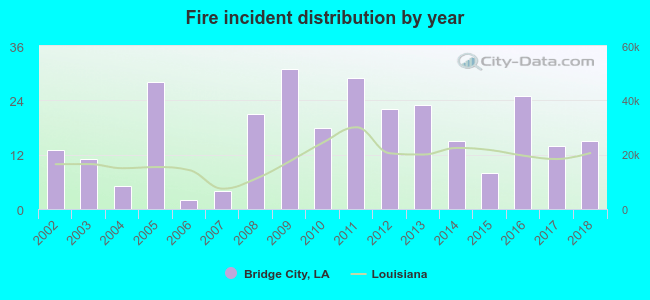 Based on the data from the years 2002 - 2018 the average number of fires per year is 17. The highest number of reported fire incidents - 31 took place in 2009, and the least - 2 in 2006. The data has an increasing trend.
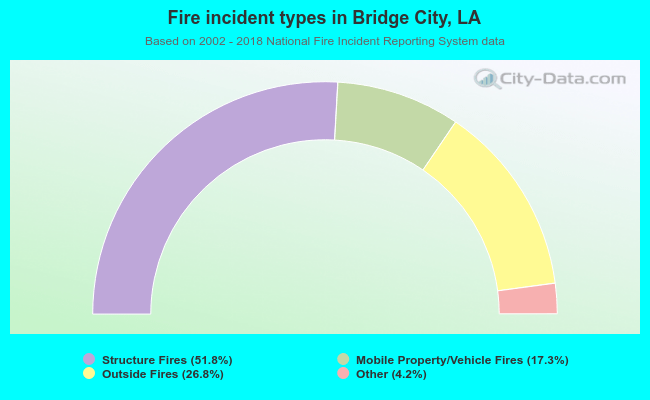 When looking into fire subcategories, the most incidents belonged to: Structure Fires (51.8%), and Outside Fires (26.8%).