Fort Mitchell, Kentucky Submit your own pictures of this city and show them to the world
OSM Map
General Map
Google Map
MSN Map
OSM Map
General Map
Google Map
MSN Map
OSM Map
General Map
Google Map
MSN Map
OSM Map
General Map
Google Map
MSN Map
Please wait while loading the map...
Population in 2022: 8,653 (100% urban, 0% rural). Population change since 2000: +7.0%Males: 4,378 Females: 4,275
March 2022 cost of living index in Fort Mitchell: 89.0 (less than average, U.S. average is 100) Percentage of residents living in poverty in 2022: 8.1%for White Non-Hispanic residents , 5.9% for Hispanic or Latino residents , 9.9% for other race residents , 16.6% for two or more races residents )
Profiles of local businesses
Business Search - 14 Million verified businesses
Data:
Median household income ($)
Median household income (% change since 2000)
Household income diversity
Ratio of average income to average house value (%)
Ratio of average income to average rent
Median household income ($) - White
Median household income ($) - Black or African American
Median household income ($) - Asian
Median household income ($) - Hispanic or Latino
Median household income ($) - American Indian and Alaska Native
Median household income ($) - Multirace
Median household income ($) - Other Race
Median household income for houses/condos with a mortgage ($)
Median household income for apartments without a mortgage ($)
Races - White alone (%)
Races - White alone (% change since 2000)
Races - Black alone (%)
Races - Black alone (% change since 2000)
Races - American Indian alone (%)
Races - American Indian alone (% change since 2000)
Races - Asian alone (%)
Races - Asian alone (% change since 2000)
Races - Hispanic (%)
Races - Hispanic (% change since 2000)
Races - Native Hawaiian and Other Pacific Islander alone (%)
Races - Native Hawaiian and Other Pacific Islander alone (% change since 2000)
Races - Two or more races (%)
Races - Two or more races (% change since 2000)
Races - Other race alone (%)
Races - Other race alone (% change since 2000)
Racial diversity
Unemployment (%)
Unemployment (% change since 2000)
Unemployment (%) - White
Unemployment (%) - Black or African American
Unemployment (%) - Asian
Unemployment (%) - Hispanic or Latino
Unemployment (%) - American Indian and Alaska Native
Unemployment (%) - Multirace
Unemployment (%) - Other Race
Population density (people per square mile)
Population - Males (%)
Population - Females (%)
Population - Males (%) - White
Population - Males (%) - Black or African American
Population - Males (%) - Asian
Population - Males (%) - Hispanic or Latino
Population - Males (%) - American Indian and Alaska Native
Population - Males (%) - Multirace
Population - Males (%) - Other Race
Population - Females (%) - White
Population - Females (%) - Black or African American
Population - Females (%) - Asian
Population - Females (%) - Hispanic or Latino
Population - Females (%) - American Indian and Alaska Native
Population - Females (%) - Multirace
Population - Females (%) - Other Race
Coronavirus confirmed cases (May 05, 2024)
Deaths caused by coronavirus (May 05, 2024)
Coronavirus confirmed cases (per 100k population) (May 05, 2024)
Deaths caused by coronavirus (per 100k population) (May 05, 2024)
Daily increase in number of cases (May 05, 2024)
Weekly increase in number of cases (May 05, 2024)
Cases doubled (in days) (May 05, 2024)
Hospitalized patients (Apr 18, 2022)
Negative test results (Apr 18, 2022)
Total test results (Apr 18, 2022)
COVID Vaccine doses distributed (per 100k population) (Sep 19, 2023)
COVID Vaccine doses administered (per 100k population) (Sep 19, 2023)
COVID Vaccine doses distributed (Sep 19, 2023)
COVID Vaccine doses administered (Sep 19, 2023)
Likely homosexual households (%)
Likely homosexual households (% change since 2000)
Likely homosexual households - Lesbian couples (%)
Likely homosexual households - Lesbian couples (% change since 2000)
Likely homosexual households - Gay men (%)
Likely homosexual households - Gay men (% change since 2000)
Cost of living index
Median gross rent ($)
Median contract rent ($)
Median monthly housing costs ($)
Median house or condo value ($)
Median house or condo value ($ change since 2000)
Mean house or condo value by units in structure - 1, detached ($)
Mean house or condo value by units in structure - 1, attached ($)
Mean house or condo value by units in structure - 2 ($)
Mean house or condo value by units in structure by units in structure - 3 or 4 ($)
Mean house or condo value by units in structure - 5 or more ($)
Mean house or condo value by units in structure - Boat, RV, van, etc. ($)
Mean house or condo value by units in structure - Mobile home ($)
Median house or condo value ($) - White
Median house or condo value ($) - Black or African American
Median house or condo value ($) - Asian
Median house or condo value ($) - Hispanic or Latino
Median house or condo value ($) - American Indian and Alaska Native
Median house or condo value ($) - Multirace
Median house or condo value ($) - Other Race
Median resident age
Resident age diversity
Median resident age - Males
Median resident age - Females
Median resident age - White
Median resident age - Black or African American
Median resident age - Asian
Median resident age - Hispanic or Latino
Median resident age - American Indian and Alaska Native
Median resident age - Multirace
Median resident age - Other Race
Median resident age - Males - White
Median resident age - Males - Black or African American
Median resident age - Males - Asian
Median resident age - Males - Hispanic or Latino
Median resident age - Males - American Indian and Alaska Native
Median resident age - Males - Multirace
Median resident age - Males - Other Race
Median resident age - Females - White
Median resident age - Females - Black or African American
Median resident age - Females - Asian
Median resident age - Females - Hispanic or Latino
Median resident age - Females - American Indian and Alaska Native
Median resident age - Females - Multirace
Median resident age - Females - Other Race
Commute - mean travel time to work (minutes)
Travel time to work - Less than 5 minutes (%)
Travel time to work - Less than 5 minutes (% change since 2000)
Travel time to work - 5 to 9 minutes (%)
Travel time to work - 5 to 9 minutes (% change since 2000)
Travel time to work - 10 to 19 minutes (%)
Travel time to work - 10 to 19 minutes (% change since 2000)
Travel time to work - 20 to 29 minutes (%)
Travel time to work - 20 to 29 minutes (% change since 2000)
Travel time to work - 30 to 39 minutes (%)
Travel time to work - 30 to 39 minutes (% change since 2000)
Travel time to work - 40 to 59 minutes (%)
Travel time to work - 40 to 59 minutes (% change since 2000)
Travel time to work - 60 to 89 minutes (%)
Travel time to work - 60 to 89 minutes (% change since 2000)
Travel time to work - 90 or more minutes (%)
Travel time to work - 90 or more minutes (% change since 2000)
Marital status - Never married (%)
Marital status - Now married (%)
Marital status - Separated (%)
Marital status - Widowed (%)
Marital status - Divorced (%)
Median family income ($)
Median family income (% change since 2000)
Median non-family income ($)
Median non-family income (% change since 2000)
Median per capita income ($)
Median per capita income (% change since 2000)
Median family income ($) - White
Median family income ($) - Black or African American
Median family income ($) - Asian
Median family income ($) - Hispanic or Latino
Median family income ($) - American Indian and Alaska Native
Median family income ($) - Multirace
Median family income ($) - Other Race
Median year house/condo built
Median year apartment built
Year house built - Built 2005 or later (%)
Year house built - Built 2000 to 2004 (%)
Year house built - Built 1990 to 1999 (%)
Year house built - Built 1980 to 1989 (%)
Year house built - Built 1970 to 1979 (%)
Year house built - Built 1960 to 1969 (%)
Year house built - Built 1950 to 1959 (%)
Year house built - Built 1940 to 1949 (%)
Year house built - Built 1939 or earlier (%)
Average household size
Household density (households per square mile)
Average household size - White
Average household size - Black or African American
Average household size - Asian
Average household size - Hispanic or Latino
Average household size - American Indian and Alaska Native
Average household size - Multirace
Average household size - Other Race
Occupied housing units (%)
Vacant housing units (%)
Owner occupied housing units (%)
Renter occupied housing units (%)
Vacancy status - For rent (%)
Vacancy status - For sale only (%)
Vacancy status - Rented or sold, not occupied (%)
Vacancy status - For seasonal, recreational, or occasional use (%)
Vacancy status - For migrant workers (%)
Vacancy status - Other vacant (%)
Residents with income below the poverty level (%)
Residents with income below 50% of the poverty level (%)
Children below poverty level (%)
Poor families by family type - Married-couple family (%)
Poor families by family type - Male, no wife present (%)
Poor families by family type - Female, no husband present (%)
Poverty status for native-born residents (%)
Poverty status for foreign-born residents (%)
Poverty among high school graduates not in families (%)
Poverty among people who did not graduate high school not in families (%)
Residents with income below the poverty level (%) - White
Residents with income below the poverty level (%) - Black or African American
Residents with income below the poverty level (%) - Asian
Residents with income below the poverty level (%) - Hispanic or Latino
Residents with income below the poverty level (%) - American Indian and Alaska Native
Residents with income below the poverty level (%) - Multirace
Residents with income below the poverty level (%) - Other Race
Air pollution - Air Quality Index (AQI)
Air pollution - CO
Air pollution - NO2
Air pollution - SO2
Air pollution - Ozone
Air pollution - PM10
Air pollution - PM25
Air pollution - Pb
Crime - Murders per 100,000 population
Crime - Rapes per 100,000 population
Crime - Robberies per 100,000 population
Crime - Assaults per 100,000 population
Crime - Burglaries per 100,000 population
Crime - Thefts per 100,000 population
Crime - Auto thefts per 100,000 population
Crime - Arson per 100,000 population
Crime - City-data.com crime index
Crime - Violent crime index
Crime - Property crime index
Crime - Murders per 100,000 population (5 year average)
Crime - Rapes per 100,000 population (5 year average)
Crime - Robberies per 100,000 population (5 year average)
Crime - Assaults per 100,000 population (5 year average)
Crime - Burglaries per 100,000 population (5 year average)
Crime - Thefts per 100,000 population (5 year average)
Crime - Auto thefts per 100,000 population (5 year average)
Crime - Arson per 100,000 population (5 year average)
Crime - City-data.com crime index (5 year average)
Crime - Violent crime index (5 year average)
Crime - Property crime index (5 year average)
1996 Presidential Elections Results (%) - Democratic Party (Clinton)
1996 Presidential Elections Results (%) - Republican Party (Dole)
1996 Presidential Elections Results (%) - Other
2000 Presidential Elections Results (%) - Democratic Party (Gore)
2000 Presidential Elections Results (%) - Republican Party (Bush)
2000 Presidential Elections Results (%) - Other
2004 Presidential Elections Results (%) - Democratic Party (Kerry)
2004 Presidential Elections Results (%) - Republican Party (Bush)
2004 Presidential Elections Results (%) - Other
2008 Presidential Elections Results (%) - Democratic Party (Obama)
2008 Presidential Elections Results (%) - Republican Party (McCain)
2008 Presidential Elections Results (%) - Other
2012 Presidential Elections Results (%) - Democratic Party (Obama)
2012 Presidential Elections Results (%) - Republican Party (Romney)
2012 Presidential Elections Results (%) - Other
2016 Presidential Elections Results (%) - Democratic Party (Clinton)
2016 Presidential Elections Results (%) - Republican Party (Trump)
2016 Presidential Elections Results (%) - Other
2020 Presidential Elections Results (%) - Democratic Party (Biden)
2020 Presidential Elections Results (%) - Republican Party (Trump)
2020 Presidential Elections Results (%) - Other
Ancestries Reported - Arab (%)
Ancestries Reported - Czech (%)
Ancestries Reported - Danish (%)
Ancestries Reported - Dutch (%)
Ancestries Reported - English (%)
Ancestries Reported - French (%)
Ancestries Reported - French Canadian (%)
Ancestries Reported - German (%)
Ancestries Reported - Greek (%)
Ancestries Reported - Hungarian (%)
Ancestries Reported - Irish (%)
Ancestries Reported - Italian (%)
Ancestries Reported - Lithuanian (%)
Ancestries Reported - Norwegian (%)
Ancestries Reported - Polish (%)
Ancestries Reported - Portuguese (%)
Ancestries Reported - Russian (%)
Ancestries Reported - Scotch-Irish (%)
Ancestries Reported - Scottish (%)
Ancestries Reported - Slovak (%)
Ancestries Reported - Subsaharan African (%)
Ancestries Reported - Swedish (%)
Ancestries Reported - Swiss (%)
Ancestries Reported - Ukrainian (%)
Ancestries Reported - United States (%)
Ancestries Reported - Welsh (%)
Ancestries Reported - West Indian (%)
Ancestries Reported - Other (%)
Educational Attainment - No schooling completed (%)
Educational Attainment - Less than high school (%)
Educational Attainment - High school or equivalent (%)
Educational Attainment - Less than 1 year of college (%)
Educational Attainment - 1 or more years of college (%)
Educational Attainment - Associate degree (%)
Educational Attainment - Bachelor's degree (%)
Educational Attainment - Master's degree (%)
Educational Attainment - Professional school degree (%)
Educational Attainment - Doctorate degree (%)
School Enrollment - Nursery, preschool (%)
School Enrollment - Kindergarten (%)
School Enrollment - Grade 1 to 4 (%)
School Enrollment - Grade 5 to 8 (%)
School Enrollment - Grade 9 to 12 (%)
School Enrollment - College undergrad (%)
School Enrollment - Graduate or professional (%)
School Enrollment - Not enrolled in school (%)
School enrollment - Public schools (%)
School enrollment - Private schools (%)
School enrollment - Not enrolled (%)
Median number of rooms in houses and condos
Median number of rooms in apartments
Housing units lacking complete plumbing facilities (%)
Housing units lacking complete kitchen facilities (%)
Density of houses
Urban houses (%)
Rural houses (%)
Households with people 60 years and over (%)
Households with people 65 years and over (%)
Households with people 75 years and over (%)
Households with one or more nonrelatives (%)
Households with no nonrelatives (%)
Population in households (%)
Family households (%)
Nonfamily households (%)
Population in families (%)
Family households with own children (%)
Median number of bedrooms in owner occupied houses
Mean number of bedrooms in owner occupied houses
Median number of bedrooms in renter occupied houses
Mean number of bedrooms in renter occupied houses
Median number of vehichles in owner occupied houses
Mean number of vehichles in owner occupied houses
Median number of vehichles in renter occupied houses
Mean number of vehichles in renter occupied houses
Mortgage status - with mortgage (%)
Mortgage status - with second mortgage (%)
Mortgage status - with home equity loan (%)
Mortgage status - with both second mortgage and home equity loan (%)
Mortgage status - without a mortgage (%)
Average family size
Average family size - White
Average family size - Black or African American
Average family size - Asian
Average family size - Hispanic or Latino
Average family size - American Indian and Alaska Native
Average family size - Multirace
Average family size - Other Race
Geographical mobility - Same house 1 year ago (%)
Geographical mobility - Moved within same county (%)
Geographical mobility - Moved from different county within same state (%)
Geographical mobility - Moved from different state (%)
Geographical mobility - Moved from abroad (%)
Place of birth - Born in state of residence (%)
Place of birth - Born in other state (%)
Place of birth - Native, outside of US (%)
Place of birth - Foreign born (%)
Housing units in structures - 1, detached (%)
Housing units in structures - 1, attached (%)
Housing units in structures - 2 (%)
Housing units in structures - 3 or 4 (%)
Housing units in structures - 5 to 9 (%)
Housing units in structures - 10 to 19 (%)
Housing units in structures - 20 to 49 (%)
Housing units in structures - 50 or more (%)
Housing units in structures - Mobile home (%)
Housing units in structures - Boat, RV, van, etc. (%)
House/condo owner moved in on average (years ago)
Renter moved in on average (years ago)
Year householder moved into unit - Moved in 1999 to March 2000 (%)
Year householder moved into unit - Moved in 1995 to 1998 (%)
Year householder moved into unit - Moved in 1990 to 1994 (%)
Year householder moved into unit - Moved in 1980 to 1989 (%)
Year householder moved into unit - Moved in 1970 to 1979 (%)
Year householder moved into unit - Moved in 1969 or earlier (%)
Means of transportation to work - Drove car alone (%)
Means of transportation to work - Carpooled (%)
Means of transportation to work - Public transportation (%)
Means of transportation to work - Bus or trolley bus (%)
Means of transportation to work - Streetcar or trolley car (%)
Means of transportation to work - Subway or elevated (%)
Means of transportation to work - Railroad (%)
Means of transportation to work - Ferryboat (%)
Means of transportation to work - Taxicab (%)
Means of transportation to work - Motorcycle (%)
Means of transportation to work - Bicycle (%)
Means of transportation to work - Walked (%)
Means of transportation to work - Other means (%)
Working at home (%)
Industry diversity
Most Common Industries - Agriculture, forestry, fishing and hunting, and mining (%)
Most Common Industries - Agriculture, forestry, fishing and hunting (%)
Most Common Industries - Mining, quarrying, and oil and gas extraction (%)
Most Common Industries - Construction (%)
Most Common Industries - Manufacturing (%)
Most Common Industries - Wholesale trade (%)
Most Common Industries - Retail trade (%)
Most Common Industries - Transportation and warehousing, and utilities (%)
Most Common Industries - Transportation and warehousing (%)
Most Common Industries - Utilities (%)
Most Common Industries - Information (%)
Most Common Industries - Finance and insurance, and real estate and rental and leasing (%)
Most Common Industries - Finance and insurance (%)
Most Common Industries - Real estate and rental and leasing (%)
Most Common Industries - Professional, scientific, and management, and administrative and waste management services (%)
Most Common Industries - Professional, scientific, and technical services (%)
Most Common Industries - Management of companies and enterprises (%)
Most Common Industries - Administrative and support and waste management services (%)
Most Common Industries - Educational services, and health care and social assistance (%)
Most Common Industries - Educational services (%)
Most Common Industries - Health care and social assistance (%)
Most Common Industries - Arts, entertainment, and recreation, and accommodation and food services (%)
Most Common Industries - Arts, entertainment, and recreation (%)
Most Common Industries - Accommodation and food services (%)
Most Common Industries - Other services, except public administration (%)
Most Common Industries - Public administration (%)
Occupation diversity
Most Common Occupations - Management, business, science, and arts occupations (%)
Most Common Occupations - Management, business, and financial occupations (%)
Most Common Occupations - Management occupations (%)
Most Common Occupations - Business and financial operations occupations (%)
Most Common Occupations - Computer, engineering, and science occupations (%)
Most Common Occupations - Computer and mathematical occupations (%)
Most Common Occupations - Architecture and engineering occupations (%)
Most Common Occupations - Life, physical, and social science occupations (%)
Most Common Occupations - Education, legal, community service, arts, and media occupations (%)
Most Common Occupations - Community and social service occupations (%)
Most Common Occupations - Legal occupations (%)
Most Common Occupations - Education, training, and library occupations (%)
Most Common Occupations - Arts, design, entertainment, sports, and media occupations (%)
Most Common Occupations - Healthcare practitioners and technical occupations (%)
Most Common Occupations - Health diagnosing and treating practitioners and other technical occupations (%)
Most Common Occupations - Health technologists and technicians (%)
Most Common Occupations - Service occupations (%)
Most Common Occupations - Healthcare support occupations (%)
Most Common Occupations - Protective service occupations (%)
Most Common Occupations - Fire fighting and prevention, and other protective service workers including supervisors (%)
Most Common Occupations - Law enforcement workers including supervisors (%)
Most Common Occupations - Food preparation and serving related occupations (%)
Most Common Occupations - Building and grounds cleaning and maintenance occupations (%)
Most Common Occupations - Personal care and service occupations (%)
Most Common Occupations - Sales and office occupations (%)
Most Common Occupations - Sales and related occupations (%)
Most Common Occupations - Office and administrative support occupations (%)
Most Common Occupations - Natural resources, construction, and maintenance occupations (%)
Most Common Occupations - Farming, fishing, and forestry occupations (%)
Most Common Occupations - Construction and extraction occupations (%)
Most Common Occupations - Installation, maintenance, and repair occupations (%)
Most Common Occupations - Production, transportation, and material moving occupations (%)
Most Common Occupations - Production occupations (%)
Most Common Occupations - Transportation occupations (%)
Most Common Occupations - Material moving occupations (%)
People in Group quarters - Institutionalized population (%)
People in Group quarters - Correctional institutions (%)
People in Group quarters - Federal prisons and detention centers (%)
People in Group quarters - Halfway houses (%)
People in Group quarters - Local jails and other confinement facilities (including police lockups) (%)
People in Group quarters - Military disciplinary barracks (%)
People in Group quarters - State prisons (%)
People in Group quarters - Other types of correctional institutions (%)
People in Group quarters - Nursing homes (%)
People in Group quarters - Hospitals/wards, hospices, and schools for the handicapped (%)
People in Group quarters - Hospitals/wards and hospices for chronically ill (%)
People in Group quarters - Hospices or homes for chronically ill (%)
People in Group quarters - Military hospitals or wards for chronically ill (%)
People in Group quarters - Other hospitals or wards for chronically ill (%)
People in Group quarters - Hospitals or wards for drug/alcohol abuse (%)
People in Group quarters - Mental (Psychiatric) hospitals or wards (%)
People in Group quarters - Schools, hospitals, or wards for the mentally retarded (%)
People in Group quarters - Schools, hospitals, or wards for the physically handicapped (%)
People in Group quarters - Institutions for the deaf (%)
People in Group quarters - Institutions for the blind (%)
People in Group quarters - Orthopedic wards and institutions for the physically handicapped (%)
People in Group quarters - Wards in general hospitals for patients who have no usual home elsewhere (%)
People in Group quarters - Wards in military hospitals for patients who have no usual home elsewhere (%)
People in Group quarters - Juvenile institutions (%)
People in Group quarters - Long-term care (%)
People in Group quarters - Homes for abused, dependent, and neglected children (%)
People in Group quarters - Residential treatment centers for emotionally disturbed children (%)
People in Group quarters - Training schools for juvenile delinquents (%)
People in Group quarters - Short-term care, detention or diagnostic centers for delinquent children (%)
People in Group quarters - Type of juvenile institution unknown (%)
People in Group quarters - Noninstitutionalized population (%)
People in Group quarters - College dormitories (includes college quarters off campus) (%)
People in Group quarters - Military quarters (%)
People in Group quarters - On base (%)
People in Group quarters - Barracks, unaccompanied personnel housing (UPH), (Enlisted/Officer), ;and similar group living quarters for military personnel (%)
People in Group quarters - Transient quarters for temporary residents (%)
People in Group quarters - Military ships (%)
People in Group quarters - Group homes (%)
People in Group quarters - Homes or halfway houses for drug/alcohol abuse (%)
People in Group quarters - Homes for the mentally ill (%)
People in Group quarters - Homes for the mentally retarded (%)
People in Group quarters - Homes for the physically handicapped (%)
People in Group quarters - Other group homes (%)
People in Group quarters - Religious group quarters (%)
People in Group quarters - Dormitories (%)
People in Group quarters - Agriculture workers' dormitories on farms (%)
People in Group quarters - Job Corps and vocational training facilities (%)
People in Group quarters - Other workers' dormitories (%)
People in Group quarters - Crews of maritime vessels (%)
People in Group quarters - Other nonhousehold living situations (%)
People in Group quarters - Other noninstitutional group quarters (%)
Residents speaking English at home (%)
Residents speaking English at home - Born in the United States (%)
Residents speaking English at home - Native, born elsewhere (%)
Residents speaking English at home - Foreign born (%)
Residents speaking Spanish at home (%)
Residents speaking Spanish at home - Born in the United States (%)
Residents speaking Spanish at home - Native, born elsewhere (%)
Residents speaking Spanish at home - Foreign born (%)
Residents speaking other language at home (%)
Residents speaking other language at home - Born in the United States (%)
Residents speaking other language at home - Native, born elsewhere (%)
Residents speaking other language at home - Foreign born (%)
Class of Workers - Employee of private company (%)
Class of Workers - Self-employed in own incorporated business (%)
Class of Workers - Private not-for-profit wage and salary workers (%)
Class of Workers - Local government workers (%)
Class of Workers - State government workers (%)
Class of Workers - Federal government workers (%)
Class of Workers - Self-employed workers in own not incorporated business and Unpaid family workers (%)
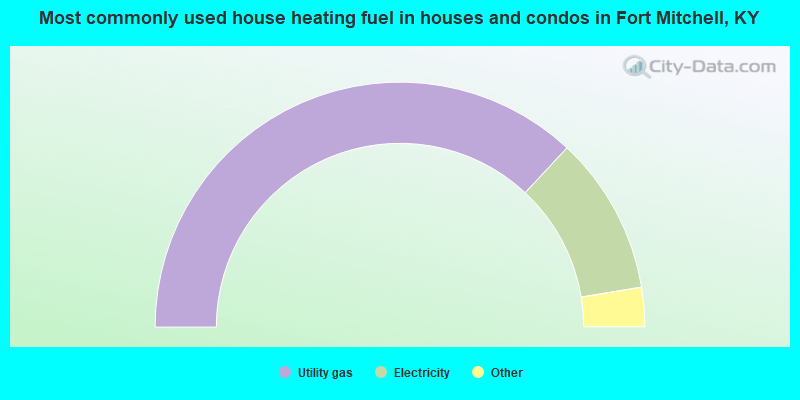
House heating fuel used in houses and condos - Utility gas (%)
House heating fuel used in houses and condos - Bottled, tank, or LP gas (%)
House heating fuel used in houses and condos - Electricity (%)
House heating fuel used in houses and condos - Fuel oil, kerosene, etc. (%)
House heating fuel used in houses and condos - Coal or coke (%)
House heating fuel used in houses and condos - Wood (%)
House heating fuel used in houses and condos - Solar energy (%)
House heating fuel used in houses and condos - Other fuel (%)
House heating fuel used in houses and condos - No fuel used (%)
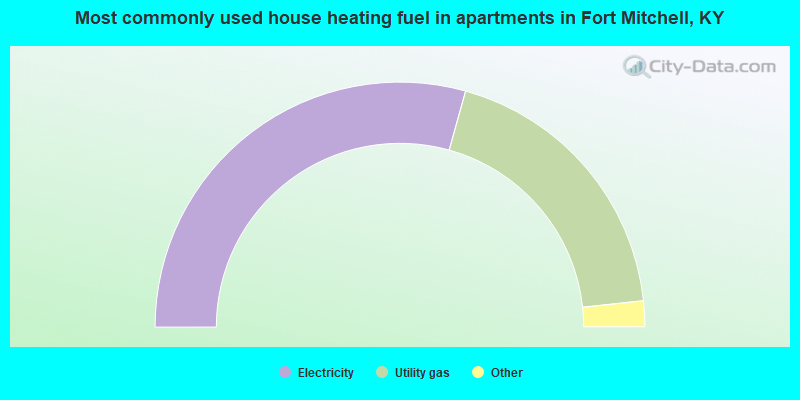
House heating fuel used in apartments - Utility gas (%)
House heating fuel used in apartments - Bottled, tank, or LP gas (%)
House heating fuel used in apartments - Electricity (%)
House heating fuel used in apartments - Fuel oil, kerosene, etc. (%)
House heating fuel used in apartments - Coal or coke (%)
House heating fuel used in apartments - Wood (%)
House heating fuel used in apartments - Solar energy (%)
House heating fuel used in apartments - Other fuel (%)
House heating fuel used in apartments - No fuel used (%)
Armed forces status - In Armed Forces (%)
Armed forces status - Civilian (%)
Armed forces status - Civilian - Veteran (%)
Armed forces status - Civilian - Nonveteran (%)
Fatal accidents locations in years 2005-2021
Fatal accidents locations in 2005
Fatal accidents locations in 2006
Fatal accidents locations in 2007
Fatal accidents locations in 2008
Fatal accidents locations in 2009
Fatal accidents locations in 2010
Fatal accidents locations in 2011
Fatal accidents locations in 2012
Fatal accidents locations in 2013
Fatal accidents locations in 2014
Fatal accidents locations in 2015
Fatal accidents locations in 2016
Fatal accidents locations in 2017
Fatal accidents locations in 2018
Fatal accidents locations in 2019
Fatal accidents locations in 2020
Fatal accidents locations in 2021
Alcohol use - People drinking some alcohol every month (%)
Alcohol use - People not drinking at all (%)
Alcohol use - Average days/month drinking alcohol
Alcohol use - Average drinks/week
Alcohol use - Average days/year people drink much
Audiometry - Average condition of hearing (%)
Audiometry - People that can hear a whisper from across a quiet room (%)
Audiometry - People that can hear normal voice from across a quiet room (%)
Audiometry - Ears ringing, roaring, buzzing (%)
Audiometry - Had a job exposure to loud noise (%)
Audiometry - Had off-work exposure to loud noise (%)
Blood Pressure & Cholesterol - Has high blood pressure (%)
Blood Pressure & Cholesterol - Checking blood pressure at home (%)
Blood Pressure & Cholesterol - Frequently checking blood cholesterol (%)
Blood Pressure & Cholesterol - Has high cholesterol level (%)
Consumer Behavior - Money monthly spent on food at supermarket/grocery store
Consumer Behavior - Money monthly spent on food at other stores
Consumer Behavior - Money monthly spent on eating out
Consumer Behavior - Money monthly spent on carryout/delivered foods
Consumer Behavior - Income spent on food at supermarket/grocery store (%)
Consumer Behavior - Income spent on food at other stores (%)
Consumer Behavior - Income spent on eating out (%)
Consumer Behavior - Income spent on carryout/delivered foods (%)
Current Health Status - General health condition (%)
Current Health Status - Blood donors (%)
Current Health Status - Has blood ever tested for HIV virus (%)
Current Health Status - Left-handed people (%)
Dermatology - People using sunscreen (%)
Diabetes - Diabetics (%)
Diabetes - Had a blood test for high blood sugar (%)
Diabetes - People taking insulin (%)
Diet Behavior & Nutrition - Diet health (%)
Diet Behavior & Nutrition - Milk product consumption (# of products/month)
Diet Behavior & Nutrition - Meals not home prepared (#/week)
Diet Behavior & Nutrition - Meals from fast food or pizza place (#/week)
Diet Behavior & Nutrition - Ready-to-eat foods (#/month)
Diet Behavior & Nutrition - Frozen meals/pizza (#/month)
Drug Use - People that ever used marijuana or hashish (%)
Drug Use - Ever used hard drugs (%)
Drug Use - Ever used any form of cocaine (%)
Drug Use - Ever used heroin (%)
Drug Use - Ever used methamphetamine (%)
Health Insurance - People covered by health insurance (%)
Kidney Conditions-Urology - Avg. # of times urinating at night
Medical Conditions - People with asthma (%)
Medical Conditions - People with anemia (%)
Medical Conditions - People with psoriasis (%)
Medical Conditions - People with overweight (%)
Medical Conditions - Elderly people having difficulties in thinking or remembering (%)
Medical Conditions - People who ever received blood transfusion (%)
Medical Conditions - People having trouble seeing even with glass/contacts (%)
Medical Conditions - People with arthritis (%)
Medical Conditions - People with gout (%)
Medical Conditions - People with congestive heart failure (%)
Medical Conditions - People with coronary heart disease (%)
Medical Conditions - People with angina pectoris (%)
Medical Conditions - People who ever had heart attack (%)
Medical Conditions - People who ever had stroke (%)
Medical Conditions - People with emphysema (%)
Medical Conditions - People with thyroid problem (%)
Medical Conditions - People with chronic bronchitis (%)
Medical Conditions - People with any liver condition (%)
Medical Conditions - People who ever had cancer or malignancy (%)
Mental Health - People who have little interest in doing things (%)
Mental Health - People feeling down, depressed, or hopeless (%)
Mental Health - People who have trouble sleeping or sleeping too much (%)
Mental Health - People feeling tired or having little energy (%)
Mental Health - People with poor appetite or overeating (%)
Mental Health - People feeling bad about themself (%)
Mental Health - People who have trouble concentrating on things (%)
Mental Health - People moving or speaking slowly or too fast (%)
Mental Health - People having thoughts they would be better off dead (%)
Oral Health - Average years since last visit a dentist
Oral Health - People embarrassed because of mouth (%)
Oral Health - People with gum disease (%)
Oral Health - General health of teeth and gums (%)
Oral Health - Average days a week using dental floss/device
Oral Health - Average days a week using mouthwash for dental problem
Oral Health - Average number of teeth
Pesticide Use - Households using pesticides to control insects (%)
Pesticide Use - Households using pesticides to kill weeds (%)
Physical Activity - People doing vigorous-intensity work activities (%)
Physical Activity - People doing moderate-intensity work activities (%)
Physical Activity - People walking or bicycling (%)
Physical Activity - People doing vigorous-intensity recreational activities (%)
Physical Activity - People doing moderate-intensity recreational activities (%)
Physical Activity - Average hours a day doing sedentary activities
Physical Activity - Average hours a day watching TV or videos
Physical Activity - Average hours a day using computer
Physical Functioning - People having limitations keeping them from working (%)
Physical Functioning - People limited in amount of work they can do (%)
Physical Functioning - People that need special equipment to walk (%)
Physical Functioning - People experiencing confusion/memory problems (%)
Physical Functioning - People requiring special healthcare equipment (%)
Prescription Medications - Average number of prescription medicines taking
Preventive Aspirin Use - Adults 40+ taking low-dose aspirin (%)
Reproductive Health - Vaginal deliveries (%)
Reproductive Health - Cesarean deliveries (%)
Reproductive Health - Deliveries resulted in a live birth (%)
Reproductive Health - Pregnancies resulted in a delivery (%)
Reproductive Health - Women breastfeeding newborns (%)
Reproductive Health - Women that had a hysterectomy (%)
Reproductive Health - Women that had both ovaries removed (%)
Reproductive Health - Women that have ever taken birth control pills (%)
Reproductive Health - Women taking birth control pills (%)
Reproductive Health - Women that have ever used Depo-Provera or injectables (%)
Reproductive Health - Women that have ever used female hormones (%)
Sexual Behavior - People 18+ that ever had sex (vaginal, anal, or oral) (%)
Sexual Behavior - Males 18+ that ever had vaginal sex with a woman (%)
Sexual Behavior - Males 18+ that ever performed oral sex on a woman (%)
Sexual Behavior - Males 18+ that ever had anal sex with a woman (%)
Sexual Behavior - Males 18+ that ever had any sex with a man (%)
Sexual Behavior - Females 18+ that ever had vaginal sex with a man (%)
Sexual Behavior - Females 18+ that ever performed oral sex on a man (%)
Sexual Behavior - Females 18+ that ever had anal sex with a man (%)
Sexual Behavior - Females 18+ that ever had any kind of sex with a woman (%)
Sexual Behavior - Average age people first had sex
Sexual Behavior - Average number of female sex partners in lifetime (males 18+)
Sexual Behavior - Average number of female vaginal sex partners in lifetime (males 18+)
Sexual Behavior - Average age people first performed oral sex on a woman (18+)
Sexual Behavior - Average number of woman performed oral sex on in lifetime (18+)
Sexual Behavior - Average number of male sex partners in lifetime (males 18+)
Sexual Behavior - Average number of male anal sex partners in lifetime (males 18+)
Sexual Behavior - Average age people first performed oral sex on a man (18+)
Sexual Behavior - Average number of male oral sex partners in lifetime (18+)
Sexual Behavior - People using protection when performing oral sex (%)
Sexual Behavior - Average number of times people have vaginal or anal sex a year
Sexual Behavior - People having sex without condom (%)
Sexual Behavior - Average number of male sex partners in lifetime (females 18+)
Sexual Behavior - Average number of male vaginal sex partners in lifetime (females 18+)
Sexual Behavior - Average number of female sex partners in lifetime (females 18+)
Sexual Behavior - Circumcised males 18+ (%)
Sleep Disorders - Average hours sleeping at night
Sleep Disorders - People that has trouble sleeping (%)
Smoking-Cigarette Use - People smoking cigarettes (%)
Taste & Smell - People 40+ having problems with smell (%)
Taste & Smell - People 40+ having problems with taste (%)
Taste & Smell - People 40+ that ever had wisdom teeth removed (%)
Taste & Smell - People 40+ that ever had tonsils teeth removed (%)
Taste & Smell - People 40+ that ever had a loss of consciousness because of a head injury (%)
Taste & Smell - People 40+ that ever had a broken nose or other serious injury to face or skull (%)
Taste & Smell - People 40+ that ever had two or more sinus infections (%)
Weight - Average height (inches)
Weight - Average weight (pounds)
Weight - Average BMI
Weight - People that are obese (%)
Weight - People that ever were obese (%)
Weight - People trying to lose weight (%)
According to our research of Kentucky and other state lists, there were 2 registered sex offenders living in Fort Mitchell, Kentucky as of May 05, 2024 . The ratio of all residents to sex offenders in Fort Mitchell is 4,146 to 1.The ratio of registered sex offenders to all residents in this city is much lower than the state average.
Officers per 1,000 residents here:
1.57Kentucky average:
1.89
Latest news from Fort Mitchell, KY collected exclusively by city-data.com from local newspapers, TV, and radio stations
Ancestries: German (35.7%), American (10.0%), English (9.8%), Irish (7.5%), European (5.7%), Scotch-Irish (3.9%).
Current Local Time:
Incorporated on 02/14/1910
Land area: 3.13 square miles.
Population density: 2,762 people per square mile (average).
263 residents are foreign born (1.4% Latin America , 0.9% Africa , 0.5% Asia ).
This city:
3.0%Kentucky:
4.1%
Median real estate property taxes paid for housing units with mortgages in 2022: $3,676 (0.9%)Median real estate property taxes paid for housing units with no mortgage in 2022: $3,120 (1.1%)
Nearest city with pop. 50,000+: Cincinnati, OH
Nearest city with pop. 1,000,000+: Chicago, IL
Nearest cities:
Kenton Vale, KY (1.5 miles),
Latitude: 39.05 N, Longitude: 84.56 W
Daytime population change due to commuting: -336 (-3.8%)Workers who live and work in this city: 1,581 (32.3%)
Fort Mitchell tourist attractions:
Single-family new house construction building permits:
2022: 3 buildings , average cost: $634,2002021: 3 buildings , average cost: $605,1002020: 4 buildings , average cost: $844,5002019: 7 buildings , average cost: $493,0002018: 3 buildings , average cost: $515,5002017: 3 buildings , average cost: $566,7002016: 7 buildings , average cost: $295,0002015: 7 buildings , average cost: $354,3002014: 10 buildings , average cost: $292,8002013: 4 buildings , average cost: $219,1002012: 4 buildings , average cost: $443,4002011: 7 buildings , average cost: $405,8002010: 4 buildings , average cost: $352,5002009: 3 buildings , average cost: $492,7002008: 5 buildings , average cost: $252,9002007: 9 buildings , average cost: $253,4002006: 14 buildings , average cost: $252,0002005: 18 buildings , average cost: $256,3002004: 18 buildings , average cost: $241,3002003: 6 buildings , average cost: $376,5002001: 3 buildings , average cost: $222,7002000: 2 buildings , average cost: $297,5001999: 4 buildings , average cost: $288,5001998: 6 buildings , average cost: $388,8001997: 7 buildings , average cost: $404,100Unemployment in December 2023:
Population change in the 1990s: +465 (+6.1%).
Most common occupations in Fort Mitchell, KY (%)
Both Males Females
Other management occupations, except farmers and farm managers (5.7%)
Sales representatives, services, wholesale and manufacturing (5.4%)
Other office and administrative support workers, including supervisors (4.9%)
Information and record clerks, except customer service representatives (3.5%)
Other sales and related occupations, including supervisors (3.5%)
Secretaries and administrative assistants (3.1%)
Material recording, scheduling, dispatching, and distributing workers (2.8%)
Other management occupations, except farmers and farm managers (6.1%)
Sales representatives, services, wholesale and manufacturing (5.9%)
Top executives (4.1%)
Operations specialties managers, except financial managers (3.9%)
Material recording, scheduling, dispatching, and distributing workers (3.7%)
Building and grounds cleaning and maintenance occupations (3.7%)
Other sales and related occupations, including supervisors (3.5%)
Other office and administrative support workers, including supervisors (7.0%)
Secretaries and administrative assistants (6.3%)
Other management occupations, except farmers and farm managers (5.2%)
Information and record clerks, except customer service representatives (5.1%)
Sales representatives, services, wholesale and manufacturing (4.9%)
Preschool, kindergarten, elementary, and middle school teachers (3.5%)
Other sales and related occupations, including supervisors (3.4%)
Tornado activity:
Fort Mitchell-area historical tornado activity is slightly above Kentucky state average. It is 66% greater than the overall U.S. average.
On 4/3/1974, a category F5 (max. wind speeds 261-318 mph) tornado 12.5 miles away from the Fort Mitchell city center killed 3 people and injured 210 people .
On 4/3/1974, a category F4 (max. wind speeds 207-260 mph) tornado 10.1 miles away from the city center killed 2 people and injured 39 people and caused between $50,000 and $500,000 in damages.
Earthquake activity:
Fort Mitchell-area historical earthquake activity is significantly above Kentucky state average. It is 52% greater than the overall U.S. average. On 7/27/1980 at 18:52:21, a magnitude 5.2 (5.1 MB, 4.7 MS, 5.0 UK, 5.2 UK, Class: Moderate, Intensity: VI - VII) earthquake occurred 67.1 miles away from the city center On 4/18/2008 at 09:36:59, a magnitude 5.4 (5.1 MB, 4.8 MS, 5.4 MW, 5.2 MW) earthquake occurred 184.1 miles away from Fort Mitchell center On 4/18/2008 at 09:36:59, a magnitude 5.2 (5.2 MW, Depth: 8.9 mi) earthquake occurred 184.1 miles away from the city center On 9/7/1988 at 02:28:09, a magnitude 4.6 (4.5 MB, 4.6 LG, Class: Light, Intensity: IV - V) earthquake occurred 72.6 miles away from Fort Mitchell center On 6/10/1987 at 23:48:54, a magnitude 5.1 (4.9 MB, 4.4 MS, 4.6 MS, 5.1 LG) earthquake occurred 179.6 miles away from Fort Mitchell center On 6/18/2002 at 17:37:15, a magnitude 5.0 (4.3 MB, 4.6 MW, 5.0 LG) earthquake occurred 189.0 miles away from Fort Mitchell center Magnitude types: regional Lg-wave magnitude (LG), body-wave magnitude (MB), surface-wave magnitude (MS), moment magnitude (MW) Natural disasters: The number of natural disasters in Kenton County (10) is smaller than the US average (15).Major Disasters (Presidential) Declared: 6Emergencies Declared: 2Floods: 5, Storms: 5, Tornadoes: 3, Winds: 2, Winter Storms: 2, Blizzard: 1, Hurricane: 1, Landslide: 1, Mudslide: 1, Tropical Depression: 1, Other: 1 (Note: some incidents may be assigned to more than one category). Hospitals and medical centers in Fort Mitchell: GENTIVA HEALTH SERVICES (2114 CHAMBER CENTER DRIVE)
Other hospitals and medical centers near Fort Mitchell: NORTHKEY COMMUNITY CARE INTENSIVE SERV (Hospital, about 2 miles away; COVINGTON, KY)
ST CHARLES CARE CENTER (Nursing Home, about 2 miles away; COVINGTON, KY)
ST CHARLES NH (Nursing Home, about 2 miles away; COVINGTON, KY)
AMEDISYS HOME HEALTH OF KENTUCKY (Home Health Center, about 2 miles away; CRESTVIEW HILLS, KY)
MADONNA MANOR (Nursing Home, about 2 miles away; VILLA HILLS, KY)
CARETENDERS OF NORTHERN KY (Home Health Center, about 3 miles away; EDGEWOOD, KY)
VILLAGE CARE CENTER (Nursing Home, about 3 miles away; ERLANGER, KY)
Amtrak station near Fort Mitchell: 5 miles: CINCINNATI (1301 WESTERN AVE.) Services: ticket office, fully wheelchair accessible, enclosed waiting area, public restrooms, public payphones, full-service food facilities, free short-term parking, paid long-term parking, taxi stand.
College/University in Fort Mitchell: Brown Mackie College-Northern Kentucky Full-time enrollment: 541; Location: 309 Buttermilk Pike; Private, for-profit; Website: www.brownmackie.edu)
Colleges/universities with over 2000 students nearest to Fort Mitchell:
Northern Kentucky University (about 6 miles; Highland Heights, KY ; Full-time enrollment: 12,059)
College of Mount St Joseph (about 6 miles; Cincinnati, OH ; FT enrollment: 2,073)
University of Cincinnati-Main Campus (about 7 miles; Cincinnati, OH ; FT enrollment: 28,747)
Gateway Community and Technical College (about 8 miles; Florence, KY ; FT enrollment: 2,422)
Cincinnati State Technical and Community College (about 8 miles; Cincinnati, OH ; FT enrollment: 8,757)
Xavier University (about 9 miles; Cincinnati, OH ; FT enrollment: 6,143)
University of Cincinnati-Blue Ash College (about 16 miles; Blue Ash, OH ; FT enrollment: 3,711)
Public high schools in Fort Mitchell: DIXIE HEIGHTS HIGH SCHOOL Students: 1,250, Location: 3010 DIXIE HWY, Grades: 9-12)BEECHWOOD HIGH SCHOOL Location: 54 BEECHWOOD RD, Grades: 7-12)
KENTON COUNTY ACADEMIES OF INNOVATION AND TECHNOLO Location: 3234 TURKEY FOOT ROAD, Grades: 9-12)
Public elementary/middle school in Fort Mitchell:
See full list of schools located in Fort Mitchell Birthplace of: Leslie Mills - Female singer, Paul G. Bens, Jr. - Blogger.
Kenton County has a predicted average indoor radon screening level between 2 and 4 pCi/L (pico curies per liter) - Moderate Potential Average household size: This city:
2.3 peopleKentucky:
2.5 people
Percentage of family households: This city:
59.7%Whole state:
66.9%
Percentage of households with unmarried partners: This city:
6.3%Whole state:
6.4%
Likely homosexual households (counted as self-reported same-sex unmarried-partner households)
Lesbian couples: 0.5% of all households Gay men: 0.1% of all households
30 people in residential treatment centers for juveniles (non-correctional) in 2010people in group homes intended for adults in 2010people in other noninstitutional group quarters in 2000people in other group homes in 2000
Banks with most branches in Fort Mitchell (2011 data):
Advantage Bank: Columbia Federal Savings Bank Branch at 2497 Dixie Highway, branch established on 1884/01/01. Info updated 2011/03/23: Bank assets: $767.1 mil, Deposits: $634.2 mil, headquarters in Cambridge, OH, positive income , Commercial Lending Specialization, 26 total offices , Holding Company: Camco Financial Corporation
PNC Bank, National Association: Fort Mitchell Branch at 2216 Dixie Highway, branch established on 1995/05/26. Info updated 2012/03/20: Bank assets: $263,309.6 mil, Deposits: $197,343.0 mil, headquarters in Wilmington, DE, positive income , Commercial Lending Specialization, 3085 total offices , Holding Company: Pnc Financial Services Group, Inc., The
The Bank of Kentucky, Inc.: Ft Mitchell Branch at 350 Buttermilk Pike, branch established on 1992/02/24. Info updated 2011/11/10: Bank assets: $1,743.6 mil, Deposits: $1,499.3 mil, headquarters in Crestview Hills, KY, positive income , Commercial Lending Specialization, 33 total offices , Holding Company: Bank Of Kentucky Financial Corporation, The
U.S. Bank National Association: Fort Mitchell Remke's Branch at 2501 Dixie Highway, branch established on 1981/03/02. Info updated 2012/01/30: Bank assets: $330,470.8 mil, Deposits: $236,091.5 mil, headquarters in Cincinnati, OH, positive income , 3121 total offices , Holding Company: U.S. Bancorp
The Huntington National Bank: Fort Mitchell Branch at 2514 Dixie Highway, branch established on 1955/04/07. Info updated 2012/04/02: Bank assets: $54,183.4 mil, Deposits: $44,300.3 mil, headquarters in Columbus, OH, positive income , Commercial Lending Specialization, 878 total offices , Holding Company: Huntington Bancshares Incorporated
Fifth Third Bank: Fort Mitchell Bank Mart Branch at 2150 Dixie Highway, branch established on 1995/05/19. Info updated 2009/10/05: Bank assets: $114,540.4 mil, Deposits: $89,689.1 mil, headquarters in Cincinnati, OH, positive income , Commercial Lending Specialization, 1378 total offices , Holding Company: Fifth Third Bancorp
Central Bank & Trust Co.: Fort Mitchell Branch at 2075 Dixie Highway, branch established on 2007/06/11. Info updated 2011/02/22: Bank assets: $1,908.6 mil, Deposits: $1,648.8 mil, headquarters in Lexington, KY, positive income , Commercial Lending Specialization, 23 total offices , Holding Company: Central Bancshares, Inc.
Victory Community Bank: at 2500 Chamber Center Drive, Suite 100, branch established on 2002/12/09. Info updated 2011/07/21: Bank assets: $151.7 mil, Deposits: $113.9 mil, local headquarters , positive income , Mortgage Lending Specialization, 3 total offices
KeyBank National Association: Fort Wright Branch at 3425 Valley Plaza Parkway, branch established on 2004/11/02. Info updated 2008/03/03: Bank assets: $86,198.8 mil, Deposits: $64,214.8 mil, headquarters in Cleveland, OH, positive income , Commercial Lending Specialization, 1067 total offices , Holding Company: Keycorp
For population 15 years and over in Fort Mitchell:
Never married: 35.9%Now married: 49.1%Separated: 0.3%Widowed: 3.1%Divorced: 11.6% For population 25 years and over in Fort Mitchell:
High school or higher: 96.0%Bachelor's degree or higher: 46.0%Graduate or professional degree: 20.4%Unemployed: 1.7%Mean travel time to work (commute): 18.4 minutes
Education Gini index (Inequality in education) Here:
9.6Kentucky average:
11.7
Religion statistics for Fort Mitchell, KY (based on Kenton County data)
Religion Adherents Congregations Catholic 42,500 20 Evangelical Protestant 22,877 85 Mainline Protestant 8,904 30 Other 2,658 8 Black Protestant 597 5 None 82,184 -
Source: Clifford Grammich, Kirk Hadaway, Richard Houseal, Dale E.Jones, Alexei Krindatch, Richie Stanley and Richard H.Taylor. 2012. 2010 U.S.Religion Census: Religious Congregations & Membership Study. Association of Statisticians of American Religious Bodies. Jones, Dale E., et al. 2002. Congregations and Membership in the United States 2000. Nashville, TN: Glenmary Research Center. Graphs represent county-level data
Food Environment Statistics: Number of grocery stores : 27This county :
1.72 / 10,000 pop.State :
2.19 / 10,000 pop.
Number of convenience stores (no gas) : 15Here :
0.96 / 10,000 pop.State :
0.74 / 10,000 pop.
Number of convenience stores (with gas) : 52Kenton County :
3.32 / 10,000 pop.Kentucky :
4.36 / 10,000 pop.
Number of full-service restaurants : 108Kenton County :
6.90 / 10,000 pop.State :
5.74 / 10,000 pop.
Adult diabetes rate : This county :
9.4%Kentucky :
11.0%
Low-income preschool obesity rate : Health and Nutrition:
Average overall health of teeth and gums : Fort Mitchell:
42.3%Kentucky:
47.0%
People feeling badly about themselves : This city:
21.2%Kentucky:
21.0%
People not drinking alcohol at all : Fort Mitchell:
9.6%Kentucky:
10.1%
Average hours sleeping at night : Fort Mitchell:
6.8Kentucky:
6.8
Overweight people : This city:
32.0%Kentucky:
33.8%
General health condition : This city:
54.0%Kentucky:
56.8%
Average condition of hearing : More about Health and Nutrition of Fort Mitchell, KY Residents
Local government employment and payroll (March 2022)
Function
Full-time employees
Monthly full-time payroll
Average yearly full-time wage
Part-time employees
Monthly part-time payroll
Police Protection - Officers
15 $91,295 $73,036 0 $0 Firefighters
15 $90,965 $72,772 28 $60,439 Streets and Highways
6 $33,425 $66,850 0 $0 Financial Administration
5 $31,174 $74,818 1 $861 Other Government Administration
0 $0 1 $852
Totals for Government
41 $246,859 $72,251 30 $62,151
Fort Mitchell government finances - Expenditure in 2021 (per resident):
Construction - Regular Highways: $1,356,000 ($156.71)
Central Staff Services: $409,000 ($47.27)Parks and Recreation: $90,000 ($10.40)Current Operations - Local Fire Protection: $1,685,000 ($194.73)
Police Protection: $1,194,000 ($137.99)Regular Highways: $970,000 ($112.10)Central Staff Services: $657,000 ($75.93)Parks and Recreation: $112,000 ($12.94)General - Interest on Debt: $2,000 ($0.23)
Intergovernmental to Local - Other - General - Other: $94,000 ($10.86)
Other Capital Outlay - Local Fire Protection: $1,295,000 ($149.66)
Police Protection: $121,000 ($13.98)Parks and Recreation: $71,000 ($8.21)Regular Highways: $30,000 ($3.47)Central Staff Services: $11,000 ($1.27)Total Salaries and Wages: $2,982,000 ($344.62)
Fort Mitchell government finances - Revenue in 2021 (per resident):
Charges - Solid Waste Management: $505,000 ($58.36)
Other: $302,000 ($34.90)Parks and Recreation: $2,000 ($0.23)Federal Intergovernmental - Other: $459,000 ($53.05)
General Local Government Support: $5,000 ($0.58)Highways: $1,000 ($0.12)Local Intergovernmental - Other: $687,000 ($79.39)
General Local Government Support: $99,000 ($11.44)Highways: $14,000 ($1.62)Miscellaneous - Interest Earnings: $61,000 ($7.05)
Sale of Property: $17,000 ($1.96)Fines and Forfeits: $2,000 ($0.23)State Intergovernmental - Other: $203,000 ($23.46)
Highways: $164,000 ($18.95)Tax - Individual Income: $2,726,000 ($315.04)
Insurance Premiums Sales: $1,896,000 ($219.11)Property: $1,877,000 ($216.92)Corporation Net Income: $616,000 ($71.19)Public Utilities Sales: $332,000 ($38.37)Occupation and Business License - Other: $103,000 ($11.90)Alcoholic Beverage License: $12,000 ($1.39)
Fort Mitchell government finances - Debt in 2021 (per resident):
Long Term Debt - Issue, Unspecified Public Purpose: $202,000 ($23.34)
Outstanding Unspecified Public Purpose: $134,000 ($15.49)Retired Unspecified Public Purpose: $112,000 ($12.94)Beginning Outstanding - Unspecified Public Purpose: $43,000 ($4.97)
Fort Mitchell government finances - Cash and Securities in 2021 (per resident):
Other Funds - Cash and Securities: $13,535,000 ($1564.20)
Businesses in Fort Mitchell, KY
Name Count Name Count
Dairy Queen 1 Papa John's Pizza 1 FedEx 1 Starbucks 1 Kroger 1
Strongest AM radio stations in Fort Mitchell:
WSAI (1530 AM; 50 kW; CINCINNATI, OH; Owner: JACOR BROADCASTING CORPORATION)
WKRC (550 AM; 5 kW; CINCINNATI, OH; Owner: JACOR BROADCASTING CORPORATION)
WLW (700 AM; 50 kW; CINCINNATI, OH; Owner: JACOR BROADCASTING CORPORATION)
WNOP (740 AM; 1 kW; NEWPORT, KY; Owner: SACRED HEART RADIO, INC.)
WTSJ (1050 AM; 1 kW; CINCINNATI, OH; Owner: CARON BROADCASTING, INC.)
WBOB (1160 AM; 5 kW; FLORENCE, KY; Owner: CARON BROADCASTING, INC.)
WCVG (1320 AM; 0 kW; COVINGTON, KY; Owner: RICHARD L. PLESSINGER SR.)
WCIN (1480 AM; 5 kW; CINCINNATI, OH)
WDBZ (1230 AM; 1 kW; CINCINNATI, OH; Owner: BLUE CHIP COMMUNICATIONS, INC.)
WCKY (1360 AM; 5 kW; CINCINNATI, OH; Owner: JACOR BROADCASTING CORPORATION)
WHAS (840 AM; 50 kW; LOUISVILLE, KY; Owner: CLEAR CHANNEL BROADCASTING LICENSES, INC.)
WTVN (610 AM; 50 kW; COLUMBUS, OH; Owner: CITICASTERS LICENSES, L.P.)
WCNW (1560 AM; daytime; 5 kW; FAIRFIELD, OH)
Strongest FM radio stations in Fort Mitchell:
WEBN (102.7 FM; CINCINNATI, OH; Owner: JACOR BROADCASTING CORPORATION)
WVMX (94.1 FM; CINCINNATI, OH; Owner: CITICASTERS LICENSES, L.P.)
WOFX-FM (92.5 FM; CINCINNATI, OH; Owner: JACOR BROADCASTING CORPORATION)
WGUC (90.9 FM; CINCINNATI, OH; Owner: CINCINNATI CLASSICAL PUBLIC RADIO, INC.)
WKRQ (101.9 FM; CINCINNATI, OH; Owner: INFINITY RADIO OPERATIONS INC.)
WKFS (107.1 FM; MILFORD, OH; Owner: JACOR BROADCASTING CORPORATION)
WIZF (100.9 FM; ERLANGER, KY; Owner: BLUE CHIP BROADCASTING LICENSES II, LTD.)
WUBE-FM (105.1 FM; CINCINNATI, OH; Owner: INFINITY RADIO OPERATIONS INC.)
WVXU (91.7 FM; CINCINNATI, OH; Owner: XAVIER UNIVERSITY)
WGRR (103.5 FM; HAMILTON, OH; Owner: INFINITY RADIO OPERATIONS INC.)
WNKU (89.7 FM; HIGHLAND HEIGHTS, KY; Owner: BD. OF REGENTS ON N. KY UNIV.)
WRRM (98.5 FM; CINCINNATI, OH; Owner: WRRM LICO, INC)
WAIF (88.3 FM; CINCINNATI, OH; Owner: STEPCHILD RADIO OF CINCINNATI, INC.)
WMOJ (94.9 FM; FAIRFIELD, OH; Owner: WVAE LICO, INC.)
WAKW (93.3 FM; CINCINNATI, OH; Owner: PILLAR OF FIRE)
WYGY (96.5 FM; LEBANON, OH; Owner: WVAE LICO, INC.)
WSCH (99.3 FM; AURORA, IN; Owner: COLUMBUS RADIO, INC.)
WNLT (104.3 FM; HARRISON, OH; Owner: VERNON R. BALDWIN, INC.)
WMKV (89.3 FM; READING, OH; Owner: LIFESPHERE)
WJYC (90.1 FM; DELHI HILLS, OH; Owner: LIFETALK RADIO, INC.)
TV broadcast stations around Fort Mitchell:
WLWT (Channel 5; CINCINNATI, OH; Owner: OHIO/OKLAHOMA HEARST-ARGYLE TV, INC)
WXIX-TV (Channel 19; NEWPORT, KY; Owner: RAYCOM NATIONAL, INC.)
WCPO-TV (Channel 9; CINCINNATI, OH; Owner: SCRIPPS HOWARD BROADCASTING COMPANY)
WKRC-TV (Channel 12; CINCINNATI, OH; Owner: CITICASTERS CO.)
WSTR-TV (Channel 64; CINCINNATI, OH; Owner: WSTR LICENSEE, INC.)
WCET (Channel 48; CINCINNATI, OH; Owner: THE GREATER CINCINNATI TV EDUC'L. FOUNDATION)
WCVN-TV (Channel 54; COVINGTON, KY; Owner: KENTUCKY AUTHORITY FOR EDUCATIONAL TV)
WOTH-LP (Channel 35; CINCINNATI, OH; Owner: ELLIOTT B. BLOCK)
WBQC-CA (Channel 25; CINCINNATI, OH; Owner: ELLIOTT B. BLOCK)
WPTO (Channel 14; OXFORD, OH; Owner: GREATER DAYTON PUBLIC TELEVISION, INC.)
WKOI (Channel 43; RICHMOND, IN; Owner: TRINITY BROADCASTING OF INDIANA, INC.)
FCC Registered Broadcast Land Mobile Towers: 3
Dixie Hwy & Highland Ave (Lat: 39.041167 Lon: -84.554667), Call Sign: KIQ828, Assigned Frequencies: 154.190 MHz, Grant Date: 03/16/2004, Expiration Date: 01/11/2014, Cancellation Date: 03/15/2014, Registrant: Mobilcomm, 1211 W Sharon Rd, Cincinnati, OH 45240, Phone: (513) 595-5800, Fax: (859) 331-6102, Email:
Int I 75 And Buttermilk Pike (Lat: 39.033667 Lon: -84.497444), Call Sign: KUL254, Licensee ID: L00028885, Assigned Frequencies: 154.515 MHz, Grant Date: 01/24/1997, Expiration Date: 03/17/2002, Cancellation Date: 05/19/2002, Registrant: Motor Inn Inc, I75 & Buttermilk Pike, Fort Mitchell, KY 41017 Lat: 39.048972 Lon: -84.554861, Call Sign: WRDW949, Assigned Frequencies: 464.012 MHz, 464.337 MHz, 464.662 MHz, 464.587 MHz, Grant Date: 08/09/2019, Expiration Date: 08/09/2029, Certifier: Brian Vanover, Registrant: Mobilcomm, Inc., 1211 W. Sharon Rd., Cincinnati, OH 45240, Phone: (513) 595-5800, Fax: (513) 595-5822, Email:
FCC Registered Microwave Towers: 1
OH-CIN1236A, 221 Grandview Dr (Lat: 39.052861 Lon: -84.563750), Type: Pole, Structure height: 35.1 m, Call Sign: WQNB314, Assigned Frequencies: 21825.0 MHz, 21975.0 MHz, Grant Date: 03/04/2021, Expiration Date: 12/01/2030, Certifier: Nadja S Sodos-Wallace, Registrant: T-Mobile Usa, Inc., 12920 Se 38th Street, Bellevue, WA 98006, Phone: (425) 383-8401, Fax: (425) 383-4840, Email:
FCC Registered Paging Towers: 1
221 Grandview Drive (Lat: 39.054500 Lon: -84.562139), Overall height: 35.1 m, Call Sign: KNKO238, Assigned Frequencies: 931.337 MHz, Grant Date: 08/14/2018, Expiration Date: 07/01/2028, Certifier: J. Roy Pottle, Registrant: Wilkinson Barker Knauer, LLP, 1800 M Street, N.W., Suite 800n, Washington, DC 20036, Phone: (202) 783-4141, Fax: (202) 783-5851, Email:
FCC Registered Amateur Radio Licenses: 36 (
See the full list of FCC Registered Amateur Radio Licenses in Fort Mitchell )
FAA Registered Aircraft: 1
Aircraft: CESSNA P210N (Category: Land, Seats: 6, Weight: Up to 12,499 Pounds, Speed: 141 mph), Engine: ReciprocatingN-Number: 5GA, N5GA, N-5GA, Serial Number: P21000189, Certificate Issue Date: 08/31/2018Registrant (Individual): Urban E Schroder, 425 Highland Ave, Fort Mitchell, KY 41017
Home Mortgage Disclosure Act Aggregated Statistics For Year 2009(Based on 3 partial tracts) A) FHA, FSA/RHS & VA B) Conventional C) Refinancings D) Home Improvement Loans F) Non-occupant Loans on G) Loans On Manufactured Number Average Value Number Average Value Number Average Value Number Average Value Number Average Value Number Average Value
LOANS ORIGINATED 21 $163,664 47 $189,086 269 $190,850 9 $102,666 13 $142,174 1 $124,020 APPLICATIONS APPROVED, NOT ACCEPTED 1 $78,380 1 $376,030 12 $171,093 0 $0 1 $190,980 0 $0 APPLICATIONS DENIED 4 $139,588 1 $52,270 50 $212,731 5 $51,516 3 $117,167 1 $14,360 APPLICATIONS WITHDRAWN 1 $150,300 3 $234,570 39 $182,650 4 $93,518 2 $113,340 0 $0 FILES CLOSED FOR INCOMPLETENESS 0 $0 0 $0 9 $191,771 0 $0 1 $76,740 0 $0
Aggregated Statistics For Year 2008(Based on 3 partial tracts) A) FHA, FSA/RHS & VA B) Conventional C) Refinancings D) Home Improvement Loans F) Non-occupant Loans on G) Loans On Manufactured Number Average Value Number Average Value Number Average Value Number Average Value Number Average Value Number Average Value
LOANS ORIGINATED 8 $155,518 59 $194,818 119 $184,028 14 $79,897 17 $117,011 0 $0 APPLICATIONS APPROVED, NOT ACCEPTED 1 $94,490 4 $184,068 11 $157,767 1 $17,770 2 $157,280 1 $22,010 APPLICATIONS DENIED 1 $106,690 8 $177,232 46 $187,152 6 $87,298 1 $100,020 1 $39,320 APPLICATIONS WITHDRAWN 1 $113,980 5 $231,138 22 $214,568 3 $82,680 1 $150,920 0 $0 FILES CLOSED FOR INCOMPLETENESS 0 $0 1 $99,470 3 $239,893 0 $0 0 $0 0 $0
Aggregated Statistics For Year 2007(Based on 3 partial tracts) A) FHA, FSA/RHS & VA B) Conventional C) Refinancings D) Home Improvement Loans F) Non-occupant Loans on G) Loans On Manufactured Number Average Value Number Average Value Number Average Value Number Average Value Number Average Value Number Average Value
LOANS ORIGINATED 4 $162,995 87 $165,726 110 $171,332 14 $62,619 16 $159,392 0 $0 APPLICATIONS APPROVED, NOT ACCEPTED 0 $0 10 $129,331 16 $157,118 3 $30,977 2 $221,315 1 $27,550 APPLICATIONS DENIED 3 $276,230 6 $171,067 51 $162,731 10 $45,052 4 $160,152 0 $0 APPLICATIONS WITHDRAWN 0 $0 6 $153,750 18 $169,121 2 $75,305 1 $196,480 0 $0 FILES CLOSED FOR INCOMPLETENESS 0 $0 2 $182,620 3 $175,157 0 $0 0 $0 0 $0
Aggregated Statistics For Year 2006(Based on 3 partial tracts) A) FHA, FSA/RHS & VA B) Conventional C) Refinancings D) Home Improvement Loans E) Loans on Dwellings For 5+ Families F) Non-occupant Loans on G) Loans On Manufactured Number Average Value Number Average Value Number Average Value Number Average Value Number Average Value Number Average Value Number Average Value
LOANS ORIGINATED 7 $176,760 108 $176,199 98 $168,424 22 $43,291 1 $115,770 12 $134,223 1 $29,570 APPLICATIONS APPROVED, NOT ACCEPTED 2 $110,465 9 $120,034 14 $163,961 5 $46,312 0 $0 1 $132,670 0 $0 APPLICATIONS DENIED 1 $151,950 10 $135,863 38 $135,264 7 $77,821 0 $0 4 $110,912 0 $0 APPLICATIONS WITHDRAWN 1 $287,450 10 $111,609 19 $169,668 1 $118,270 0 $0 1 $151,670 0 $0 FILES CLOSED FOR INCOMPLETENESS 0 $0 3 $150,997 7 $166,247 0 $0 0 $0 0 $0 0 $0
Aggregated Statistics For Year 2005(Based on 3 partial tracts) A) FHA, FSA/RHS & VA B) Conventional C) Refinancings D) Home Improvement Loans F) Non-occupant Loans on G) Loans On Manufactured Number Average Value Number Average Value Number Average Value Number Average Value Number Average Value Number Average Value
LOANS ORIGINATED 5 $124,924 110 $149,898 118 $152,157 10 $41,288 15 $113,457 0 $0 APPLICATIONS APPROVED, NOT ACCEPTED 1 $108,410 12 $112,013 8 $158,005 2 $38,985 1 $105,540 0 $0 APPLICATIONS DENIED 1 $195,320 14 $96,623 31 $132,529 14 $48,254 5 $91,078 3 $39,240 APPLICATIONS WITHDRAWN 0 $0 10 $160,467 19 $163,976 1 $251,020 2 $199,275 0 $0 FILES CLOSED FOR INCOMPLETENESS 0 $0 2 $156,145 7 $181,500 0 $0 0 $0 0 $0
Aggregated Statistics For Year 2004(Based on 3 partial tracts) A) FHA, FSA/RHS & VA B) Conventional C) Refinancings D) Home Improvement Loans F) Non-occupant Loans on G) Loans On Manufactured Number Average Value Number Average Value Number Average Value Number Average Value Number Average Value Number Average Value
LOANS ORIGINATED 8 $142,824 95 $143,638 191 $152,074 18 $47,916 18 $126,588 0 $0 APPLICATIONS APPROVED, NOT ACCEPTED 0 $0 11 $135,025 20 $182,211 3 $14,330 3 $157,067 0 $0 APPLICATIONS DENIED 2 $145,400 12 $122,616 48 $159,609 9 $48,839 3 $146,870 3 $68,930 APPLICATIONS WITHDRAWN 1 $125,970 7 $109,191 22 $144,780 3 $17,073 1 $101,860 0 $0 FILES CLOSED FOR INCOMPLETENESS 0 $0 1 $390,070 19 $143,286 0 $0 0 $0 0 $0
Aggregated Statistics For Year 2003(Based on 3 partial tracts) A) FHA, FSA/RHS & VA B) Conventional C) Refinancings D) Home Improvement Loans F) Non-occupant Loans on Number Average Value Number Average Value Number Average Value Number Average Value Number Average Value
LOANS ORIGINATED 7 $127,024 123 $143,741 566 $142,855 17 $26,992 34 $103,475 APPLICATIONS APPROVED, NOT ACCEPTED 0 $0 5 $113,816 48 $138,978 4 $25,295 0 $0 APPLICATIONS DENIED 1 $91,900 11 $105,507 44 $150,980 6 $75,425 5 $88,414 APPLICATIONS WITHDRAWN 0 $0 7 $104,510 35 $135,684 1 $3,830 0 $0 FILES CLOSED FOR INCOMPLETENESS 0 $0 3 $151,443 13 $149,775 0 $0 1 $104,750
Aggregated Statistics For Year 2002(Based on 3 partial tracts) A) FHA, FSA/RHS & VA B) Conventional C) Refinancings D) Home Improvement Loans F) Non-occupant Loans on Number Average Value Number Average Value Number Average Value Number Average Value Number Average Value
LOANS ORIGINATED 14 $116,344 75 $141,152 337 $144,827 6 $48,777 12 $113,198 APPLICATIONS APPROVED, NOT ACCEPTED 1 $48,350 7 $111,541 36 $154,384 4 $11,575 1 $162,620 APPLICATIONS DENIED 0 $0 8 $88,490 42 $148,916 5 $29,304 1 $105,960 APPLICATIONS WITHDRAWN 3 $125,243 13 $166,884 27 $140,091 0 $0 1 $130,280 FILES CLOSED FOR INCOMPLETENESS 0 $0 2 $86,050 12 $153,178 0 $0 0 $0
Aggregated Statistics For Year 2001(Based on 3 partial tracts) A) FHA, FSA/RHS & VA B) Conventional C) Refinancings D) Home Improvement Loans E) Loans on Dwellings For 5+ Families F) Non-occupant Loans on Number Average Value Number Average Value Number Average Value Number Average Value Number Average Value Number Average Value
LOANS ORIGINATED 14 $123,227 106 $134,261 235 $126,463 17 $21,512 1 $248,820 8 $84,802 APPLICATIONS APPROVED, NOT ACCEPTED 1 $95,270 7 $101,286 21 $116,480 2 $25,600 0 $0 0 $0 APPLICATIONS DENIED 0 $0 14 $73,889 31 $136,054 9 $14,687 0 $0 1 $34,900 APPLICATIONS WITHDRAWN 1 $60,560 5 $93,708 26 $125,170 2 $14,935 0 $0 2 $120,350 FILES CLOSED FOR INCOMPLETENESS 0 $0 4 $91,745 6 $130,098 1 $65,770 0 $0 1 $118,420
Aggregated Statistics For Year 2000(Based on 3 partial tracts) A) FHA, FSA/RHS & VA B) Conventional C) Refinancings D) Home Improvement Loans F) Non-occupant Loans on Number Average Value Number Average Value Number Average Value Number Average Value Number Average Value
LOANS ORIGINATED 14 $112,119 84 $120,839 66 $120,111 17 $18,026 9 $141,431 APPLICATIONS APPROVED, NOT ACCEPTED 1 $49,720 9 $80,806 7 $100,016 7 $19,576 0 $0 APPLICATIONS DENIED 0 $0 12 $57,182 15 $97,761 7 $31,584 1 $9,520 APPLICATIONS WITHDRAWN 0 $0 3 $217,830 11 $89,319 2 $23,675 1 $68,770 FILES CLOSED FOR INCOMPLETENESS 0 $0 2 $105,795 3 $99,533 1 $32,850 0 $0
Aggregated Statistics For Year 1999(Based on 3 partial tracts) A) FHA, FSA/RHS & VA B) Conventional C) Refinancings D) Home Improvement Loans F) Non-occupant Loans on Number Average Value Number Average Value Number Average Value Number Average Value Number Average Value
LOANS ORIGINATED 11 $116,457 100 $132,461 140 $102,769 24 $17,940 13 $80,521 APPLICATIONS APPROVED, NOT ACCEPTED 0 $0 9 $94,034 23 $88,867 1 $10,890 1 $82,990 APPLICATIONS DENIED 2 $160,500 17 $84,951 23 $80,002 4 $36,018 3 $53,977 APPLICATIONS WITHDRAWN 1 $119,440 8 $121,425 17 $85,197 2 $15,405 0 $0 FILES CLOSED FOR INCOMPLETENESS 1 $70,710 0 $0 5 $103,822 0 $0 0 $0
Detailed HMDA statistics for the following Tracts:
0646.00
, 0647.00 , 0648.00
Private Mortgage Insurance Companies Aggregated Statistics For Year 2009(Based on 3 partial tracts) A) Conventional B) Refinancings Number Average Value Number Average Value
LOANS ORIGINATED 6 $175,497 6 $188,095 APPLICATIONS APPROVED, NOT ACCEPTED 2 $572,865 1 $314,140 APPLICATIONS DENIED 2 $219,490 1 $220,000 APPLICATIONS WITHDRAWN 1 $70,810 0 $0 FILES CLOSED FOR INCOMPLETENESS 0 $0 0 $0
Aggregated Statistics For Year 2008(Based on 3 partial tracts) A) Conventional B) Refinancings Number Average Value Number Average Value
LOANS ORIGINATED 14 $238,883 7 $169,727 APPLICATIONS APPROVED, NOT ACCEPTED 3 $256,573 4 $220,110 APPLICATIONS DENIED 2 $520,100 2 $226,680 APPLICATIONS WITHDRAWN 0 $0 0 $0 FILES CLOSED FOR INCOMPLETENESS 0 $0 0 $0
Aggregated Statistics For Year 2007(Based on 3 partial tracts) A) Conventional B) Refinancings C) Non-occupant Loans on Number Average Value Number Average Value Number Average Value
LOANS ORIGINATED 25 $140,859 5 $167,088 3 $125,300 APPLICATIONS APPROVED, NOT ACCEPTED 4 $268,178 2 $127,075 0 $0 APPLICATIONS DENIED 0 $0 0 $0 0 $0 APPLICATIONS WITHDRAWN 2 $320,555 0 $0 0 $0 FILES CLOSED FOR INCOMPLETENESS 0 $0 0 $0 0 $0
Aggregated Statistics For Year 2006(Based on 3 partial tracts) A) Conventional B) Refinancings C) Non-occupant Loans on Number Average Value Number Average Value Number Average Value
LOANS ORIGINATED 16 $159,524 5 $146,608 1 $218,040 APPLICATIONS APPROVED, NOT ACCEPTED 2 $274,195 1 $228,980 0 $0 APPLICATIONS DENIED 0 $0 0 $0 0 $0 APPLICATIONS WITHDRAWN 2 $155,225 1 $128,940 1 $115,800 FILES CLOSED FOR INCOMPLETENESS 0 $0 0 $0 0 $0
Aggregated Statistics For Year 2005(Based on 3 partial tracts) A) Conventional B) Refinancings C) Non-occupant Loans on Number Average Value Number Average Value Number Average Value
LOANS ORIGINATED 16 $156,176 6 $208,530 3 $137,293 APPLICATIONS APPROVED, NOT ACCEPTED 1 $93,920 1 $173,940 1 $138,800 APPLICATIONS DENIED 1 $348,260 0 $0 0 $0 APPLICATIONS WITHDRAWN 0 $0 0 $0 0 $0 FILES CLOSED FOR INCOMPLETENESS 0 $0 0 $0 0 $0
Aggregated Statistics For Year 2004(Based on 3 partial tracts) A) Conventional B) Refinancings C) Non-occupant Loans on Number Average Value Number Average Value Number Average Value
LOANS ORIGINATED 14 $169,601 11 $152,535 3 $203,520 APPLICATIONS APPROVED, NOT ACCEPTED 4 $160,692 2 $247,255 1 $128,940 APPLICATIONS DENIED 0 $0 0 $0 0 $0 APPLICATIONS WITHDRAWN 0 $0 1 $184,790 0 $0 FILES CLOSED FOR INCOMPLETENESS 1 $136,340 1 $154,990 2 $137,570
Aggregated Statistics For Year 2003(Based on 3 partial tracts) A) Conventional B) Refinancings C) Non-occupant Loans on Number Average Value Number Average Value Number Average Value
LOANS ORIGINATED 25 $159,525 25 $158,254 4 $122,598 APPLICATIONS APPROVED, NOT ACCEPTED 5 $123,806 7 $130,950 0 $0 APPLICATIONS DENIED 0 $0 0 $0 0 $0 APPLICATIONS WITHDRAWN 1 $96,090 5 $153,760 0 $0 FILES CLOSED FOR INCOMPLETENESS 0 $0 0 $0 0 $0
Aggregated Statistics For Year 2002(Based on 3 partial tracts) A) Conventional B) Refinancings C) Non-occupant Loans on Number Average Value Number Average Value Number Average Value
LOANS ORIGINATED 24 $139,862 21 $145,106 2 $154,820 APPLICATIONS APPROVED, NOT ACCEPTED 4 $171,702 3 $152,753 1 $85,420 APPLICATIONS DENIED 0 $0 0 $0 0 $0 APPLICATIONS WITHDRAWN 0 $0 4 $162,065 0 $0 FILES CLOSED FOR INCOMPLETENESS 0 $0 0 $0 0 $0
Aggregated Statistics For Year 2001(Based on 3 partial tracts) A) Conventional B) Refinancings Number Average Value Number Average Value
LOANS ORIGINATED 19 $131,949 23 $128,007 APPLICATIONS APPROVED, NOT ACCEPTED 6 $123,522 3 $121,103 APPLICATIONS DENIED 2 $125,250 0 $0 APPLICATIONS WITHDRAWN 0 $0 1 $139,300 FILES CLOSED FOR INCOMPLETENESS 0 $0 0 $0
Aggregated Statistics For Year 2000(Based on 3 partial tracts) A) Conventional B) Refinancings Number Average Value Number Average Value
LOANS ORIGINATED 21 $117,916 3 $90,510 APPLICATIONS APPROVED, NOT ACCEPTED 1 $266,980 0 $0 APPLICATIONS DENIED 0 $0 0 $0 APPLICATIONS WITHDRAWN 2 $100,460 0 $0 FILES CLOSED FOR INCOMPLETENESS 1 $110,880 0 $0
Aggregated Statistics For Year 1999(Based on 3 partial tracts) A) Conventional B) Refinancings C) Non-occupant Loans on Number Average Value Number Average Value Number Average Value
LOANS ORIGINATED 35 $121,172 16 $128,206 1 $58,530 APPLICATIONS APPROVED, NOT ACCEPTED 4 $116,352 2 $146,205 0 $0 APPLICATIONS DENIED 1 $103,050 0 $0 0 $0 APPLICATIONS WITHDRAWN 1 $116,860 0 $0 0 $0 FILES CLOSED FOR INCOMPLETENESS 0 $0 1 $107,170 0 $0
Detailed PMIC statistics for the following Tracts:
0646.00
, 0647.00 , 0648.00 Fort Mitchell compared to Kentucky state average:
Median house value above state average. Unemployed percentage significantly below state average. Black race population percentage significantly below state average. Median age below state average. Renting percentage above state average. House age above state average. Percentage of population with a bachelor's degree or higher significantly above state average. Fort Mitchell on our top lists :
#23 on the list of "Top 101 cities with the most residents born in Other Eastern Africa (population 500+)"
#32 on the list of "Top 101 cities with the most residents born in Other Northern Europe (population 500+)"
#74 on the list of "Top 101 cities with the most residents born in Eastern Africa (population 500+)"
#88 on the list of "Top 101 cities with largest percentage of males in industries: health care and social assistance (population 5,000+)"
#91 on the list of "Top 101 counties with the highest number of births per 1000 residents 2007-2013"
#93 on the list of "Top 101 counties with the lowest percentage of residents relocating from foreign countries between 2010 and 2011"
Top Patent Applicants
Christine Marie Readnour (23)
Robert Charles Hon (9)
Scott William Syfert (3)
Lawrence J. Busse (3)
Roger Dale Young (2)
Michael Crowe (1)
Jay S. Hissett (1)
Matthew Kratzer (1)
Joseph Lawrence Dorsey (1)
Kathleen Diana Brammer (1)
Total of 52 patent applications in 2008-2024.
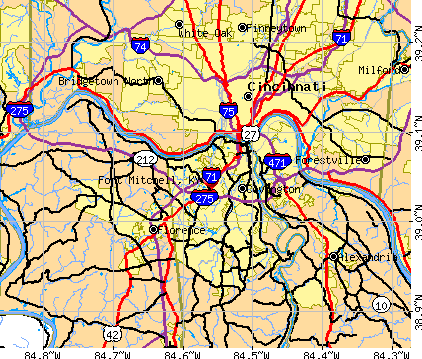


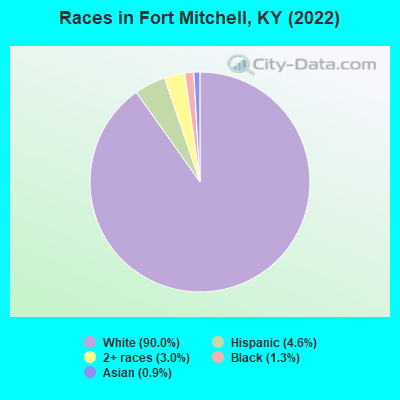
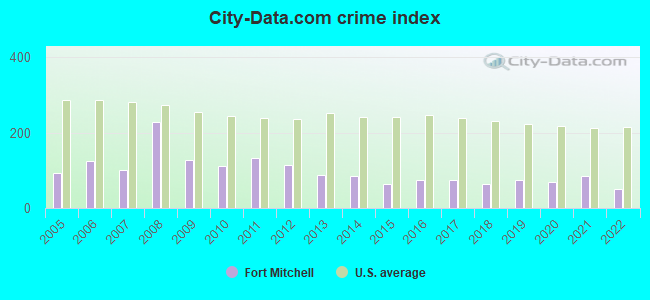
 Recent articles from our blog. Our writers, many of them Ph.D. graduates or candidates, create easy-to-read articles on a wide variety of topics.

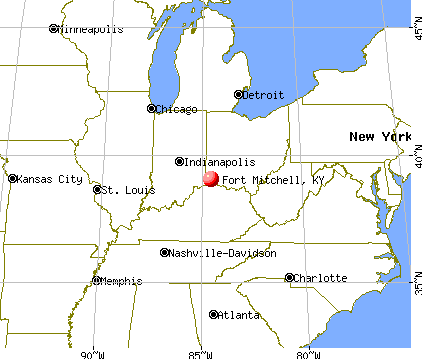
 (6.9 miles
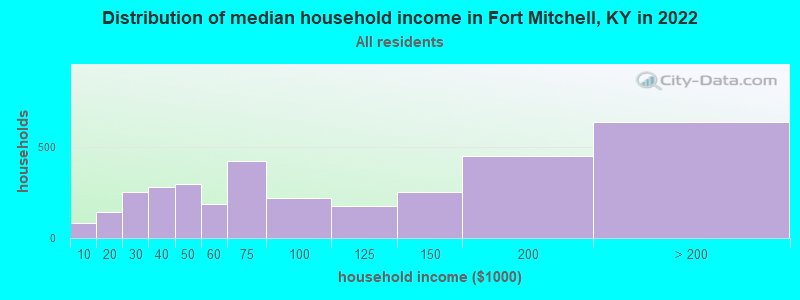
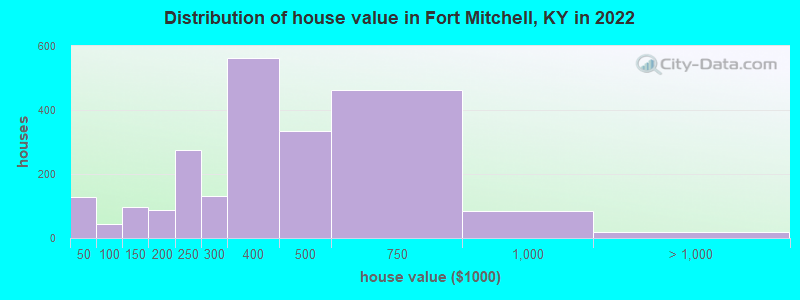

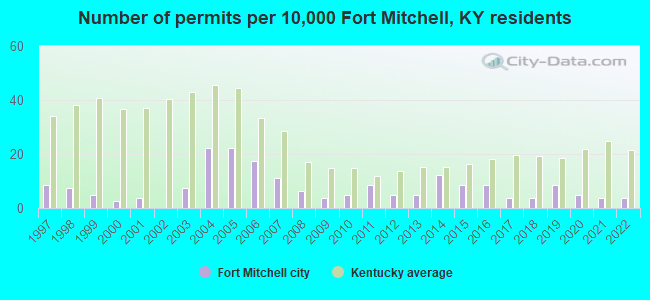
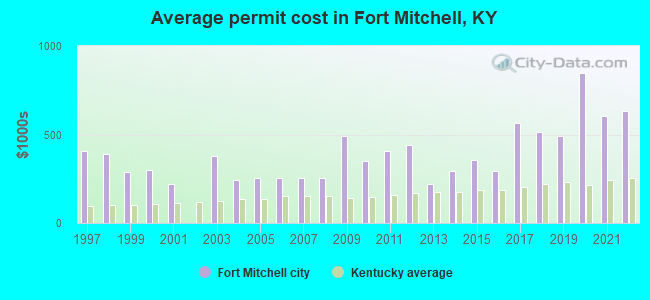
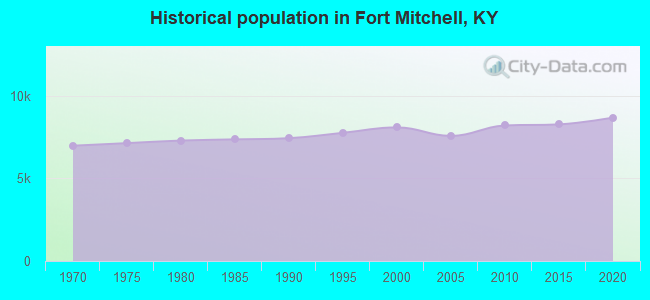
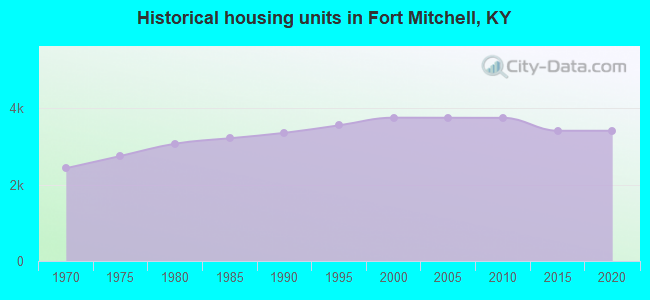
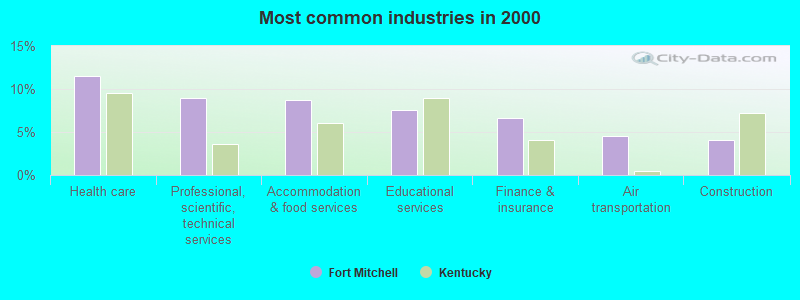
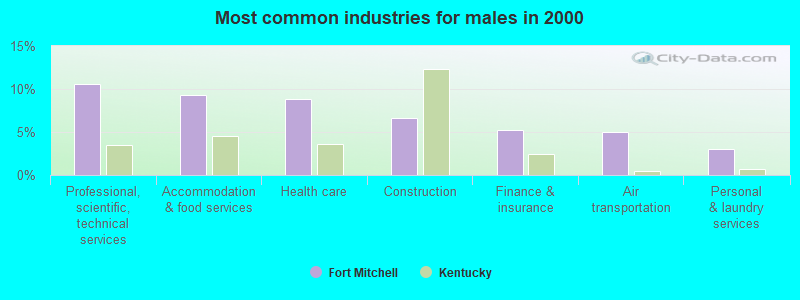
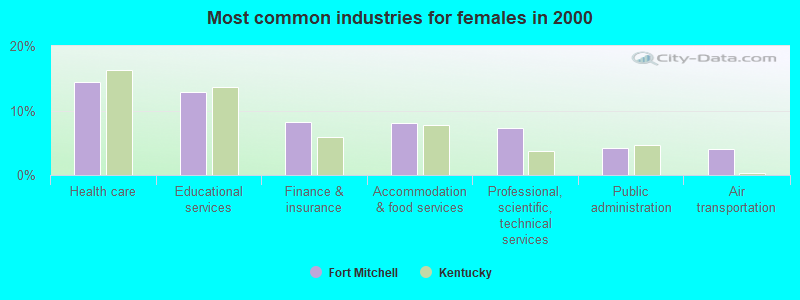
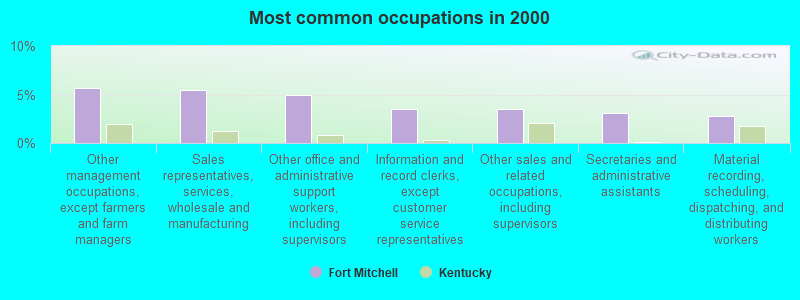
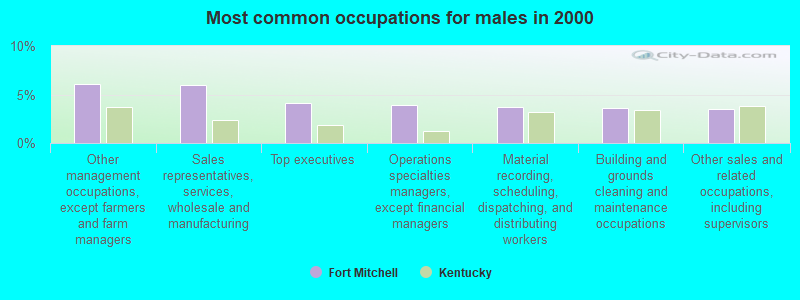
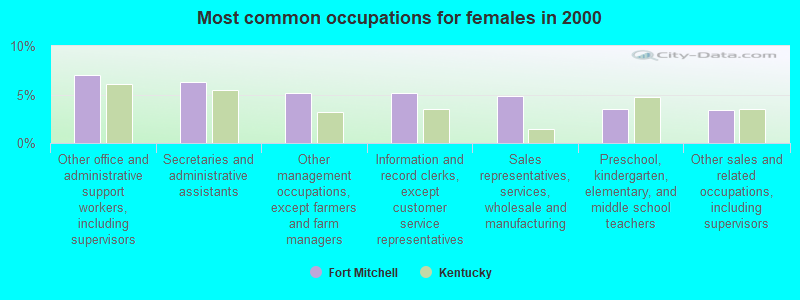
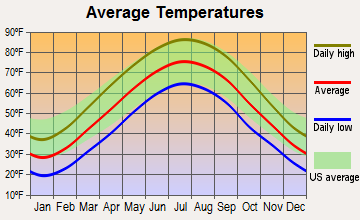
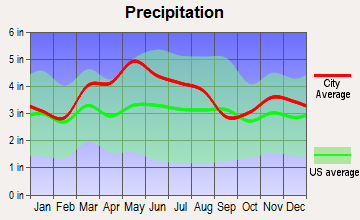
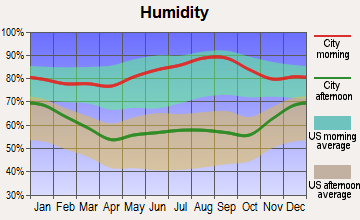
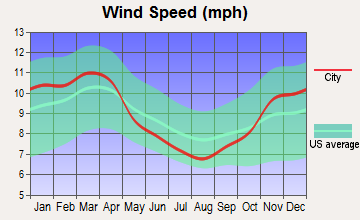
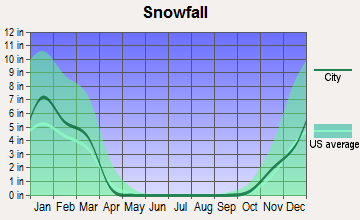
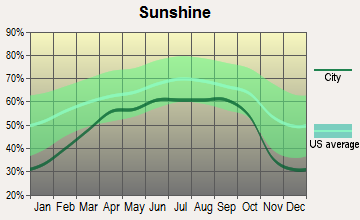
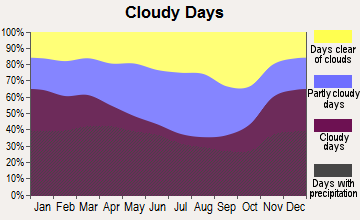


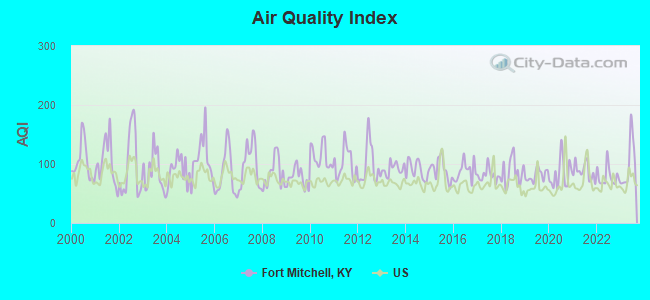
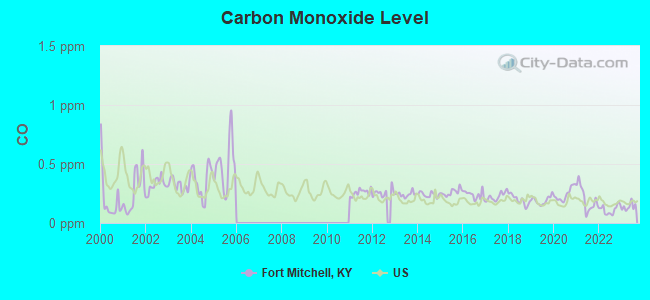
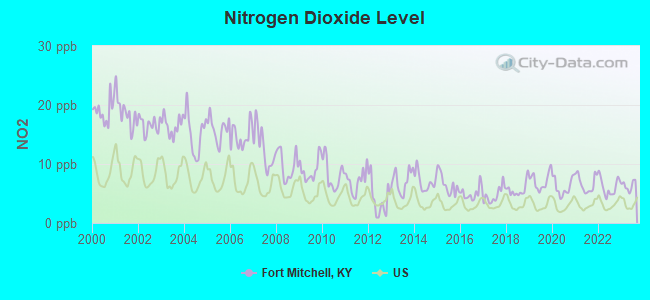
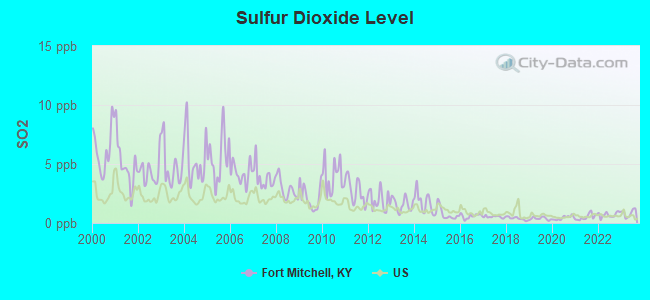
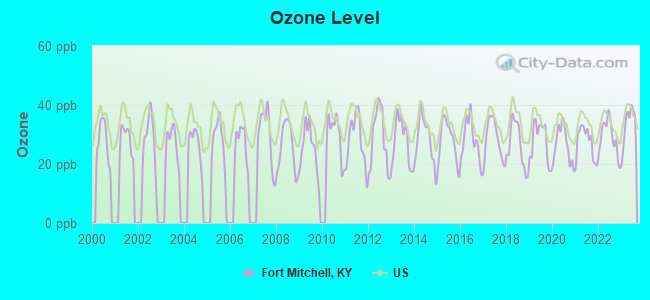
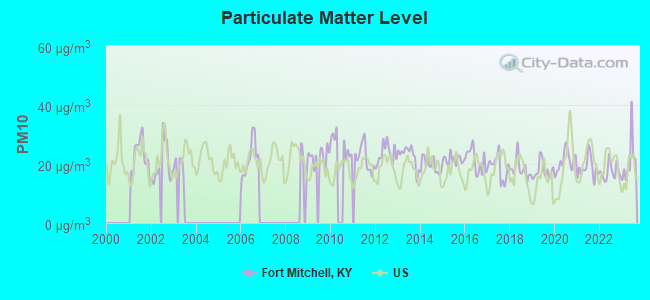
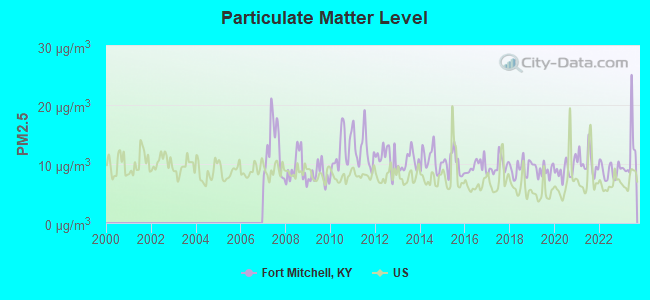

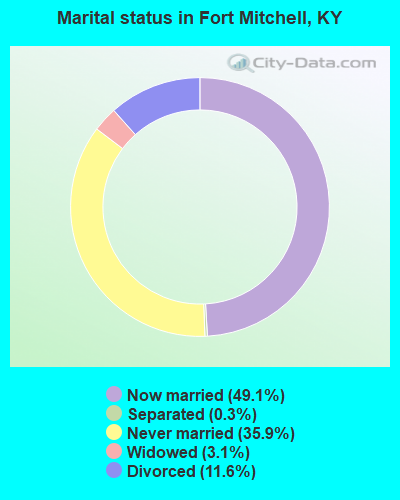
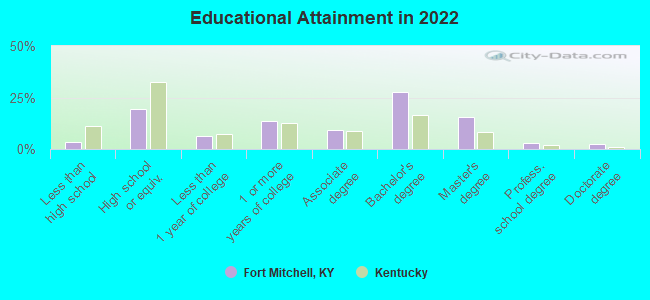
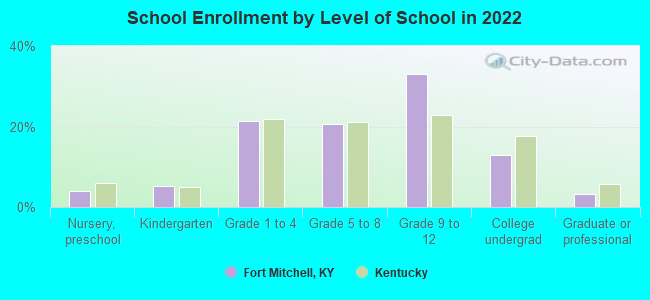
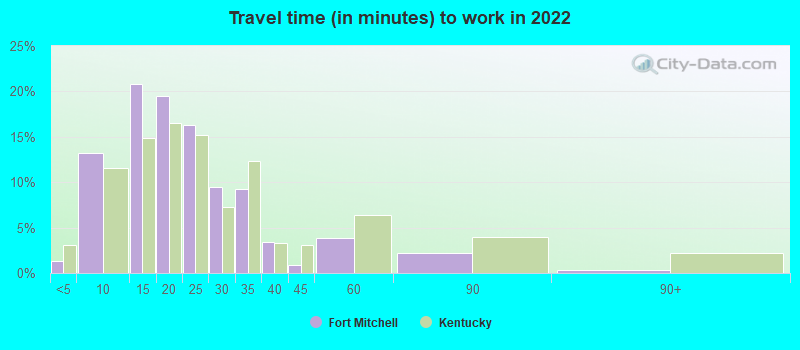
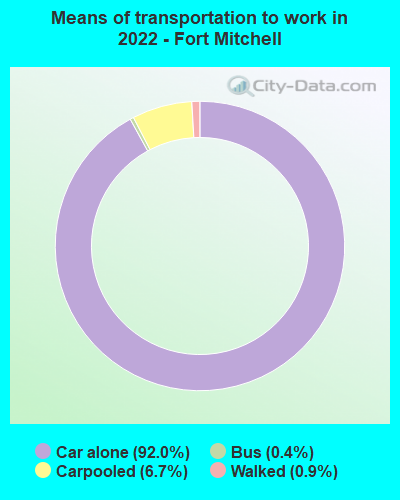
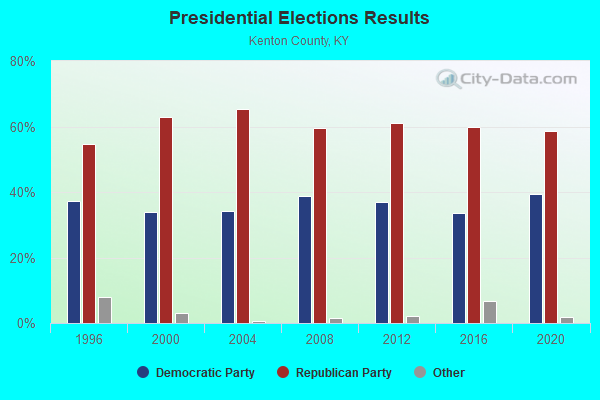
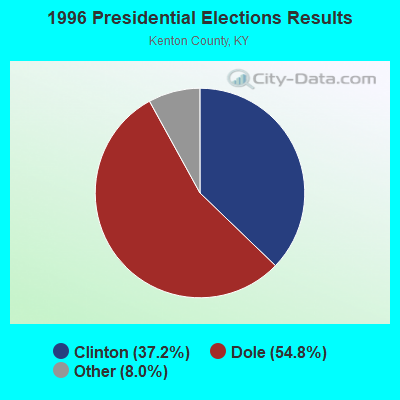
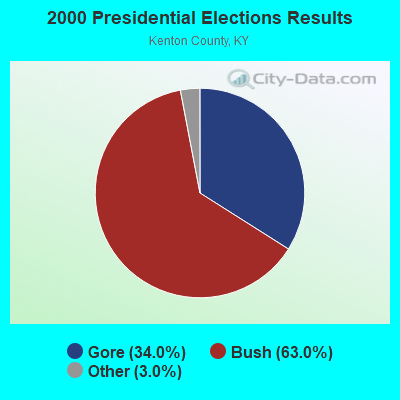
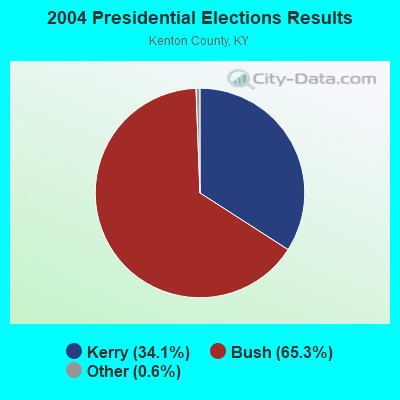

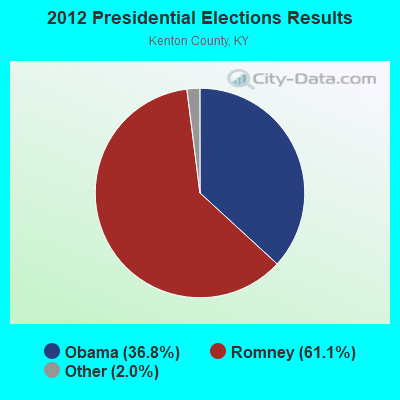
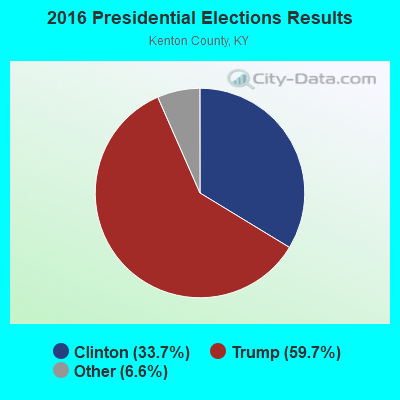
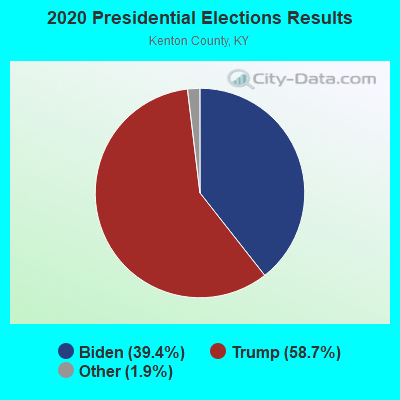
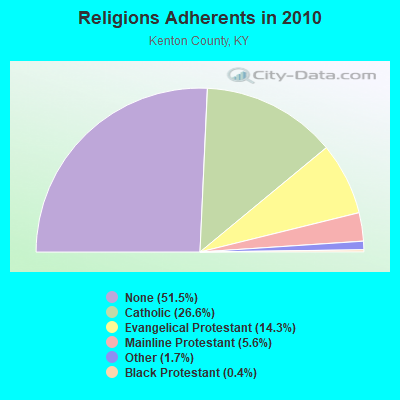
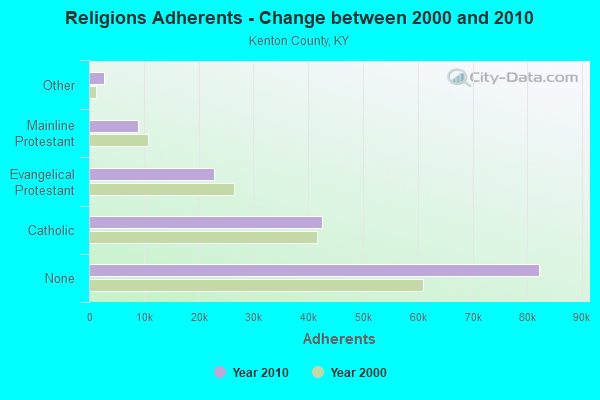
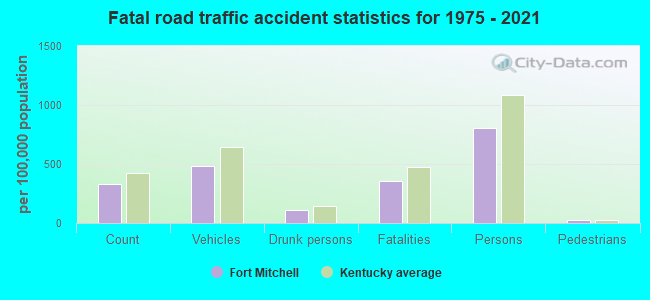
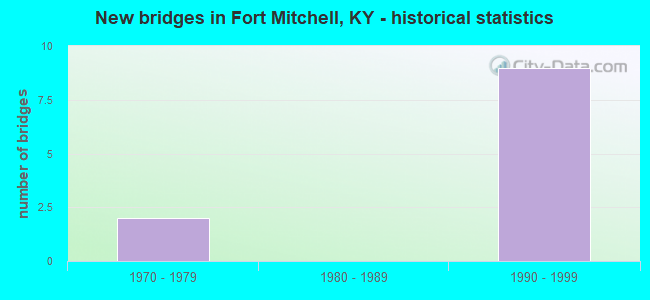
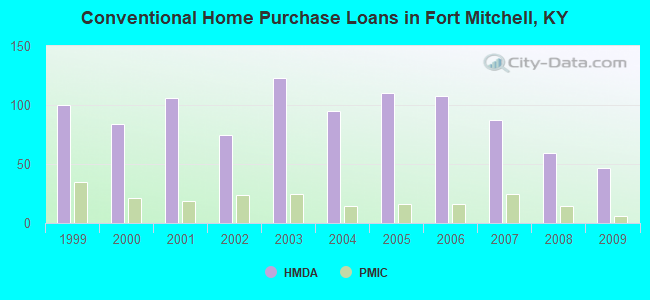
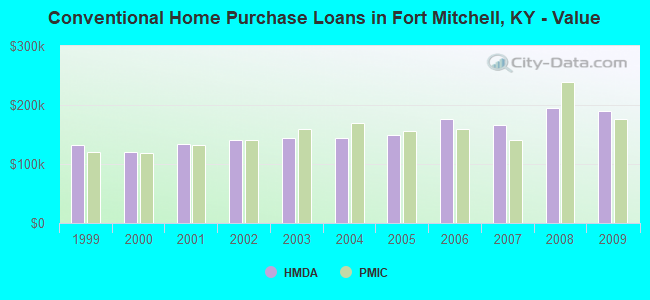
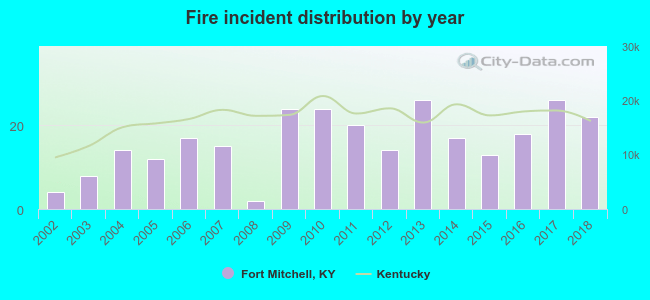 Based on the data from the years 2002 - 2018 the average number of fires per year is 16. The highest number of reported fire incidents - 26 took place in 2013, and the least - 2 in 2008. The data has a rising trend.
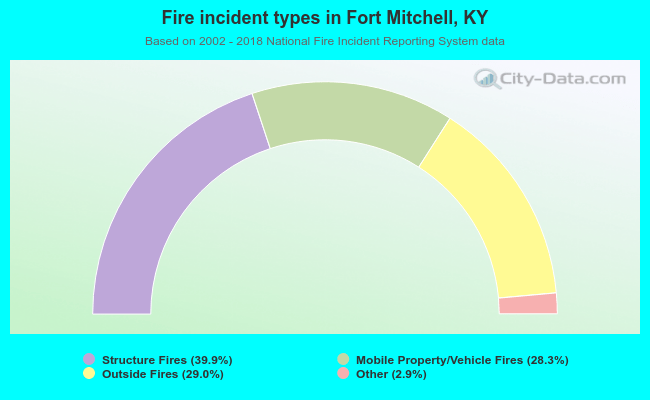 When looking into fire subcategories, the most incidents belonged to: Structure Fires (39.9%), and Outside Fires (29.0%).