Fort Mitchell: Fire Incidents, Kentucky (KY)
Where are fire incidents reported in Fort Mitchell, KY
Something went wrong! Please refresh the page.
|
| |||||||||||||||||||||||||||||||||||||||||||||||||||||||||||||||||||||||||||||||||||||||||||||||||||||||||||||
2002 - 2018 National Fire Incident Reporting System (NFIRS) incidents
- Incident types reported to NFIRS in Fort Mitchell, KY
- 98539.3%Rescue & EMS
- 55422.1%Hazardous Condition
- 27611.0%Fire
- 27310.9%Good Intent Call
- 2238.9%Service Call
- 1726.9%False Alarm
- 110.4%Severe Weather
- 80.3%Special Incident
- Fire incident types reported to NFIRS in Fort Mitchell, KY
- 11039.9%Structure Fires
- 8029.0%Outside Fires
- 7828.3%Mobile Property/Vehicle Fires
- 82.9%Other
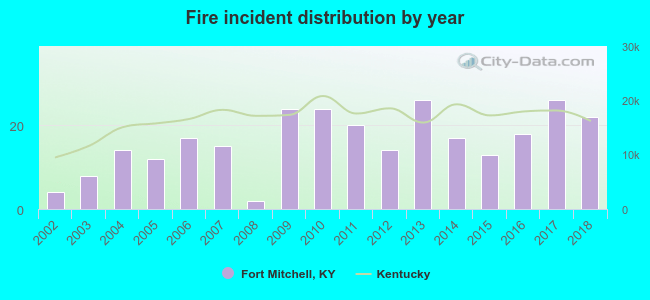 Based on the data from the years 2002 - 2018 the average number of fire incidents per year is 16. The highest number of fires - 26 took place in 2013, and the least - 2 in 2008. The data has a rising trend.
The average number of yearly fire incidents per 10k residents in Fort Mitchell, KY compared to nearest cities:
(Note: Based on data for the last 3 years, including only cities with population 5,000 and above)
| Fort Mitchell: | 26.6 |
| Fort Wright: | 20.3 |
| Villa Hills: | 16.2 |
| Edgewood: | 17.9 |
| Erlanger: | 44.2 |
| Covington: | 49.4 |
| Elsmere: | 33.3 |
| Taylor Mill: | 24.8 |
| Newport: | 44.7 |

 According to the data from the years 2002 - 2018 the average number of fire-related yearly casualties is 0. The highest number of injuries - 2 took place in 2018, and the lowest - 0 in 2002. The data has an increasing trend.
 28.3% incidents where reported in the morning and 71.7% in the evening. The most fires (15.6%) took place on Thursday, and the least (12.0%) on Saturday.
 Based on the 276 fires from years 2002 - 2018 most fires (12.7%) took place during November, and the least (4.7%) in December.
 Out of all 2,504 cases reported during the years 2002 - 2018, the most belonged to the categories: Rescue & EMS (39.3%), Hazardous Condition (22.1%), and Fire (11.0%).
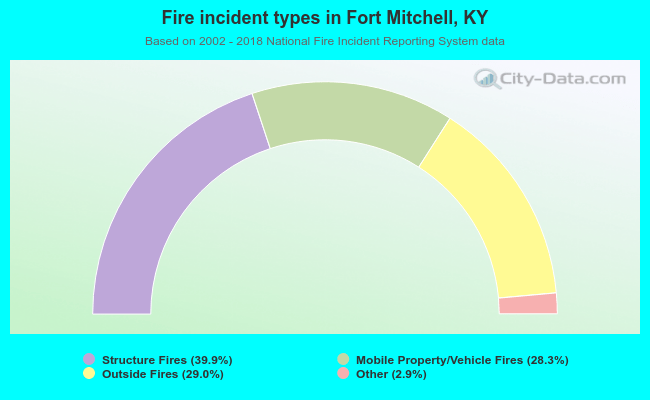 When looking into fire subcategories, the most reports belonged to: Structure Fires (39.9%), and Outside Fires (29.0%).