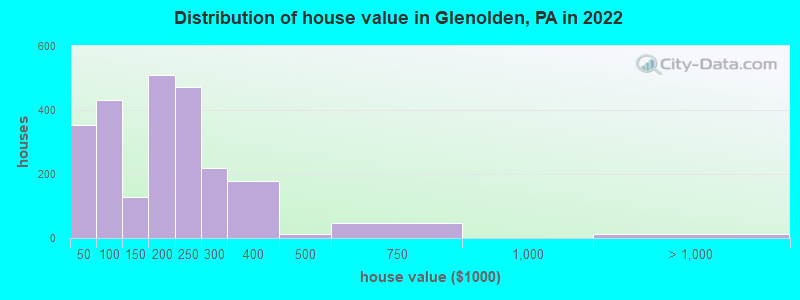
Estimated median house or condo value in 2022: $203,887 (it was $91,900 in 2000)
Glenolden:
$203,887
PA:
$245,500
Mean prices in 2022:all housing units: $238,719; detached houses: $296,711; townhouses or other attached units: $194,933; in 2-unit structures: $324,973; in 3-to-4-unit structures: $106,141; in 5-or-more-unit structures: $89,539
Median gross rent in 2022: $1,141.
March 2022 cost of living index in Glenolden: 102.8 (near average, U.S. average is 100)
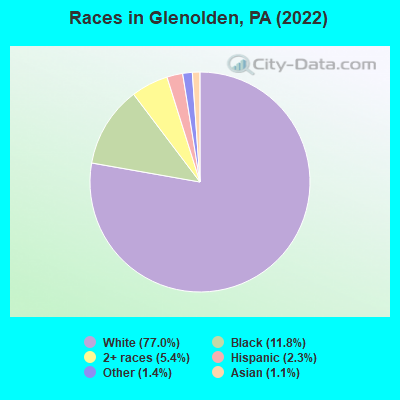
Percentage of residents living in poverty in 2022: 14.7%
(9.9% for White Non-Hispanic residents, 39.4% for Black residents, 43.9% for Hispanic or Latino residents, 43.4% for two or more races residents)
The City-Data.com crime index weighs serious crimes and violent crimes more heavily. Higher means more crime, U.S. average is 246.1. It adjusts for the number of visitors and daily workers commuting into cities.
Latest news from Glenolden, PA collected exclusively by city-data.com from local newspapers, TV, and radio stations
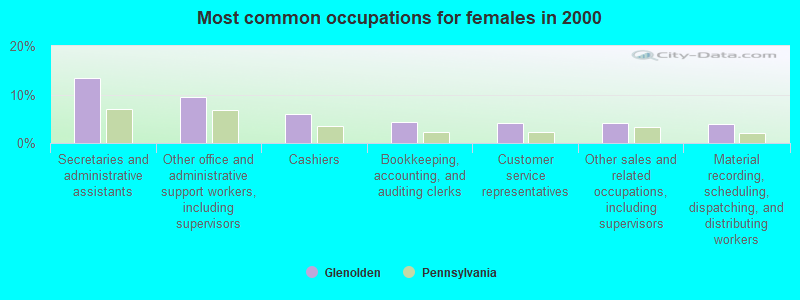
Ancestries: Irish (21.2%), Italian (18.4%), German (12.4%), American (5.5%), English (5.1%), Scotch-Irish (3.1%).
Current Local Time: EST time zone
Incorporated on 11/15/1894
Elevation: 100 feet
Land area: 0.97 square miles.
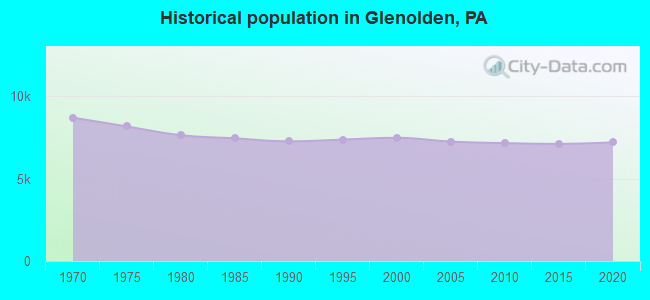
Population density: 7,357 people per square mile (high).
319 residents are foreign born (1.3% Latin America, 1.2% Asia, 1.0% Africa, 0.8% Europe).
This borough:
4.4%
Pennsylvania:
7.3%
Median real estate property taxes paid for housing units with mortgages in 2022: $5,303 (2.4%) Median real estate property taxes paid for housing units with no mortgage in 2022: $3,006 (3.1%)
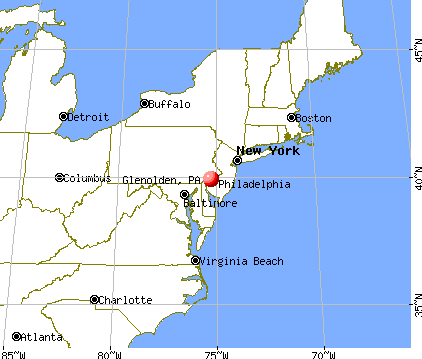
Nearest city with pop. 50,000+: Camden, NJ (10.2 miles , pop. 79,904).
Nearest city with pop. 200,000+: Philadelphia, PA (10.4 miles , pop. 1,517,550).
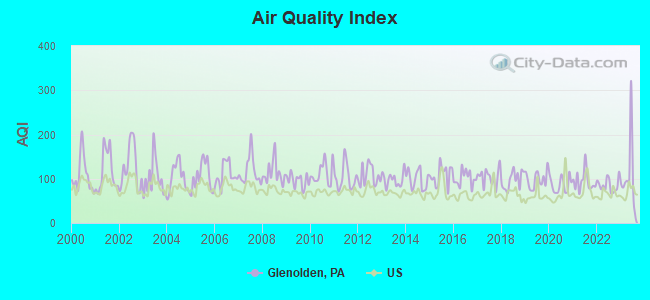
Air Quality Index (AQI) level in 2023 was 109. This is significantly worse than average.
City:
109
U.S.:
73
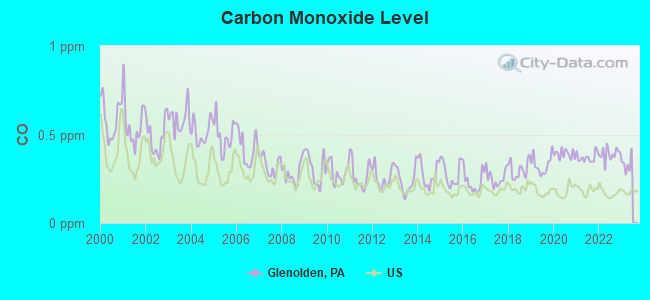
Carbon Monoxide (CO) [ppm] level in 2022 was 0.389. This is significantly worse than average.Closest monitor was 3.4 miles away from the city center.
City:
0.389
U.S.:
0.251
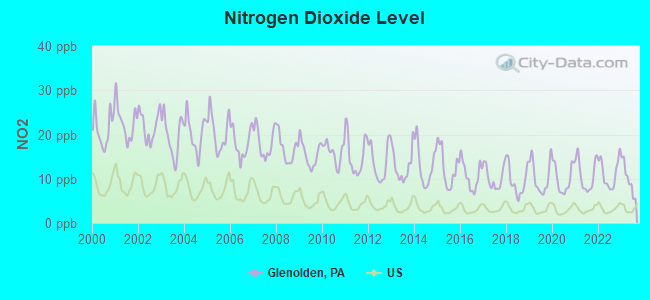
Nitrogen Dioxide (NO2) [ppb] level in 2023 was 9.99. This is significantly worse than average.Closest monitor was 5.7 miles away from the city center.
City:
9.99
U.S.:
5.11
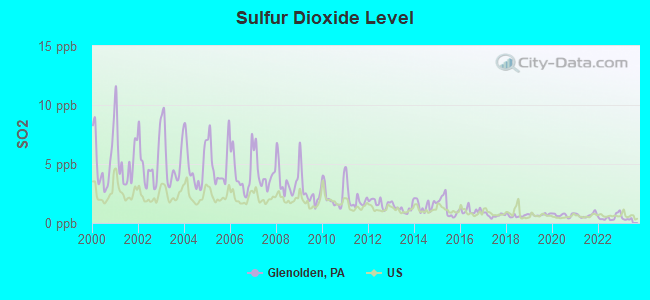
Sulfur Dioxide (SO2) [ppb] level in 2022 was 0.491. This is significantly better than average.Closest monitor was 1.1 miles away from the city center.
City:
0.491
U.S.:
1.515
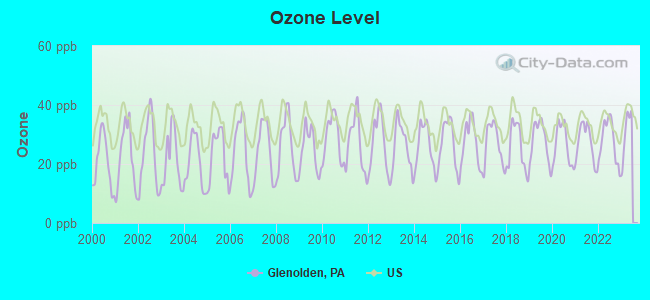
Ozone [ppb] level in 2022 was 27.8. This is about average.Closest monitor was 1.1 miles away from the city center.
City:
27.8
U.S.:
33.3
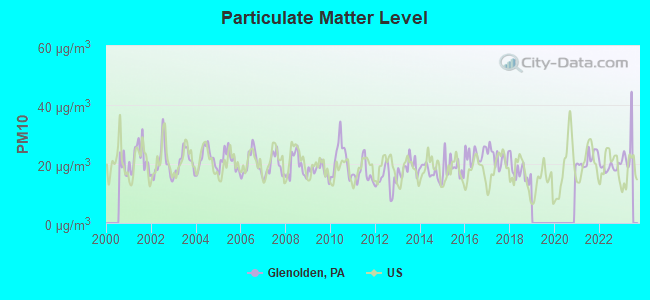
Particulate Matter (PM10) [µg/m3] level in 2022 was 18.9. This is about average.Closest monitor was 6.1 miles away from the city center.
City:
18.9
U.S.:
19.2
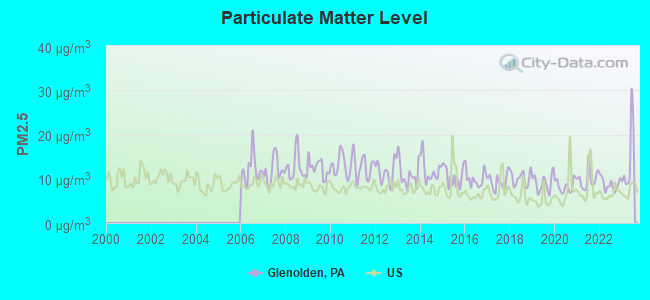
Particulate Matter (PM2.5) [µg/m3] level in 2023 was 14.4. This is significantly worse than average.Closest monitor was 2.8 miles away from the city center.
City:
14.4
U.S.:
8.1
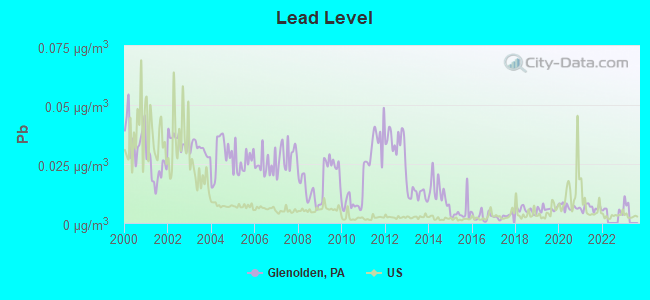
Lead (Pb) [µg/m3] level in 2021 was 0.00649. This is significantly better than average.Closest monitor was 0.8 miles away from the city center.
City:
0.00649
U.S.:
0.00931
Tornado activity:
Glenolden-area historical tornado activity is slightly above Pennsylvania state average. It is 1% greater than the overall U.S. average.
On 3/22/1955, a category F3 (max. wind speeds 158-206 mph) tornado 14.1 miles away from the Glenolden borough center killed one personand causedbetween $50,000 and $500,000 in damages.
On 4/28/1961, a category F3 tornado 21.6 miles away from the borough center causedbetween $5000 and $50,000 in damages.
Earthquake activity:
Glenolden-area historical earthquake activity is significantly above Pennsylvania state average. It is 65% smaller than the overall U.S. average.
On 8/23/2011 at 17:51:04, a magnitude 5.8 (5.8 MW, Depth: 3.7 mi, Class: Moderate, Intensity: VI - VII) earthquake occurred 197.9 miles away from the city center On 1/16/1994 at 01:49:16, a magnitude 4.6 (4.6 MB, 4.6 LG, Depth: 3.1 mi, Class: Light, Intensity: IV - V) earthquake occurred 49.4 miles away from Glenolden center On 1/16/1994 at 00:42:43, a magnitude 4.2 (4.2 MB, 4.0 LG, Depth: 3.1 mi) earthquake occurred 48.0 miles away from the city center On 10/7/1983 at 10:18:46, a magnitude 5.3 (5.1 MB, 5.3 LG, 5.1 ML) earthquake occurred 284.6 miles away from Glenolden center On 11/30/2017 at 21:47:31, a magnitude 4.1 (4.1 MW, Depth: 6.1 mi) earthquake occurred 49.1 miles away from the city center On 9/25/1998 at 19:52:52, a magnitude 5.2 (4.8 MB, 4.3 MS, 5.2 LG, 4.5 MW, Depth: 3.1 mi) earthquake occurred 289.4 miles away from the city center Magnitude types: regional Lg-wave magnitude (LG), body-wave magnitude (MB), local magnitude (ML), surface-wave magnitude (MS), moment magnitude (MW)
Natural disasters:
The number of natural disasters in Delaware County (21) is greater than the US average (15). Major Disasters (Presidential) Declared: 15 Emergencies Declared: 6
Causes of natural disasters: Hurricanes: 5, Floods: 4, Winter Storms: 4, Storms: 3, Tropical Storms: 3, Snowstorms: 2, Blizzard: 1, Snowfall: 1, Tropical Depression: 1, Water Shortage: 1, Other: 1 (Note: some incidents may be assigned to more than one category).
Hospitals and medical centers in Glenolden:
REDEEMER HOME HEALTH SERVICES, LLC (112 WEST OAK LANE)
Other hospitals and medical centers near Glenolden:
PROSPECT PARK HEALTH AND REHAB (Nursing Home, about 2 miles away; PROSPECT PARK, PA)
PROSPECT PARK NSG HOME (Nursing Home, about 2 miles away; PROSPECT PARK, PA)
LITTLE FLOWER MANOR (Nursing Home, about 2 miles away; DARBY, PA)
LITTLE FLOWER NRSG HM (Nursing Home, about 2 miles away; DARBY, PA)
CONNER-WILLIAMS NURSING HOME (Nursing Home, about 3 miles away; RIDLEY PARK, PA)
TAYLOR HOSPITAL (Hospital, about 3 miles away; RIDLEY PARK, PA)
TCC AT TAYLOR HOSPITAL (Nursing Home, about 3 miles away; RIDLEY PARK, PA)
Amtrak stations near Glenolden:
7 miles: PHILADELPHIA (30TH & MARKET STS.) . Services: ticket office, fully wheelchair accessible, enclosed waiting area, public restrooms, public payphones, snack bar, ATM, paid short-term parking, paid long-term parking, car rental agency, taxi stand, public transit connection.
8 miles: ARDMORE (STATION RD. & LANCASTER AVE.) . Services: enclosed waiting area, public restrooms, public payphones, paid short-term parking, call for car rental service, call for taxi service, public transit connection.
10 miles: NORTH PHILADELPHIA (PHILADELPHIA, 2900 N. BROAD ST.) . Services: ticket office, fully wheelchair accessible, enclosed waiting area, public restrooms, public payphones, paid short-term parking, paid long-term parking, call for taxi service, public transit connection.
Colleges/universities with over 2000 students nearest to Glenolden:
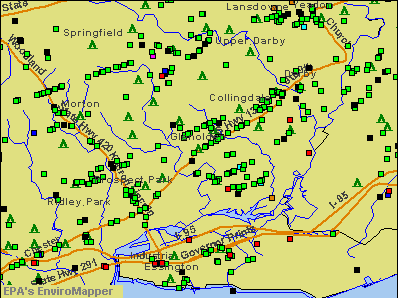
Notable locations in Glenolden: Glenolden Borough Hall (A), Glenolden Station (B), Glen Olden Station (C), Glenolden Fire Company 1 (D), Glenolden Library (E), Glenolden Police Department (F). Display/hide their locations on the map
Delaware County has a predicted average indoor radon screening level greater than 4 pCi/L (pico curies per liter) - Highest Potential
Average household size:
This borough:
2.4 people
Pennsylvania:
2.5 people
Percentage of family households:
This borough:
60.3%
Whole state:
65.0%
Percentage of households with unmarried partners:
This borough:
7.7%
Whole state:
6.6%
Likely homosexual households (counted as self-reported same-sex unmarried-partner households)
Lesbian couples: 0.3% of all households
Gay men: 0.3% of all households
2 people in other noninstitutional facilities in 2010
26 people in schools, hospitals, or wards for the intellectually disabled in 2000
6 people in religious group quarters in 2000
Banks with branches in Glenolden (2011 data):
Wells Fargo Bank, National Association: Glenolden at 6 N Macdade Blvd, branch established on 1998/04/01. Info updated 2011/04/05: Bank assets: $1,161,490.0 mil, Deposits: $905,653.0 mil, headquarters in Sioux Falls, SD, positive income, 6395 total offices, Holding Company: Wells Fargo & Company
Bank of America, National Association: Glenolden-Pathmark at 140 N. Macdade Blvd, branch established on 1998/08/24. Info updated 2009/11/18: Bank assets: $1,451,969.3 mil, Deposits: $1,077,176.8 mil, headquarters in Charlotte, NC, positive income, 5782 total offices, Holding Company: Bank Of America Corporation
Manufacturers and Traders Trust Company: Glenolden Branch at 300 Chester Pike, branch established on 1896/01/01. Info updated 2011/08/08: Bank assets: $76,887.1 mil, Deposits: $60,064.2 mil, headquarters in Buffalo, NY, positive income, Commercial Lending Specialization, 808 total offices, Holding Company: M&T Bank Corporation
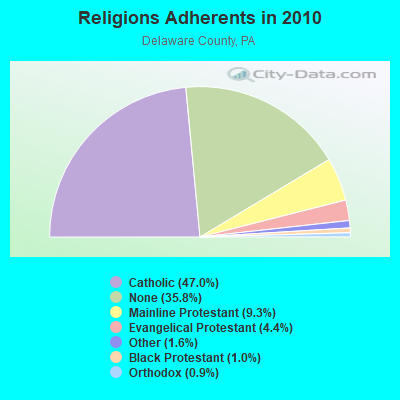
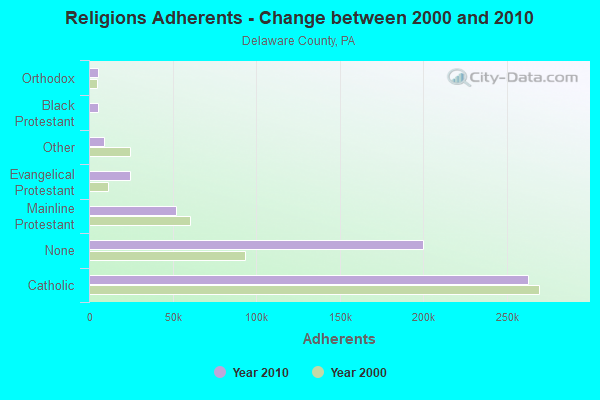
Religion statistics for Glenolden, PA (based on Delaware County data)
Religion
Adherents
Congregations
Catholic
262,506
50
Mainline Protestant
52,224
169
Evangelical Protestant
24,456
136
Other
9,009
27
Black Protestant
5,617
39
Orthodox
5,096
8
None
200,071
-
Source: Clifford Grammich, Kirk Hadaway, Richard Houseal, Dale E.Jones, Alexei Krindatch, Richie Stanley and Richard H.Taylor. 2012. 2010 U.S.Religion Census: Religious Congregations & Membership Study. Association of Statisticians of American Religious Bodies. Jones, Dale E., et al. 2002. Congregations and Membership in the United States 2000. Nashville, TN: Glenmary Research Center. Graphs represent county-level data
Aircraft: DJI MAVIC AIR (Category: Land, Engines: 4), Engine: Electric N-Number: 200GR, N200GR, N-200GR, Serial Number: OK1UF4F00E0095, Certificate Issue Date: 06/13/2019 Registrant (Individual): Joseph William Weiss, 476 S Andrews Ave, Glenolden, PA 19036 Deregistered:Cancel Date: 05/24/2013, Exported to: Korea Rep Of (S)
Home Mortgage Disclosure Act Aggregated Statistics For Year 2009 (Based on 2 full tracts)
A) FHA, FSA/RHS & VA Home Purchase Loans
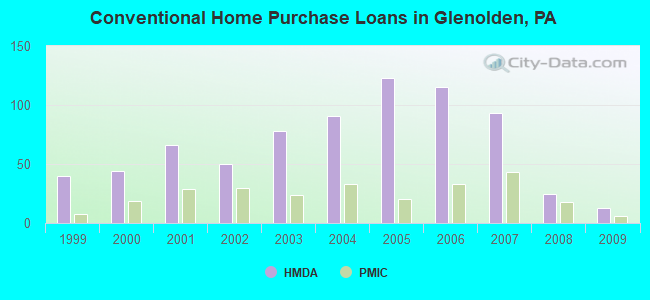
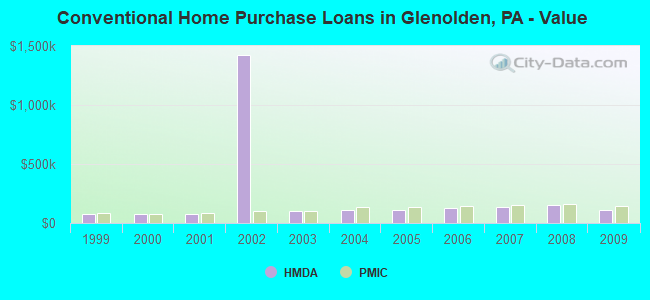
B) Conventional Home Purchase Loans
C) Refinancings
D) Home Improvement Loans
F) Non-occupant Loans on < 5 Family Dwellings (A B C & D)
Number
Average Value
Number
Average Value
Number
Average Value
Number
Average Value
Number
Average Value
LOANS ORIGINATED
46
$151,000
13
$113,538
99
$139,970
18
$34,389
6
$126,500
APPLICATIONS APPROVED, NOT ACCEPTED
3
$172,667
0
$0
10
$140,100
2
$50,500
0
$0
APPLICATIONS DENIED
4
$157,000
8
$156,625
63
$154,937
18
$36,722
7
$163,429
APPLICATIONS WITHDRAWN
0
$0
1
$162,000
31
$147,290
2
$22,500
0
$0
FILES CLOSED FOR INCOMPLETENESS
1
$147,000
1
$113,000
8
$128,000
1
$44,000
0
$0
Aggregated Statistics For Year 2008 (Based on 2 full tracts)
A) FHA, FSA/RHS & VA Home Purchase Loans
B) Conventional Home Purchase Loans
C) Refinancings
D) Home Improvement Loans
E) Loans on Dwellings For 5+ Families
F) Non-occupant Loans on < 5 Family Dwellings (A B C & D)
Number
Average Value
Number
Average Value
Number
Average Value
Number
Average Value
Number
Average Value
Number
Average Value
LOANS ORIGINATED
19
$146,632
25
$153,080
79
$128,418
34
$46,353
1
$133,000
11
$148,000
APPLICATIONS APPROVED, NOT ACCEPTED
0
$0
6
$140,500
12
$165,417
5
$55,200
0
$0
0
$0
APPLICATIONS DENIED
5
$154,800
7
$114,000
73
$143,671
29
$40,241
1
$217,000
5
$71,200
APPLICATIONS WITHDRAWN
3
$130,333
5
$116,200
27
$158,259
2
$8,000
0
$0
1
$83,000
FILES CLOSED FOR INCOMPLETENESS
3
$114,333
3
$113,667
12
$173,667
0
$0
0
$0
2
$93,500
Aggregated Statistics For Year 2007 (Based on 2 full tracts)
A) FHA, FSA/RHS & VA Home Purchase Loans
B) Conventional Home Purchase Loans
C) Refinancings
D) Home Improvement Loans
E) Loans on Dwellings For 5+ Families
F) Non-occupant Loans on < 5 Family Dwellings (A B C & D)
G) Loans On Manufactured Home Dwelling (A B C & D)
Number
Average Value
Number
Average Value
Number
Average Value
Number
Average Value
Number
Average Value
Number
Average Value
Number
Average Value
LOANS ORIGINATED
14
$167,500
93
$138,548
131
$124,534
60
$42,567
2
$650,000
17
$97,588
1
$35,000
APPLICATIONS APPROVED, NOT ACCEPTED
1
$68,000
10
$138,900
22
$122,591
10
$24,900
0
$0
2
$81,500
0
$0
APPLICATIONS DENIED
2
$126,500
26
$122,846
82
$139,646
26
$33,308
0
$0
7
$77,000
2
$64,500
APPLICATIONS WITHDRAWN
1
$199,000
9
$127,556
37
$148,189
3
$82,000
1
$209,000
2
$59,000
0
$0
FILES CLOSED FOR INCOMPLETENESS
1
$159,000
4
$109,250
14
$139,643
0
$0
0
$0
0
$0
0
$0
Aggregated Statistics For Year 2006 (Based on 2 full tracts)
A) FHA, FSA/RHS & VA Home Purchase Loans
B) Conventional Home Purchase Loans
C) Refinancings
D) Home Improvement Loans
E) Loans on Dwellings For 5+ Families
F) Non-occupant Loans on < 5 Family Dwellings (A B C & D)
G) Loans On Manufactured Home Dwelling (A B C & D)
Number
Average Value
Number
Average Value
Number
Average Value
Number
Average Value
Number
Average Value
Number
Average Value
Number
Average Value
LOANS ORIGINATED
7
$173,714
115
$126,165
162
$110,586
55
$38,509
1
$270,000
20
$100,150
1
$3,000
APPLICATIONS APPROVED, NOT ACCEPTED
1
$161,000
13
$143,000
36
$109,333
15
$68,467
0
$0
7
$108,714
0
$0
APPLICATIONS DENIED
0
$0
12
$146,833
126
$123,357
43
$39,372
1
$118,000
13
$37,846
3
$15,667
APPLICATIONS WITHDRAWN
1
$184,000
18
$141,556
65
$120,708
2
$31,000
0
$0
2
$96,500
0
$0
FILES CLOSED FOR INCOMPLETENESS
0
$0
3
$121,333
16
$138,250
1
$25,000
0
$0
0
$0
0
$0
Aggregated Statistics For Year 2005 (Based on 2 full tracts)
A) FHA, FSA/RHS & VA Home Purchase Loans
B) Conventional Home Purchase Loans
C) Refinancings
D) Home Improvement Loans
E) Loans on Dwellings For 5+ Families
F) Non-occupant Loans on < 5 Family Dwellings (A B C & D)
G) Loans On Manufactured Home Dwelling (A B C & D)
Number
Average Value
Number
Average Value
Number
Average Value
Number
Average Value
Number
Average Value
Number
Average Value
Number
Average Value
LOANS ORIGINATED
13
$141,846
123
$110,789
175
$110,051
55
$36,200
1
$230,000
24
$98,500
0
$0
APPLICATIONS APPROVED, NOT ACCEPTED
0
$0
11
$104,727
42
$99,810
8
$25,500
0
$0
4
$118,000
1
$50,000
APPLICATIONS DENIED
0
$0
16
$108,000
104
$124,433
60
$32,817
0
$0
13
$27,077
1
$7,000
APPLICATIONS WITHDRAWN
0
$0
19
$124,474
84
$128,048
20
$136,750
0
$0
3
$117,333
0
$0
FILES CLOSED FOR INCOMPLETENESS
0
$0
5
$119,200
25
$131,600
1
$30,000
0
$0
3
$112,000
0
$0
Aggregated Statistics For Year 2004 (Based on 2 full tracts)
A) FHA, FSA/RHS & VA Home Purchase Loans
B) Conventional Home Purchase Loans
C) Refinancings
D) Home Improvement Loans
E) Loans on Dwellings For 5+ Families
F) Non-occupant Loans on < 5 Family Dwellings (A B C & D)
G) Loans On Manufactured Home Dwelling (A B C & D)
Number
Average Value
Number
Average Value
Number
Average Value
Number
Average Value
Number
Average Value
Number
Average Value
Number
Average Value
LOANS ORIGINATED
16
$135,875
91
$107,253
205
$98,541
41
$36,512
2
$1,479,000
23
$78,522
0
$0
APPLICATIONS APPROVED, NOT ACCEPTED
1
$177,000
7
$86,286
43
$88,256
9
$28,000
0
$0
4
$51,750
0
$0
APPLICATIONS DENIED
2
$78,500
22
$113,818
122
$96,844
55
$34,964
0
$0
18
$29,111
1
$10,000
APPLICATIONS WITHDRAWN
3
$110,667
12
$127,750
72
$105,153
9
$115,444
0
$0
2
$53,000
0
$0
FILES CLOSED FOR INCOMPLETENESS
0
$0
2
$125,000
48
$111,917
2
$50,000
0
$0
1
$108,000
0
$0
Aggregated Statistics For Year 2003 (Based on 2 full tracts)
A) FHA, FSA/RHS & VA Home Purchase Loans
B) Conventional Home Purchase Loans
C) Refinancings
D) Home Improvement Loans
E) Loans on Dwellings For 5+ Families
F) Non-occupant Loans on < 5 Family Dwellings (A B C & D)
Number
Average Value
Number
Average Value
Number
Average Value
Number
Average Value
Number
Average Value
Number
Average Value
LOANS ORIGINATED
36
$110,722
78
$99,436
322
$89,174
35
$46,286
0
$0
22
$71,091
APPLICATIONS APPROVED, NOT ACCEPTED
1
$31,000
9
$121,778
63
$88,476
10
$27,800
0
$0
2
$63,000
APPLICATIONS DENIED
1
$114,000
11
$80,636
147
$98,626
31
$23,387
0
$0
8
$55,625
APPLICATIONS WITHDRAWN
1
$184,000
7
$107,571
75
$93,840
7
$57,286
1
$65,000
2
$47,000
FILES CLOSED FOR INCOMPLETENESS
2
$104,000
2
$132,000
16
$102,688
6
$38,833
0
$0
1
$57,000
Aggregated Statistics For Year 2002 (Based on 2 full tracts)
A) FHA, FSA/RHS & VA Home Purchase Loans
B) Conventional Home Purchase Loans
C) Refinancings
D) Home Improvement Loans
E) Loans on Dwellings For 5+ Families
F) Non-occupant Loans on < 5 Family Dwellings (A B C & D)
Number
Average Value
Number
Average Value
Number
Average Value
Number
Average Value
Number
Average Value
Number
Average Value
LOANS ORIGINATED
22
$3,829,409
50
$1,425,120
146
$732,548
37
$26,216
1
$680,000
15
$6,392,533
APPLICATIONS APPROVED, NOT ACCEPTED
2
$104,500
6
$80,167
52
$89,135
11
$28,818
0
$0
0
$0
APPLICATIONS DENIED
1
$96,000
13
$53,385
115
$85,139
30
$19,533
0
$0
4
$43,000
APPLICATIONS WITHDRAWN
1
$114,000
3
$96,000
35
$501,857
6
$17,333
0
$0
0
$0
FILES CLOSED FOR INCOMPLETENESS
0
$0
2
$109,500
24
$87,500
1
$30,000
0
$0
1
$33,000
Aggregated Statistics For Year 2001 (Based on 2 full tracts)
A) FHA, FSA/RHS & VA Home Purchase Loans
B) Conventional Home Purchase Loans
C) Refinancings
D) Home Improvement Loans
E) Loans on Dwellings For 5+ Families
F) Non-occupant Loans on < 5 Family Dwellings (A B C & D)
Number
Average Value
Number
Average Value
Number
Average Value
Number
Average Value
Number
Average Value
Number
Average Value
LOANS ORIGINATED
28
$89,107
66
$77,212
123
$80,057
31
$18,161
3
$726,667
10
$58,100
APPLICATIONS APPROVED, NOT ACCEPTED
0
$0
5
$81,400
30
$71,433
10
$24,200
0
$0
2
$44,500
APPLICATIONS DENIED
2
$120,000
4
$44,500
72
$67,528
34
$22,324
0
$0
2
$30,000
APPLICATIONS WITHDRAWN
1
$64,000
6
$64,333
33
$60,970
5
$33,000
0
$0
2
$66,500
FILES CLOSED FOR INCOMPLETENESS
1
$78,000
1
$52,000
15
$81,200
1
$70,000
0
$0
2
$42,500
Aggregated Statistics For Year 2000 (Based on 2 full tracts)
A) FHA, FSA/RHS & VA Home Purchase Loans
B) Conventional Home Purchase Loans
C) Refinancings
D) Home Improvement Loans
F) Non-occupant Loans on < 5 Family Dwellings (A B C & D)
Number
Average Value
Number
Average Value
Number
Average Value
Number
Average Value
Number
Average Value
LOANS ORIGINATED
30
$83,267
44
$75,841
47
$62,021
37
$22,486
3
$43,333
APPLICATIONS APPROVED, NOT ACCEPTED
1
$109,000
6
$88,000
18
$53,722
7
$22,286
1
$33,000
APPLICATIONS DENIED
1
$29,000
15
$59,600
42
$59,262
20
$13,150
4
$52,250
APPLICATIONS WITHDRAWN
3
$74,000
12
$71,417
40
$85,250
5
$45,800
1
$93,000
FILES CLOSED FOR INCOMPLETENESS
0
$0
1
$81,000
4
$94,000
0
$0
0
$0
Aggregated Statistics For Year 1999 (Based on 2 full tracts)
A) FHA, FSA/RHS & VA Home Purchase Loans
B) Conventional Home Purchase Loans
C) Refinancings
D) Home Improvement Loans
E) Loans on Dwellings For 5+ Families
F) Non-occupant Loans on < 5 Family Dwellings (A B C & D)
Detailed PMIC statistics for the following Tracts:4035.01
, 4035.02
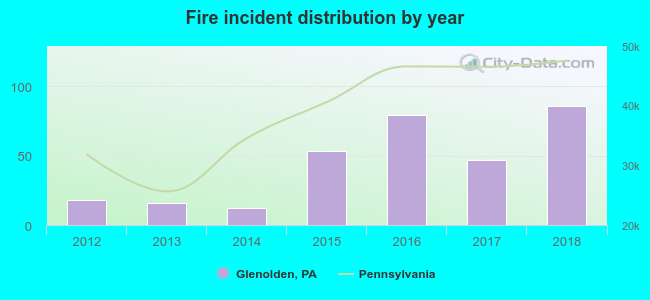
2012 - 2018 National Fire Incident Reporting System (NFIRS) incidents
Based on the data from the years 2012 - 2018 the average number of fire incidents per year is 44. The highest number of reported fires - 86 took place in 2018, and the least - 12 in 2014. The data has a rising trend.
When looking into fire subcategories, the most reports belonged to: Structure Fires (77.0%), and Other (10.5%).
Fire incident types reported to NFIRS in Glenolden, PA
#49 on the list of "Top 101 cities with the most residents born in Iran (population 500+)"
#94 on the list of "Top 101 cities with the lowest percentage of workers working at home, population 5,000+"
#20 (19036) on the list of "Top 101 zip codes with the largest percentage of Irish first ancestries (pop 5,000+)"
#14 on the list of "Top 101 counties with the lowest ground withdrawal of fresh water for public supply (pop. 50,000+)"
#16 on the list of "Top 101 counties with the largest increase in the number of infant deaths per 1000 residents 2000-2006 to 2007-2013 (pop. 50,000+)"
#20 on the list of "Top 101 counties with the highest Particulate Matter (PM2.5) Annual air pollution readings in 2012 (µg/m3)"
#40 on the list of "Top 101 counties with the most Mainline Protestant congregations"
#46 on the list of "Top 101 counties with the highest number of infant deaths per 1000 residents 2007-2013 (pop. 50,000+)"


 Recent articles from our blog. Our writers, many of them Ph.D. graduates or candidates, create easy-to-read articles on a wide variety of topics.

 (10.2 miles
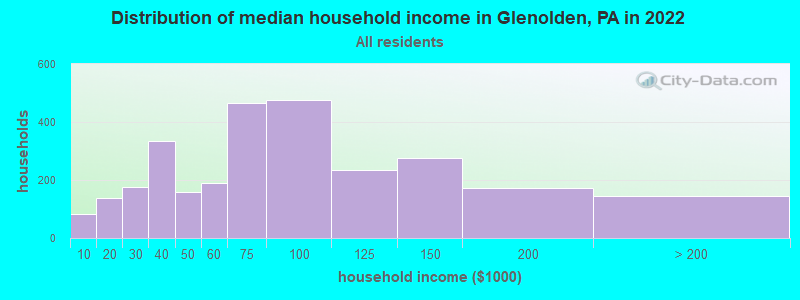

 Based on the data from the years 2012 - 2018 the average number of fire incidents per year is 44. The highest number of reported fires - 86 took place in 2018, and the least - 12 in 2014. The data has a rising trend.
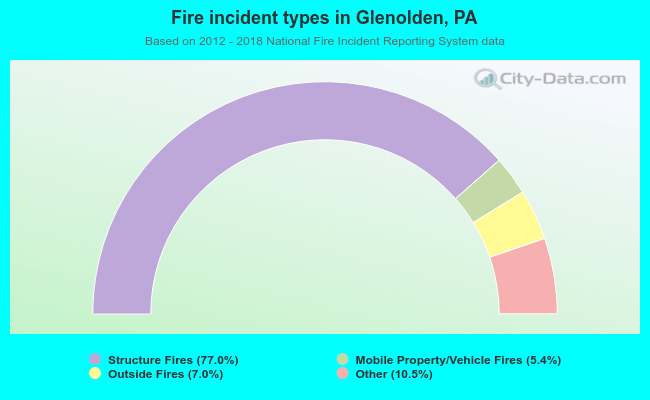 When looking into fire subcategories, the most reports belonged to: Structure Fires (77.0%), and Other (10.5%).