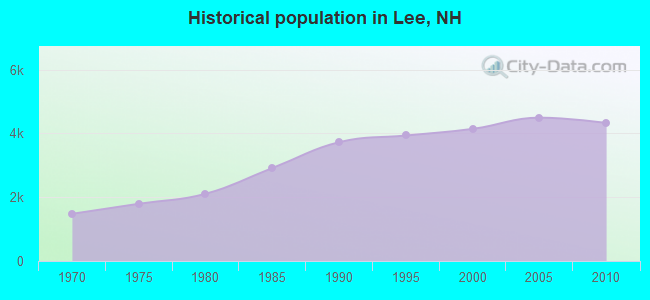
Lee, New Hampshire
Submit your own pictures of this town and show them to the world
- OSM Map
- General Map
- Google Map
- MSN Map
Population change since 2000: +4.5%
 |
| Males: 2,190 | |
| Females: 2,140 |
| Median resident age: | 41.0 years |
| New Hampshire median age: | 43.9 years |
Zip codes: 03824.
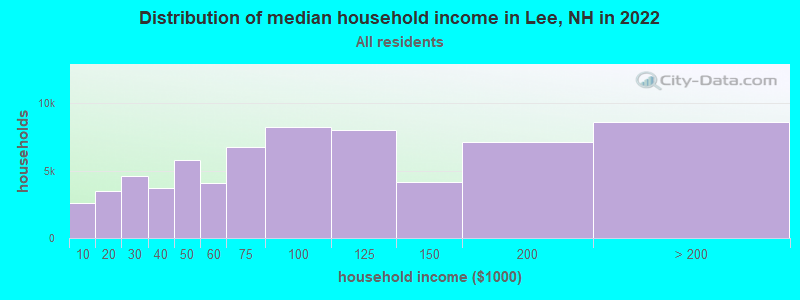
| Lee: | $107,589 |
| NH: | $89,992 |
Estimated per capita income in 2022: $51,870 (it was $23,905 in 2000)
Lee town income, earnings, and wages data
Estimated median house or condo value in 2022: $503,900 (it was $162,600 in 2000)
| Lee: | $503,900 |
| NH: | $384,700 |
Mean prices in 2022: all housing units: $372,213; detached houses: $404,882; townhouses or other attached units: $390,591; in 2-unit structures: $310,268; in 3-to-4-unit structures: $385,130; in 5-or-more-unit structures: $243,262; mobile homes: $123,219
Detailed information about poverty and poor residents in Lee, NH


Compare current foreclosures near Lee, NH:
| Photo | Address | Area | Beds / Baths | Price | Details |
|---|---|---|---|---|---|

|
#1
Brentwood Rd
Exeter, NH 03833
|
2,756 sq. feet
|
2 baths 3 beds |
$419,900
|
show details |

|
#2
Fernald Ln
Lee, NH 03861
|
- sq. feet
|
- baths - beds |
show details | |

|
#3
Davis Ln
Lee, NH 03861
|
- sq. feet
|
- baths - beds |
show details | |

|
#4
Old Turnpike Rd
Nottingham, NH 03290
|
4,738 sq. feet
|
3 baths 3 beds |
show details | |

|
#5
Woodlawn Cir
Portsmouth, NH 03801
|
1,306 sq. feet
|
2 baths 4 beds |
show details | |

|
#6
Laura Dr
Rochester, NH 03867
|
1,674 sq. feet
|
3 baths 3 beds |
show details | |

|
#7
High St
Exeter, NH 03833
|
3,075 sq. feet
|
3 baths 4 beds |
show details | |

|
#8
Hobart St
Rochester, NH 03867
|
1,204 sq. feet
|
1 baths 4 beds |
show details | |

|
#9
Smoke St
Nottingham, NH 03290
|
2,396 sq. feet
|
3 baths 3 beds |
show details | |

|
#10
Jonathan Ave
Rochester, NH 03839
|
1,130 sq. feet
|
1 baths 2 beds |
show details |
| Photo | Address | Area | Beds / Baths | Price | Details |
|---|---|---|---|---|---|

|
#11
Cote Cir
Raymond, NH 03077
|
2,024 sq. feet
|
2 baths 3 beds |
show details | |

|
#12
Plum St
Exeter, NH 03833
|
924 sq. feet
|
1 baths 3 beds |
show details | |

|
#13
Roller Coaster Rd
Strafford, NH 03884
|
2,530 sq. feet
|
3 baths 6 beds |
show details | |

|
#14
1st Nh Tpke
Northwood, NH 03261
|
3,778 sq. feet
|
2 baths 6 beds |
show details | |

|
#15
Twin Fawn Run
Chester, NH 03036
|
2,046 sq. feet
|
1 baths 3 beds |
show details | |

|
#16
Mildred Ave
Raymond, NH 03077
|
756 sq. feet
|
2 baths 2 beds |
show details | |

|
#17
Ernest Ave Apt 4
Exeter, NH 03833
|
555 sq. feet
|
1 baths 1 beds |
show details | |

|
#18
Alder St
Exeter, NH 03833
|
952 sq. feet
|
2 baths 2 beds |
show details | |

|
#19
Harvard St
Exeter, NH 03833
|
1,509 sq. feet
|
1 baths 3 beds |
show details | |

|
#20
Louise Ln
Fremont, NH 03044
|
1,960 sq. feet
|
2 baths 3 beds |
show details |
| Photo | Address | Area | Beds / Baths | Price | Details |
|---|---|---|---|---|---|

|
#21
Brentwood Rd
Exeter, NH 03833
|
3,683 sq. feet
|
3 baths 4 beds |
show details | |

|
#22
Middle Rd
Dover, NH 03820
|
1,120 sq. feet
|
1 baths 3 beds |
show details | |

|
#23
Denmark Dr
Northwood, NH 03261
|
1,809 sq. feet
|
2 baths 3 beds |
show details | |

|
#24
Northam Dr
Dover, NH 03820
|
1,999 sq. feet
|
2 baths 3 beds |
show details | |

|
#25
Back River Rd
Dover, NH 03820
|
1,193 sq. feet
|
1 baths 3 beds |
show details | |

|
#26
Chapel St
Dover, NH 03820
|
1,872 sq. feet
|
2 baths 4 beds |
show details | |

|
#27
Dowaliby Ct
Dover, NH 03820
|
1,273 sq. feet
|
1 baths 3 beds |
show details | |

|
#28
Frost Hill Rd, C O Gregory Jackman
Eliot, ME 03903
|
3,472 sq. feet
|
3 baths 4 beds |
show details | |

|
#29
Fiddlehead Ln
Chester, NH 03036
|
2,682 sq. feet
|
2 baths 4 beds |
show details | |

|
#30
Langs Ln
Newmarket, NH 03857
|
2,466 sq. feet
|
2 baths 3 beds |
show details |
| Photo | Address | Area | Beds / Baths | Price | Details |
|---|---|---|---|---|---|

|
#31
Adams Park
Rye, NH 03870
|
1,008 sq. feet
|
2 baths 3 beds |
show details | |

|
#32
Blake Rd
Epping, NH 03042
|
3,113 sq. feet
|
2 baths 2 beds |
show details | |

|
#33
Piscassic St
Newmarket, NH 03857
|
1,608 sq. feet
|
2 baths 4 beds |
show details | |

|
#34
Wentworth Ter
Dover, NH 03820
|
2,404 sq. feet
|
3 baths 6 beds |
show details | |

|
#35
Cedar Point Rd
Durham, NH 03824
|
4,052 sq. feet
|
3 baths 3 beds |
show details | |

|
#36
Dearborn Rd
Epping, NH 03042
|
1,768 sq. feet
|
2 baths 3 beds |
show details | |

|
#37
Windbrook Dr
Epping, NH 03042
|
1,680 sq. feet
|
1 baths 2 beds |
show details | |

|
#38
Pond St
Newton, NH 03858
|
- sq. feet
|
2 baths 3 beds |
show details | |

|
#39
Keay Rd
Berwick, ME 03901
|
2,556 sq. feet
|
2 baths - beds |
show details | |

|
#40
Thurston Pond Rd
Deerfield, NH 03037
|
- sq. feet
|
2 baths 3 beds |
show details |
| Photo | Address | Area | Beds / Baths | Price | Details |
|---|---|---|---|---|---|

|
#41
Pine Hill Rd
Berwick, ME 03901
|
2,882 sq. feet
|
2 baths - beds |
show details | |

|
#42
Sagamore Ave # 13
Portsmouth, NH 03801
|
- sq. feet
|
- baths - beds |
show details | |

|
#43
Route 236 Apt F4
Berwick, ME 03901
|
- sq. feet
|
- baths - beds |
show details | |

|
#44
Freedom Cir Apt 30
Portsmouth, NH 03801
|
- sq. feet
|
- baths - beds |
show details | |

|
#45
White Cedar Blvd
Portsmouth, NH 03801
|
- sq. feet
|
- baths - beds |
show details | |

|
#46
Beach Rose Ln
North Hampton, NH 03862
|
- sq. feet
|
- baths - beds |
show details | |

|
#47
Drakeside Rd Unit 1302
Hampton, NH 03842
|
- sq. feet
|
- baths - beds |
show details | |

|
#48
Blakes Hill Rd
Northwood, NH 03261
|
- sq. feet
|
- baths - beds |
show details | |

|
#49
Clayton Ln
Kittery, ME 03904
|
- sq. feet
|
- baths - beds |
show details | |

|
Check over 1 million property listings on Foreclosure.com!
|
browse all offers | |||

- 4,01492.7%White alone
- 1272.9%Asian alone
- 731.7%Two or more races
- 701.6%Hispanic
- 340.8%Black alone
- 80.2%Other race alone
- 30.07%American Indian alone
- 10.02%Native Hawaiian and Other
Pacific Islander alone
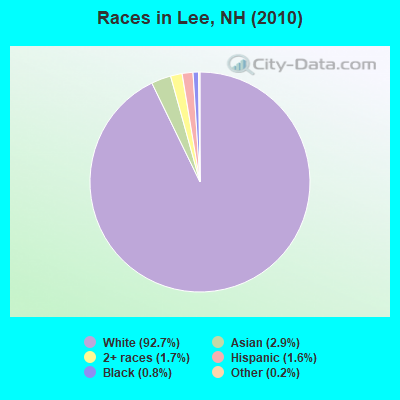
Races in Lee detailed stats: ancestries, foreign born residents, place of birth
According to our research of New Hampshire and other state lists, there were 5 registered sex offenders living in Lee, New Hampshire as of May 17, 2024.
The ratio of all residents to sex offenders in Lee is 866 to 1.
The ratio of registered sex offenders to all residents in this city is lower than the state average.
Type |
2009 |
2010 |
2011 |
2012 |
2013 |
2014 |
2015 |
2016 |
2017 |
2018 |
2019 |
2020 |
2021 |
2022 |
|---|---|---|---|---|---|---|---|---|---|---|---|---|---|---|
| Murders (per 100,000) | 0 (0.0) | 0 (0.0) | 0 (0.0) | 0 (0.0) | 0 (0.0) | 0 (0.0) | 0 (0.0) | 0 (0.0) | 0 (0.0) | 0 (0.0) | 0 (0.0) | 0 (0.0) | 0 (0.0) | 0 (0.0) |
| Rapes (per 100,000) | 0 (0.0) | 0 (0.0) | 0 (0.0) | 0 (0.0) | 2 (46.0) | 0 (0.0) | 1 (22.7) | 0 (0.0) | 1 (22.6) | 0 (0.0) | 1 (22.3) | 2 (43.5) | 0 (0.0) | 1 (21.6) |
| Robberies (per 100,000) | 1 (22.2) | 1 (23.1) | 1 (23.1) | 0 (0.0) | 1 (23.0) | 0 (0.0) | 0 (0.0) | 0 (0.0) | 2 (45.3) | 0 (0.0) | 0 (0.0) | 0 (0.0) | 0 (0.0) | 1 (21.6) |
| Assaults (per 100,000) | 2 (44.5) | 0 (0.0) | 0 (0.0) | 3 (68.7) | 5 (115.1) | 1 (22.9) | 1 (22.7) | 1 (22.7) | 4 (90.6) | 3 (67.6) | 0 (0.0) | 1 (21.7) | 1 (21.3) | 0 (0.0) |
| Burglaries (per 100,000) | 4 (89.0) | 9 (207.9) | 10 (230.6) | 5 (114.5) | 10 (230.1) | 11 (251.5) | 5 (113.4) | 9 (204.4) | 3 (67.9) | 4 (90.2) | 1 (22.3) | 2 (43.5) | 0 (0.0) | 0 (0.0) |
| Thefts (per 100,000) | 36 (800.9) | 32 (739.0) | 26 (599.6) | 26 (595.5) | 15 (345.2) | 27 (617.3) | 22 (498.9) | 35 (794.9) | 22 (498.1) | 15 (338.2) | 14 (311.5) | 24 (521.6) | 20 (427.0) | 24 (517.9) |
| Auto thefts (per 100,000) | 1 (22.2) | 2 (46.2) | 2 (46.1) | 2 (45.8) | 1 (23.0) | 1 (22.9) | 2 (45.4) | 0 (0.0) | 0 (0.0) | 0 (0.0) | 2 (44.5) | 2 (43.5) | 1 (21.3) | 2 (43.2) |
| Arson (per 100,000) | 0 (0.0) | 1 (23.1) | 0 (0.0) | 1 (22.9) | 1 (23.0) | 0 (0.0) | 0 (0.0) | 0 (0.0) | 0 (0.0) | 0 (0.0) | 1 (22.3) | 1 (21.7) | 0 (0.0) | 0 (0.0) |
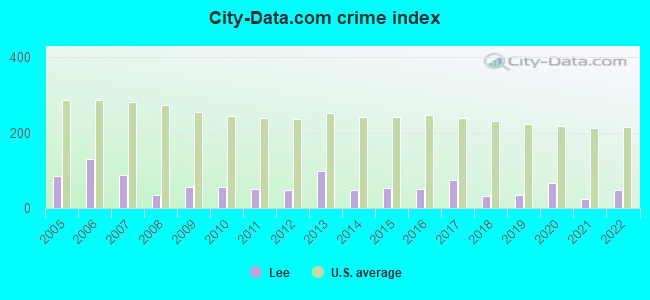
| City-Data.com crime index | 55.6 | 54.7 | 50.7 | 49.2 | 98.5 | 48.7 | 54.2 | 50.6 | 74.5 | 33.4 | 35.4 | 66.5 | 23.1 | 47.9 |
The City-Data.com crime index weighs serious crimes and violent crimes more heavily. Higher means more crime, U.S. average is 246.1. It adjusts for the number of visitors and daily workers commuting into cities.
Crime rate in Lee detailed stats: murders, rapes, robberies, assaults, burglaries, thefts, arson
Full-time law enforcement employees in 2021, including police officers: 10 (9 officers - 7 male; 2 female).
| Officers per 1,000 residents here: | 1.92 |
| New Hampshire average: | 2.14 |
 Recent articles from our blog. Our writers, many of them Ph.D. graduates or candidates, create easy-to-read articles on a wide variety of topics.

 | Durham, Lee, & Madbury; similarities & differences. (17 replies) |
| Yet Another Guy Looking to Relocate to Southern NH (27 replies) |
| Neighborhood Help ... Near Portsmouth (6 replies) |
| Moving from Va to NH looking for some advice :) (32 replies) |
| Lee area (0 replies) |
| Moving to New Hampshire (Lebanon, Hanover, Keene, Grantham, Plainfield, Enfield, Etna) (38 replies) |
Latest news from Lee, NH collected exclusively by city-data.com from local newspapers, TV, and radio stations
Ancestries: English (24.0%), Irish (17.9%), French (13.0%), German (9.7%), United States (6.6%), Italian (6.1%).
Current Local Time: EST time zone
Incorporated in 1766
Elevation: 189 feet
Land area: 19.9 square miles.
Population density: 217 people per square mile (very low).
244 residents are foreign born (2.7% Asia, 2.0% Europe, 0.7% Latin America).
| This town: | 5.9% |
| New Hampshire: | 4.4% |
| Lee town: | 2.7% ($4,415) |
| New Hampshire: | 2.3% ($2,946) |
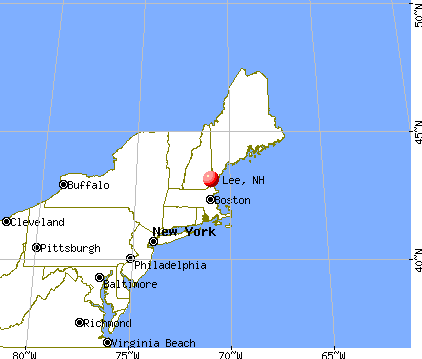
Nearest city with pop. 50,000+: Haverhill, MA  (23.9 miles , pop. 58,969).
Nearest city with pop. 200,000+: Boston, MA (55.4 miles , pop. 589,141).
Nearest city with pop. 1,000,000+: Bronx, NY (215.4 miles , pop. 1,332,650).
Nearest cities:
), ), ), ), Latitude: 43.12 N, Longitude: 71.01 W
Area code commonly used in this area: 603

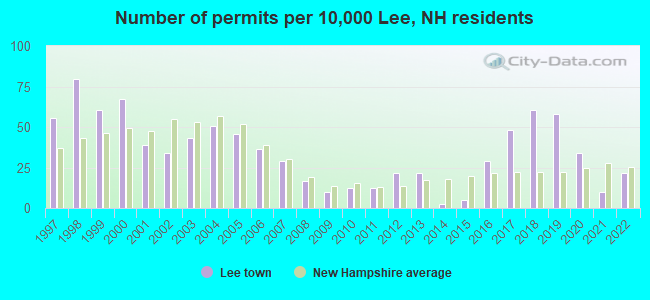
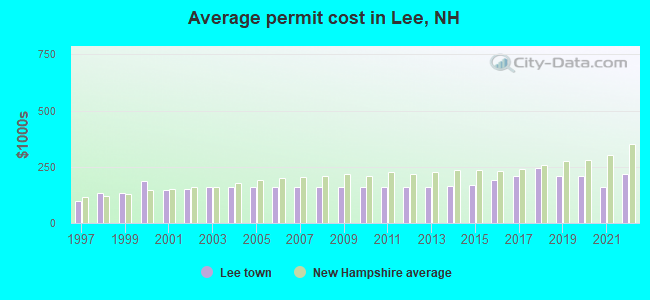
Single-family new house construction building permits:
- 2022: 9 buildings, average cost: $219,100
- 2021: 4 buildings, average cost: $160,800
- 2020: 14 buildings, average cost: $206,500
- 2019: 24 buildings, average cost: $211,400
- 2018: 25 buildings, average cost: $242,800
- 2017: 20 buildings, average cost: $209,000
- 2016: 12 buildings, average cost: $192,700
- 2015: 2 buildings, average cost: $170,000
- 2014: 1 building, cost: $165,000
- 2013: 9 buildings, average cost: $159,900
- 2012: 9 buildings, average cost: $159,900
- 2011: 5 buildings, average cost: $159,900
- 2010: 5 buildings, average cost: $159,900
- 2009: 4 buildings, average cost: $159,900
- 2008: 7 buildings, average cost: $159,900
- 2007: 12 buildings, average cost: $159,900
- 2006: 15 buildings, average cost: $159,900
- 2005: 19 buildings, average cost: $160,000
- 2004: 21 buildings, average cost: $159,400
- 2003: 18 buildings, average cost: $162,400
- 2002: 14 buildings, average cost: $150,000
- 2001: 16 buildings, average cost: $145,800
- 2000: 28 buildings, average cost: $189,400
- 1999: 25 buildings, average cost: $135,400
- 1998: 33 buildings, average cost: $133,400
- 1997: 23 buildings, average cost: $98,500
| Here: | 2.5% |
| New Hampshire: | 2.5% |
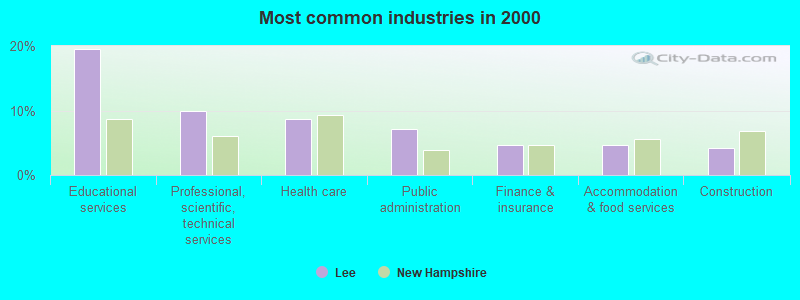
- Educational services (19.6%)
- Professional, scientific, technical services (10.0%)
- Health care (8.7%)
- Public administration (7.2%)
- Finance & insurance (4.7%)
- Accommodation & food services (4.6%)
- Construction (4.1%)
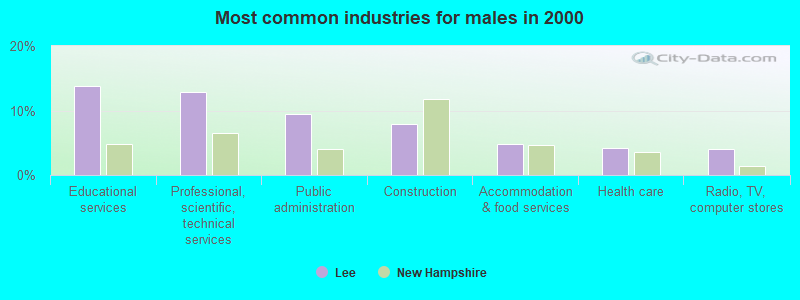
- Educational services (13.9%)
- Professional, scientific, technical services (12.9%)
- Public administration (9.5%)
- Construction (7.9%)
- Accommodation & food services (4.7%)
- Health care (4.2%)
- Radio, TV, computer stores (4.1%)
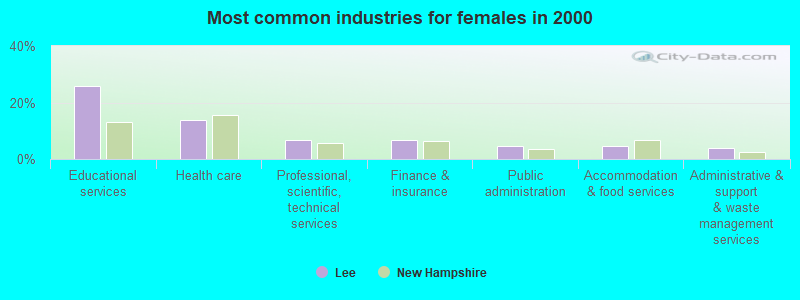
- Educational services (25.9%)
- Health care (13.6%)
- Professional, scientific, technical services (6.8%)
- Finance & insurance (6.8%)
- Public administration (4.6%)
- Accommodation & food services (4.5%)
- Administrative & support & waste management services (3.9%)

- Other sales and related occupations, including supervisors (5.3%)
- Postsecondary teachers (5.2%)
- Other management occupations, except farmers and farm managers (4.8%)
- Computer specialists (4.7%)
- Other office and administrative support workers, including supervisors (4.0%)
- Other production occupations, including supervisors (3.6%)
- Preschool, kindergarten, elementary, and middle school teachers (3.3%)
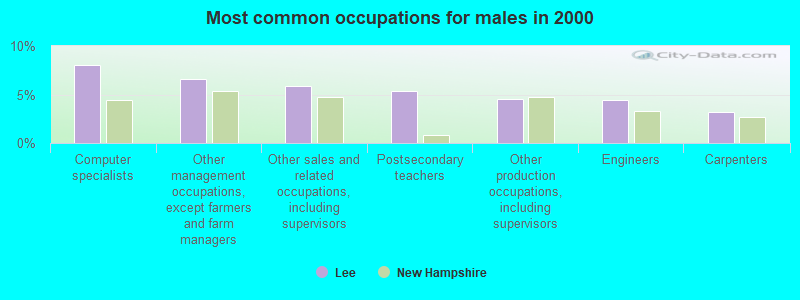
- Computer specialists (8.0%)
- Other management occupations, except farmers and farm managers (6.6%)
- Other sales and related occupations, including supervisors (5.9%)
- Postsecondary teachers (5.4%)
- Other production occupations, including supervisors (4.6%)
- Engineers (4.5%)
- Carpenters (3.2%)

- Other office and administrative support workers, including supervisors (7.9%)
- Secretaries and administrative assistants (6.0%)
- Preschool, kindergarten, elementary, and middle school teachers (5.0%)
- Postsecondary teachers (4.9%)
- Other sales and related occupations, including supervisors (4.6%)
- Counselors, social workers, and other community and social service specialists (4.3%)
- Information and record clerks, except customer service representatives (3.7%)
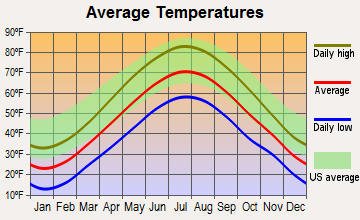
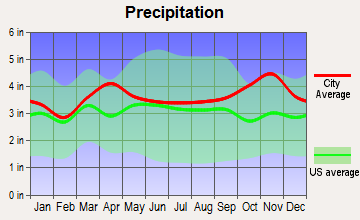
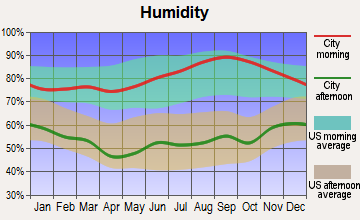
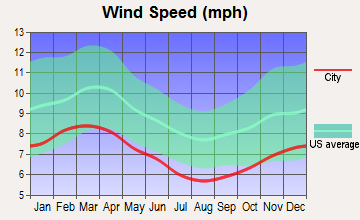
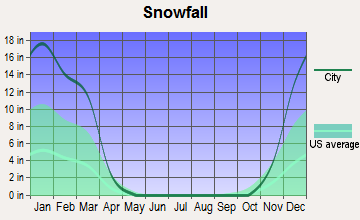
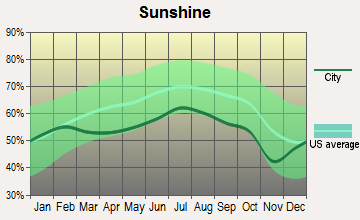
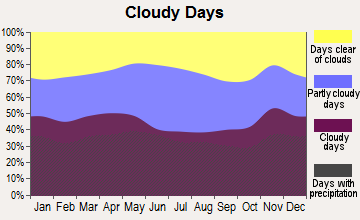
Average climate in Lee, New Hampshire
Based on data reported by over 4,000 weather stations
(lower is better)
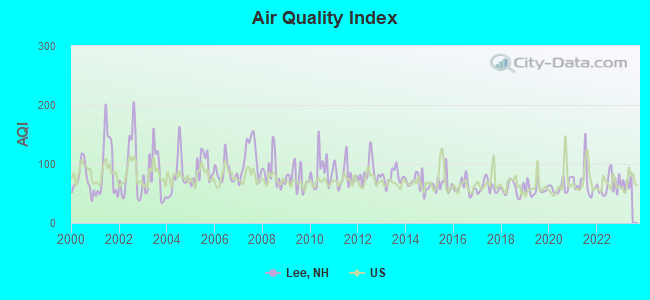
Air Quality Index (AQI) level in 2022 was 64.4. This is about average.
| City: | 64.4 |
| U.S.: | 72.6 |
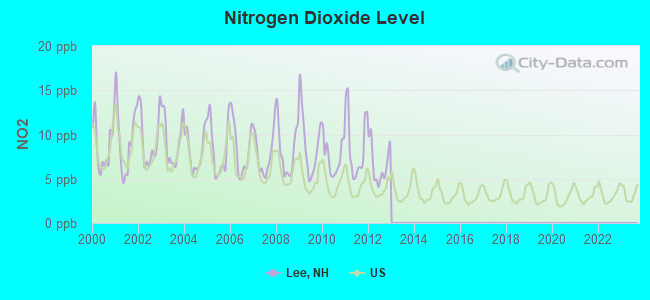
Nitrogen Dioxide (NO2) [ppb] level in 2012 was 6.65. This is worse than average. Closest monitor was 8.4 miles away from the city center.
| City: | 6.65 |
| U.S.: | 5.11 |
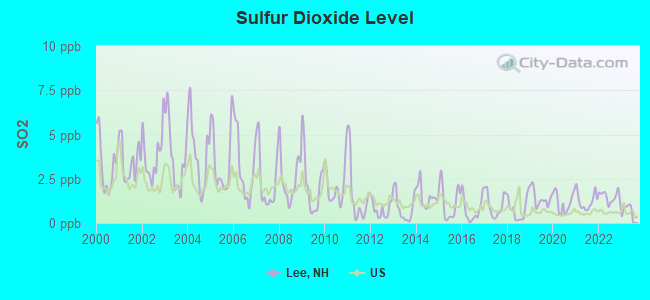
Sulfur Dioxide (SO2) [ppb] level in 2022 was 1.48. This is about average. Closest monitor was 8.4 miles away from the city center.
| City: | 1.48 |
| U.S.: | 1.51 |
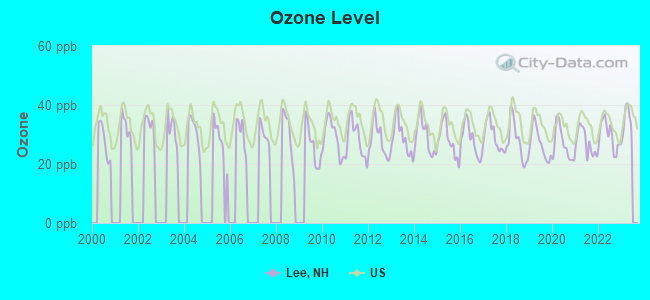
Ozone [ppb] level in 2022 was 29.6. This is about average. Closest monitor was 11.6 miles away from the city center.
| City: | 29.6 |
| U.S.: | 33.3 |
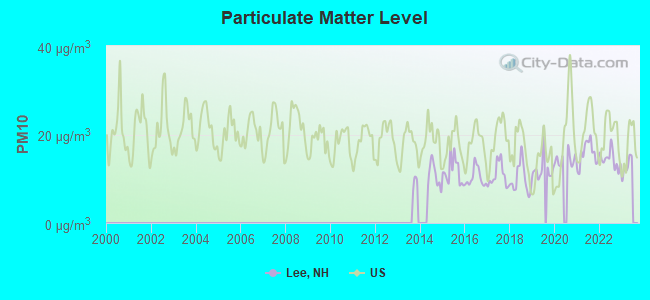
Particulate Matter (PM10) [µg/m3] level in 2022 was 14.4. This is better than average. Closest monitor was 8.4 miles away from the city center.
| City: | 14.4 |
| U.S.: | 19.2 |
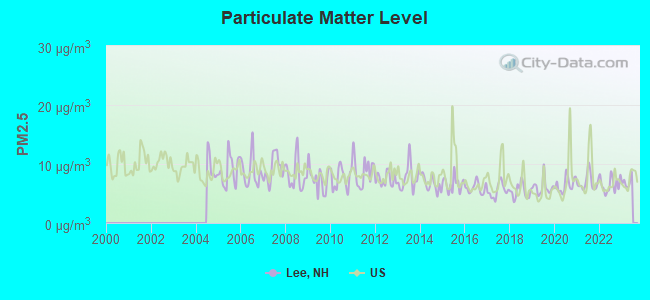
Particulate Matter (PM2.5) [µg/m3] level in 2022 was 6.52. This is better than average. Closest monitor was 12.7 miles away from the city center.
| City: | 6.52 |
| U.S.: | 8.11 |
Tornado activity:
Lee-area historical tornado activity is near New Hampshire state average. It is 52% smaller than the overall U.S. average.
On 6/9/1953, a category F3 (max. wind speeds 158-206 mph) tornado 10.5 miles away from the Lee town center injured 5 people and caused between $5000 and $50,000 in damages.
On 9/29/1974, a category F3 tornado 35.9 miles away from the town center injured one person and caused between $50,000 and $500,000 in damages.
Earthquake activity:
Lee-area historical earthquake activity is significantly above New Hampshire state average. It is 73% smaller than the overall U.S. average.On 4/20/2002 at 10:50:47, a magnitude 5.3 (5.3 ML, Depth: 3.0 mi, Class: Moderate, Intensity: VI - VII) earthquake occurred 165.2 miles away from the city center
On 10/16/2012 at 23:12:25, a magnitude 4.7 (4.7 ML, Depth: 10.0 mi, Class: Light, Intensity: IV - V) earthquake occurred 37.5 miles away from the city center
On 1/19/1982 at 00:14:42, a magnitude 4.7 (4.5 MB, 4.7 MD, 4.5 LG) earthquake occurred 39.7 miles away from the city center
On 10/7/1983 at 10:18:46, a magnitude 5.3 (5.1 MB, 5.3 LG, 5.1 ML) earthquake occurred 176.8 miles away from Lee center
On 4/20/2002 at 10:50:47, a magnitude 5.2 (5.2 MB, 4.2 MS, 5.2 MW, 5.0 MW) earthquake occurred 165.0 miles away from the city center
On 8/21/1996 at 07:54:14, a magnitude 3.8 (3.8 LG, 3.6 LG, Depth: 6.2 mi, Class: Light, Intensity: II - III) earthquake occurred 75.6 miles away from Lee center
Magnitude types: regional Lg-wave magnitude (LG), body-wave magnitude (MB), duration magnitude (MD), local magnitude (ML), surface-wave magnitude (MS), moment magnitude (MW)
Natural disasters:
The number of natural disasters in Strafford County (23) is greater than the US average (15).Major Disasters (Presidential) Declared: 14
Emergencies Declared: 8
Causes of natural disasters: Storms: 8, Floods: 6, Winter Storms: 6, Snowstorms: 5, Hurricanes: 3, Blizzard: 1, Ice Storm: 1, Snow: 1, Snowfall: 1, Tornado: 1, Tropical Storm: 1, Wind: 1, Other: 1 (Note: some incidents may be assigned to more than one category).
Hospitals and medical centers near Lee:
- ROCKINGHAM COUNTY NURSING HOME (Nursing Home, about 8 miles away; BRENTWOOD, NH)
- RIVERSIDE REST HOME (Nursing Home, about 8 miles away; DOVER, NH)
- LANGDON PLACE OF DOVER (Nursing Home, about 9 miles away; DOVER, NH)
- SAINT ANN REHABILITATION AND NURSING CENTER (Nursing Home, about 9 miles away; DOVER, NH)
- KINDRED TRANSITIONAL CARE AND REHABILITATION-DOVER (Nursing Home, about 9 miles away; DOVER, NH)
- WENTWORTH-DOUGLASS HOSPITAL Acute Care Hospitals (about 10 miles away; DOVER, NH)
- ROCKINGHAM VNA AND HOSPICE (Home Health Center, about 10 miles away; EXETER, NH)
Operable nuclear power plant near Lee:
- 19 miles: Seabrook in Seabrook, NH.
Colleges/universities with over 2000 students nearest to Lee:
- University of New Hampshire-Main Campus (about 4 miles; Durham, NH; Full-time enrollment: 15,243)
- Northern Essex Community College (about 23 miles; Haverhill, MA; FT enrollment: 4,737)
- Southern New Hampshire University (about 24 miles; Manchester, NH; FT enrollment: 16,552)
- Mount Washington College (about 26 miles; Manchester, NH; FT enrollment: 2,187)
- Saint Anselm College (about 27 miles; Manchester, NH; FT enrollment: 2,059)
- NHTI-Concord's Community College (about 28 miles; Concord, NH; FT enrollment: 2,865)
- Merrimack College (about 32 miles; North Andover, MA; FT enrollment: 2,734)
Public elementary/middle school in Lee:
- MAST WAY SCHOOL (Students: 361, Location: 23 MAST RD., Grades: KG-4)
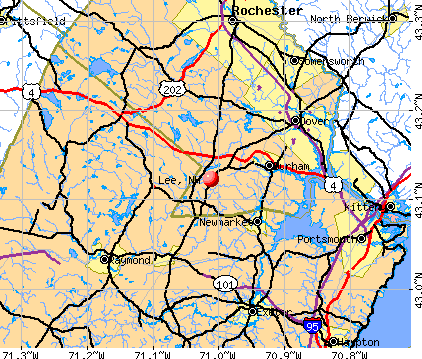
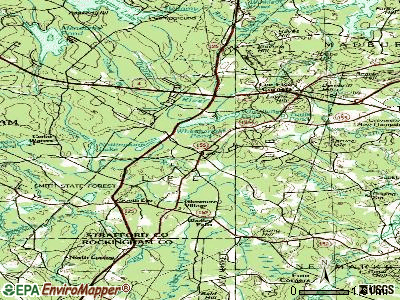
Points of interest:
Notable locations in Lee: Lee Ridge Aviaries (A), Fox Run Campground (B), Forest Glen Campground (C), Demeritt Hill Farm (D), Lee Fire and Rescue Department (E), Lee Public Library (F), Lee Ridge Aviaries Reference Library (G). Display/hide their locations on the map
Church in Lee: Lee Congregational Church (A). Display/hide its location on the map
Cemeteries: Layne Cemetery (1), Davis Cemetery (2), Gluke Cemetery (3), Randall Cemetery (4), Lee Cemetery (5). Display/hide their locations on the map
Lakes: Turtle Pond (A), Wheelwright Pond (B). Display/hide their locations on the map
Streams, rivers, and creeks: Rollins Brook (A), Little River (B). Display/hide their locations on the map
Birthplace of: Ethan Gilsdorf - Journalist, Robert Parker Parrott - Army officer and ordnance manufacturer.
Drinking water stations with addresses in Lee and their reported violations in the past:
WADLEIGH FALLS CAMPGROUND (Population served: 200, Groundwater):Past health violations:BARRINGTON MOBILE HOME ESTATES (Population served: 198, Groundwater):
- MCL, Monthly (TCR) - Between JUL-2008 and SEP-2008, Contaminant: Coliform. Follow-up actions: St Public Notif requested (AUG-14-2008), St Violation/Reminder Notice (AUG-14-2008), St Public Notif received (AUG-25-2008), St Compliance achieved (SEP-09-2009)
Past health violations:SUNNYS RESTAURANT (Address: 250 CALEF HWY , Population served: 150, Groundwater):
- OCCT/SOWT Study/Recommendation - In FEB-01-2010, Contaminant: Lead and Copper Rule. Follow-up actions: St Public Notif requested (MAR-08-2010), St Violation/Reminder Notice (MAR-08-2010), St Compliance achieved (MAR-10-2010), St Public Notif received (MAR-30-2010)
- MCL, Monthly (TCR) - In JUL-2006, Contaminant: Coliform. Follow-up actions: St Public Notif requested (AUG-07-2006), St Violation/Reminder Notice (AUG-07-2006), St Public Notif received (SEP-06-2006), St Compliance achieved (JAN-31-2007)
Past monitoring violations:WELLINGTON CAMPING PARK (Population served: 150, Groundwater):
- 5 routine major monitoring violations
- One regular monitoring violation
Past monitoring violations:PACKERS FALLS VILLAGE (Population served: 60, Groundwater):
- Monitoring, Source Water (GWR) - Between MAY-20-2011 and JUN-20-2011, Contaminant: E. COLI. Follow-up actions: St Public Notif requested (JUN-09-2011), St Violation/Reminder Notice (JUN-09-2011), St Compliance achieved (JUN-15-2011), St Public Notif received (JUN-17-2011)
- One routine major monitoring violation
Past health violations:HILL ACRES TRAILER PARK (Population served: 35, Groundwater):Past monitoring violations:
- MCL, Average - Between OCT-2008 and DEC-2008, Contaminant: Arsenic. Follow-up actions: St Public Notif requested (DEC-29-2008), St Violation/Reminder Notice (DEC-29-2008), St Public Notif received (JAN-23-2009), St Compliance achieved (JUL-06-2009)
- Lead Consumer Notice - In JUL-01-2012, Contaminant: Lead and Copper Rule. Follow-up actions: St Violation/Reminder Notice (JUL-10-2012), St Compliance achieved (JUL-16-2012)
- One routine major monitoring violation
Past health violations:GREYSTONE COMMONS (Population served: 25, Groundwater):
- MCL, Average - Between OCT-2013 and DEC-2013, Contaminant: Arsenic. Follow-up actions: St Public Notif requested (JAN-03-2014), St Violation/Reminder Notice (JAN-03-2014), St Public Notif received (JAN-31-2014)
Past monitoring violations:
- Lead Consumer Notice - In JUL-01-2012, Contaminant: Lead and Copper Rule. Follow-up actions: St Violation/Reminder Notice (JUL-10-2012), St Compliance achieved (JUL-13-2012)
| This town: | 2.6 people |
| New Hampshire: | 2.5 people |
| This town: | 70.9% |
| Whole state: | 66.3% |
| This town: | 9.2% |
| Whole state: | 8.3% |
Likely homosexual households (counted as self-reported same-sex unmarried-partner households)
- Lesbian couples: 0.6% of all households
- Gay men: 0.4% of all households
| This town: | 5.1% |
| Whole state: | 6.5% |
| This town: | 2.0% |
| Whole state: | 2.8% |
For population 15 years and over in Lee:
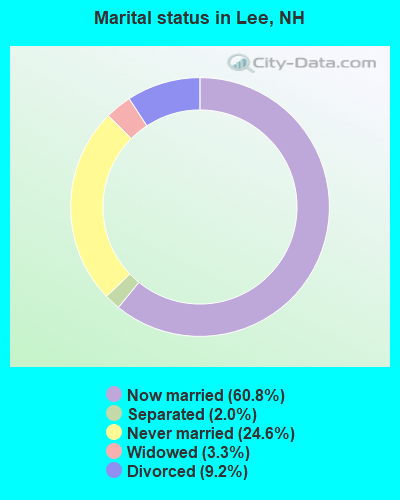
- Never married: 24.6%
- Now married: 60.8%
- Separated: 2.0%
- Widowed: 3.3%
- Divorced: 9.2%
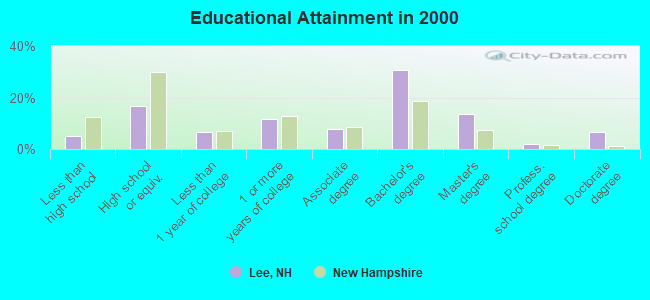
For population 25 years and over in Lee:
- High school or higher: 95.1%
- Bachelor's degree or higher: 52.6%
- Graduate or professional degree: 22.0%
- Unemployed: 1.2%
- Mean travel time to work (commute): 26.4 minutes
| Here: | 10.4 |
| New Hampshire average: | 10.9 |
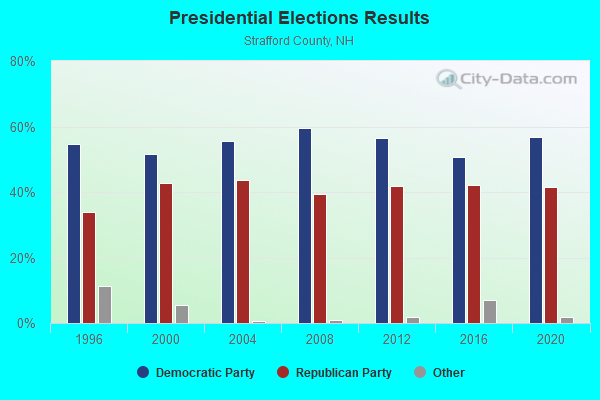
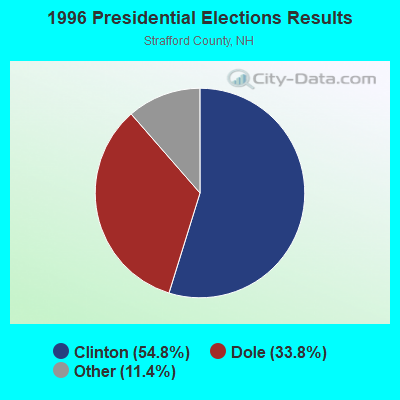
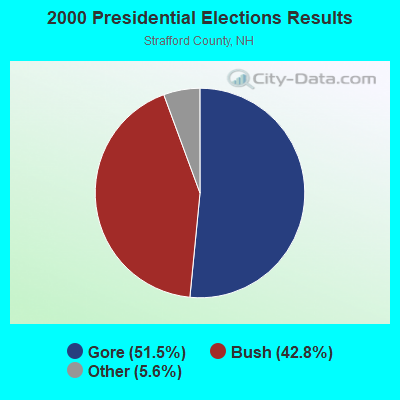
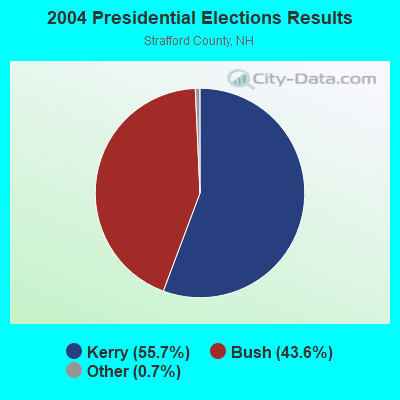
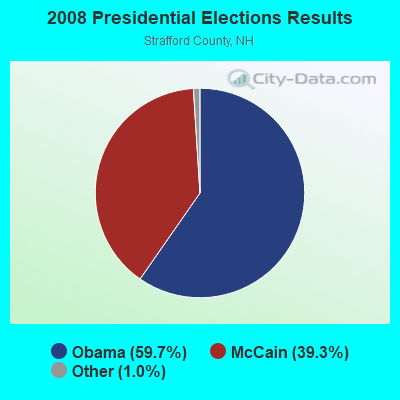
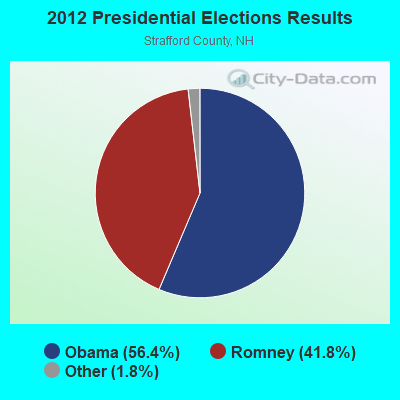


Graphs represent county-level data. Detailed 2008 Election Results
Religion statistics for Lee, NH (based on Strafford County data)
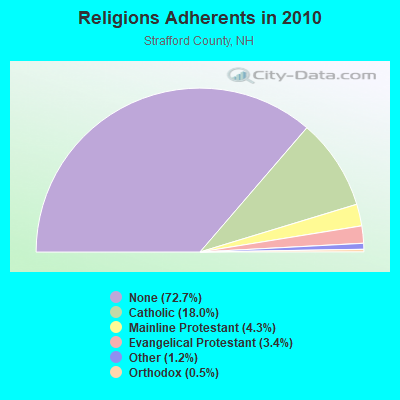
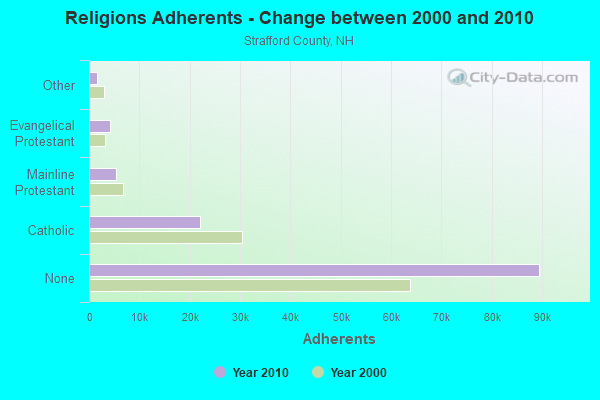
| Religion | Adherents | Congregations |
|---|---|---|
| Catholic | 22,112 | 11 |
| Mainline Protestant | 5,299 | 21 |
| Evangelical Protestant | 4,143 | 37 |
| Other | 1,504 | 13 |
| Orthodox | 575 | 2 |
| None | 89,510 | - |
Food Environment Statistics:
| Strafford County: | 1.73 / 10,000 pop. |
| State: | 2.14 / 10,000 pop. |
| Strafford County: | 0.08 / 10,000 pop. |
| New Hampshire: | 0.15 / 10,000 pop. |
| Strafford County: | 2.48 / 10,000 pop. |
| New Hampshire: | 1.78 / 10,000 pop. |
| This county: | 3.80 / 10,000 pop. |
| New Hampshire: | 4.02 / 10,000 pop. |
| This county: | 8.17 / 10,000 pop. |
| New Hampshire: | 9.70 / 10,000 pop. |
| This county: | 8.8% |
| New Hampshire: | 7.6% |
| Here: | 26.2% |
| State: | 24.4% |
| This county: | 14.0% |
| New Hampshire: | 15.9% |
| Businesses in Lee, NH | ||||
| Name | Count | Name | Count | |
|---|---|---|---|---|
| DHL | 1 | Rite Aid | 1 | |
| Dunkin Donuts | 1 | U-Haul | 1 | |
| FedEx | 1 | UPS | 1 | |
| GNC | 1 | Walgreens | 1 | |
| McDonald's | 1 | Wendy's | 1 | |
| RadioShack | 1 | |||
Strongest AM radio stations in Lee:
- WGIN (930 AM; 10 kW; ROCHESTER, NH; Owner: CAPSTAR TX LIMITED PARTNERSHIP)
- WTSN (1270 AM; 5 kW; DOVER, NH; Owner: GARRISON CITY BROADCASTING, INC.)
- WGIP (1540 AM; 5 kW; EXETER, NH; Owner: CAPSTAR TX LIMITED PARTNERSHIP)
- WRKO (680 AM; 50 kW; BOSTON, MA; Owner: ENTERCOM BOSTON LICENSE, LLC)
- WEEI (850 AM; 50 kW; BOSTON, MA; Owner: ENTERCOM BOSTON LICENSE, LLC)
- WDER (1320 AM; 10 kW; DERRY, NH; Owner: BLOUNT COMMUNICATIONS, INC. OF NH)
- WBZ (1030 AM; 50 kW; BOSTON, MA; Owner: INFINITY BROADCASTING OPERATIONS, INC.)
- WWZN (1510 AM; 50 kW; BOSTON, MA; Owner: ROSE CITY RADIO CORPORATION)
- WGIR (610 AM; 5 kW; MANCHESTER, NH; Owner: CAPSTAR TX LIMITED PARTNERSHIP)
- WKOX (1200 AM; 50 kW; FRAMINGHAM, MA; Owner: CAPSTAR TX LIMITED PARTNERSHIP)
- WCRN (830 AM; 50 kW; WORCESTER, MA; Owner: CARTER BROADCASTING CORPORATION)
- WBIX (1060 AM; 40 kW; NATICK, MA; Owner: LANGER BROADCASTING CORPORATION)
- WALE (990 AM; 50 kW; GREENVILLE, RI; Owner: NORTH AMERICAN BROADCASTING CO., INC.)
Strongest FM radio stations in Lee:
- WUNH (91.3 FM; DURHAM, NH; Owner: UNIVERSITY OF NEW HAMPSHIRE)
- WOKQ (97.5 FM; DOVER, NH; Owner: CITADEL BROADCASTING COMPANY)
- WERZ (107.1 FM; EXETER, NH; Owner: CAPSTAR TX LIMITED PARTNERSHIP)
- WUBB (95.3 FM; YORK CENTER, ME; Owner: CAPSTAR TX LIMITED PARTNERSHIP)
- WHEB (100.3 FM; PORTSMOUTH, NH; Owner: CAPSTAR TX LIMITED PARTNERSHIP)
- WBYY (98.7 FM; SOMERSWORTH, NH; Owner: GARRISON CITY BROADCASTING, INC.)
- WSHK (105.3 FM; KITTERY, ME; Owner: CITADEL BROADCASTING COMPANY)
- WMEX (106.5 FM; FARMINGTON, NH; Owner: WIMMEX, LLC)
- WSCY (106.9 FM; MOULTONBOROUGH, NH; Owner: NORTHEAST COMMUNICATIONS CORPORATION)
- WQSO (96.7 FM; ROCHESTER, NH; Owner: CAPSTAR TX LIMITED PARTNERSHIP)
- WPKQ (103.7 FM; NORTH CONWAY, NH; Owner: CITADEL BROADCASTING COMPANY)
- WHOM (94.9 FM; MT. WASHINGTON, NH; Owner: CITADEL BROADCASTING COMPANY)
- WGIR-FM (101.1 FM; MANCHESTER, NH; Owner: CAPSTAR TX LIMITED PARTNERSHIP)
- WXRV (92.5 FM; HAVERHILL, MA; Owner: BEANPOT BROADCASTING CORP.)
- WQLL (96.5 FM; BEDFORD, NH; Owner: SAGA COMMUNICATIONS OF NEW ENGLAND, LLC)
- WLMW (90.7 FM; MANCHESTER, NH; Owner: KNOWLEDGE FOR LIFE)
- WZID (95.7 FM; MANCHESTER, NH; Owner: SAGA COMMUNICATIONS OF NEW ENGLAND, LLC)
- WNHI (93.3 FM; BELMONT, NH; Owner: CONCORD BROADCASTING, L.L.C.)
- WMEA (90.1 FM; PORTLAND, ME; Owner: MAINE PUBLIC BROADCASTING CORPORATION)
- WPHX-FM (92.1 FM; SANFORD, ME; Owner: FNX BROADCASTING LLC)
TV broadcast stations around Lee:
- WMEA-TV (Channel 26; BIDDEFORD, ME; Owner: MAINE PUBLIC BROADCASTING CORP.)
- WENH-TV (Channel 11; DURHAM, NH; Owner: UNIVERSITY OF NEW HAMPSHIRE)
- WHDN-LP (Channel 26; BOSTON, MA; Owner: GUENTER MARKSTEINER)
- WFXZ-CA (Channel 24; BOSTON, MA; Owner: BOSTON BROADCASTING CORP.)
- WMTW-TV (Channel 8; POLAND SPRING, ME; Owner: WMTW BROADCAST GROUP, LLC)
- WPXG (Channel 21; CONCORD, NH; Owner: PAXSON BOSTON-68 LICENSE, INC.)
- National Bridge Inventory (NBI) Statistics
- 9Number of bridges
- 43ft / 13.4mTotal length
- $25,136,000Total costs
- 40,621Total average daily traffic
- 2,457Total average daily truck traffic
FCC Registered Antenna Towers:
7- EDWARD G ROACH, North From The Intersection Of Us Hgy 4 & Ste Rte 125 (Lat: 43.166444 Lon: -71.006833), Type: 60.7, Overall height: 57.9 m, Registrant: Sba Towers Inc, Eroach@sbasite.Com, , Boca -Raton, Phone: (561) 995-7670
- EDWARD G ROACH, North From The Intersection Of Us Hgy 4 & Ste Rte 125 (Lat: 43.166444 Lon: -71.006833), Type: 60.7, Overall height: 57.9 m, Registrant: None
- Edward G Roach, North From The Intersection Of Us Hgy 4 & Ste Rte 125 (Lat: 43.166444 Lon: -71.006833), Type: 60.7, Overall height: 57.9 m, Registrant: None
- Edward G Roach, Route 125 (Lat: 43.117111 Lon: -71.034139), Type: 60.7, Overall height: 57.6 m, Registrant: Sba Properties, Inc, Eroach@sbasite.Com, , Boca -Raton, Phone: (561) 995-7670
- Edward G Roach, Route 125 (Lat: 43.117111 Lon: -71.034139), Type: 60.7, Overall height: 57.6 m, Registrant: Sba Properties, Inc, Eroach@sbasite.Com, , Boca -Raton, Phone: (561) 995-7670
- Edward G Roach, Route 125 (Lat: 43.117111 Lon: -71.034139), Type: 60.7, Structure height: 33017 m, Overall height: 57.6 m, Registrant: Sba Properties, LLC, Eroach@sbasite.Com, , Boca -Raton, Phone: (561) 995-7670
- Edward G Roach, North From The Intersection Of Us Hgy 4 & Ste Rte 125 (Lat: 43.166444 Lon: -71.006833), Type: 60.7, Structure height: 33017 m, Overall height: 57.9 m, Registrant: Sba Towers, LLC, Eroach@sbasite.Com, , Boca -Raton, Phone: (561) 995-7670
FCC Registered Broadcast Land Mobile Towers:
3- 20 George Bennett Road (Lat: 43.123944 Lon: -71.015667), Type: Pipe, Structure height: 10.6 m, Overall height: 18 m, Call Sign: KNER701,
Assigned Frequencies: 154.190 MHz, Grant Date: 11/07/2012, Expiration Date: 01/21/2023, Cancellation Date: 03/25/2023, Registrant: Ewa - 2012060504, 17750 Creamery Road, Suite B10, Emmitsburg, MD 21727, Phone: (703) 797-5146, Fax: (717) 337-9157, Email:
- 95 Calef Highway (Lat: 43.158611 Lon: -71.005556), Call Sign: WQBD690,
Assigned Frequencies: 30.8400 MHz, 154.540 MHz, 33.4000 MHz, 33.1600 MHz, 31.2400 MHz, 468.487 MHz, 468.762 MHz, 468.837 MHz, 469.462 MHz, 469.637 MHz... (+22 more), Grant Date: 09/24/2004, Expiration Date: 09/24/2014, Cancellation Date: 11/29/2014, Certifier: Glen W Baker, Registrant: Panasonic Digital Communications&security Company, 1707 N. Randall Road, E1-D9, Elgin, IL 60123-7847, Phone: (847) 468-5318, Fax: (847) 574-7614, Email:
- Lat: 43.135806 Lon: -70.985833, Call Sign: WQXS867,
Assigned Frequencies: 452.812 MHz, Grant Date: 05/31/2016, Expiration Date: 05/31/2026, Certifier: Molly R Darling, Registrant: 2-Way Communications Service, Inc., 23 River Road, Newington, NH 03801-2832, Phone: (603) 431-6288, Fax: (603) 431-4832, Email:
FCC Registered Amateur Radio Licenses:
31 (See the full list of FCC Registered Amateur Radio Licenses in Lee)FAA Registered Aircraft:
20 (See the full list of FAA Registered Aircraft in Lee)2002 - 2018 National Fire Incident Reporting System (NFIRS) incidents
- Fire incident types reported to NFIRS in Lee, NH
- 17353.6%Structure Fires
- 9930.7%Outside Fires
- 319.6%Mobile Property/Vehicle Fires
- 206.2%Other
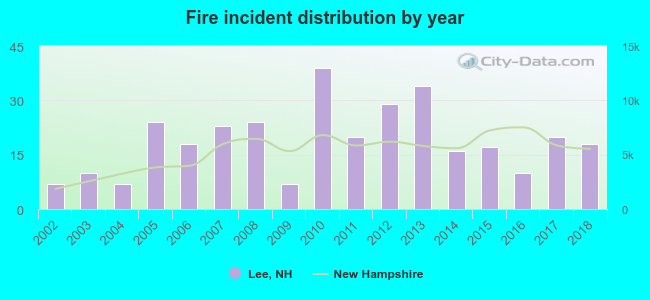 Based on the data from the years 2002 - 2018 the average number of fires per year is 19. The highest number of fire incidents - 39 took place in 2010, and the least - 7 in 2002. The data has a growing trend.
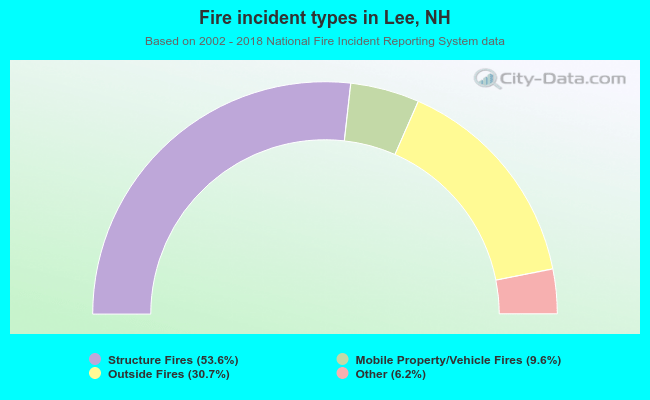 When looking into fire subcategories, the most incidents belonged to: Structure Fires (53.6%), and Outside Fires (30.7%).
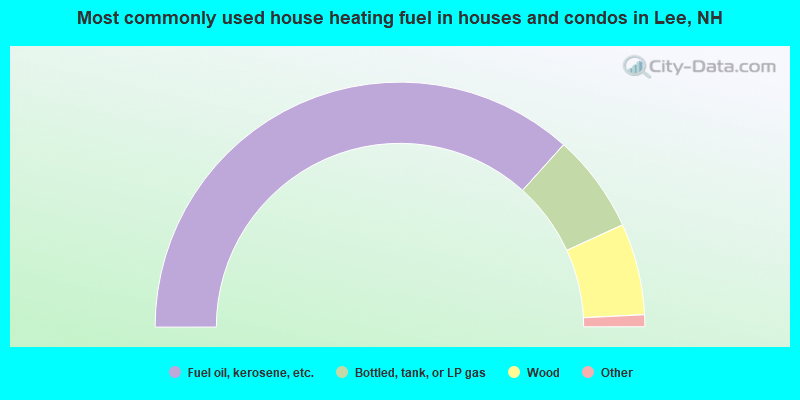
- 73.3%Fuel oil, kerosene, etc.
- 13.0%Bottled, tank, or LP gas
- 12.1%Wood
- 1.1%Electricity
- 0.5%Other fuel
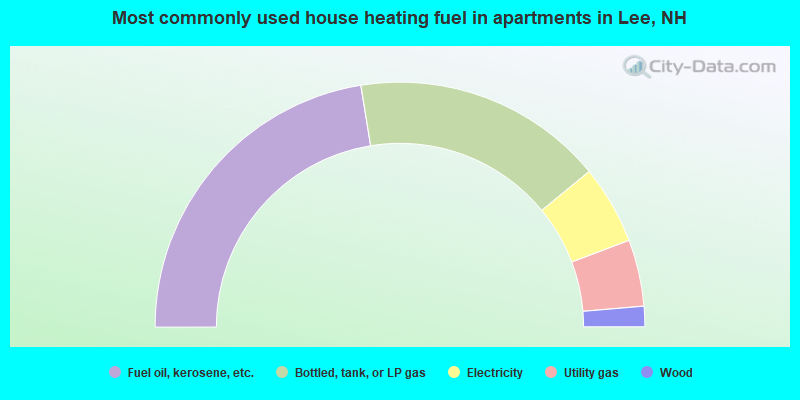
- 44.9%Fuel oil, kerosene, etc.
- 33.2%Bottled, tank, or LP gas
- 10.4%Electricity
- 8.8%Utility gas
- 2.7%Wood
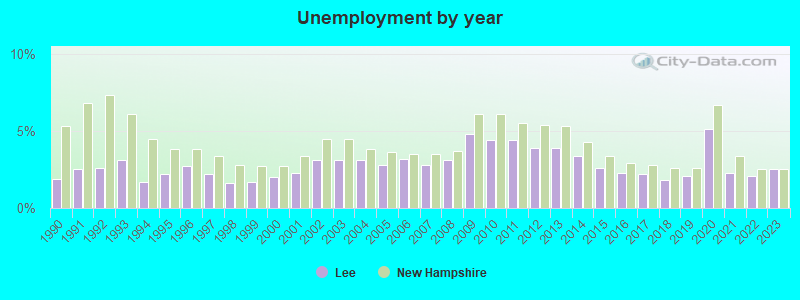
Lee compared to New Hampshire state average:
- Unemployed percentage significantly below state average.
- Hispanic race population percentage below state average.
- Length of stay since moving in significantly above state average.
- Number of rooms per house significantly below state average.
- House age significantly below state average.
- Percentage of population with a bachelor's degree or higher above state average.

|
|
Total of 160 patent applications in 2008-2024.