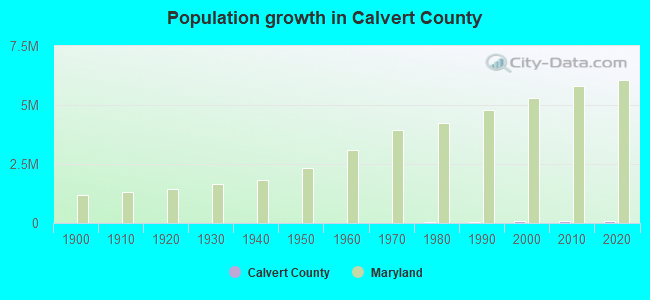
Calvert County, Maryland (MD)
County owner-occupied free and clear houses and condos in 2010: 4,095
County owner-occupied houses and condos in 2000: 21,676
Renter-occupied apartments: 5,003 (it was 3,771 in 2000)
| % of renters here: | 15% |
| State: | 32% |
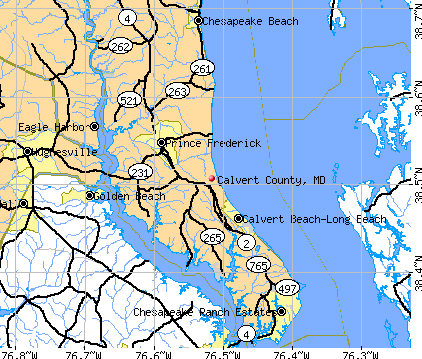
Land area: 215 sq. mi.
Water area: 129.9 sq. mi.
Population density: 440 people per square mile (high).
Industries providing employment: Educational, health and social services (21.7%), Public administration (16.1%), Professional, scientific, management, administrative, and waste management services (13.2%), Construction (12.4%).
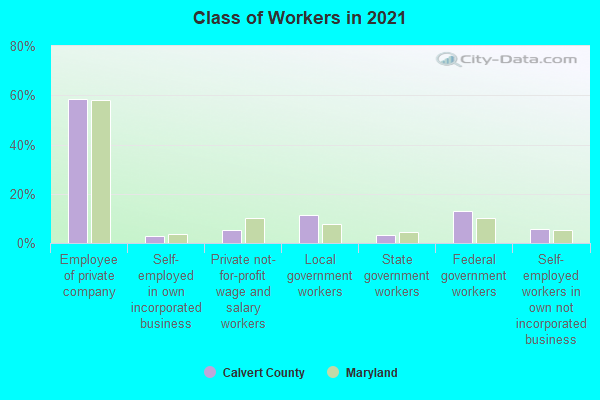
Type of workers:
- Private wage or salary: 63%
- Government: 31%
- Self-employed, not incorporated: 6%
- Unpaid family work: 0%
- OSM Map
- General Map
- Google Map
- MSN Map

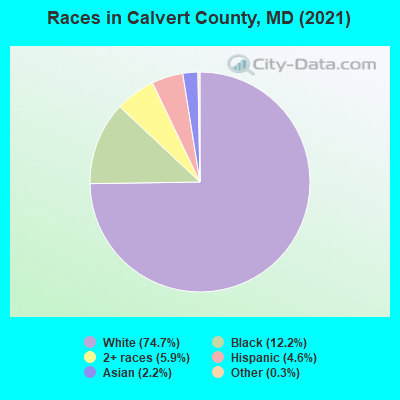
- 69,91073.9%White Non-Hispanic Alone
- 9,1209.6%Black Non-Hispanic Alone
- 8,7449.2%Two or more races
- 4,8785.2%Hispanic or Latino
- 7850.8%Some other race alone
- 7670.8%Asian alone
- 2010.2%American Indian and Alaska Native alone
- 1680.2%Native Hawaiian and Other
Pacific Islander alone
| Median resident age: | 40.1 years |
| Maryland median age: | 39.7 years |
| Males: 47,737 | |
| Females: 46,836 |

 | Racism in Calvert County? (73 replies) |
| FBI HQ relocation decision postponed yet again. (540 replies) |
| What's the story with the white people in Prince George County? :) (192 replies) |
| Wealthiest Black Majority County is Charles County (68 replies) |
| Commute from Calvert County to DC (19 replies) |
| St. Mary's County vs Calvert County (20 replies) |
| Calvert County: | 2.0 people |
| Maryland: | 3 people |
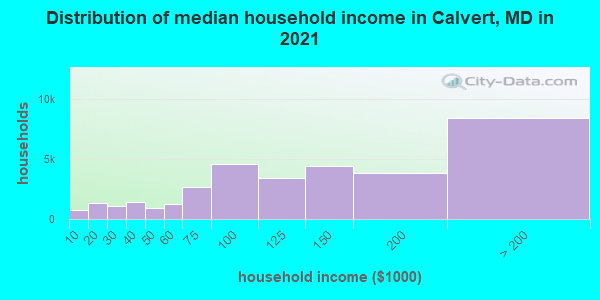
Estimated median household income in 2022: $120,097 ($65,945 in 1999)
| This county: | $120,097 |
| Maryland: | $94,991 |
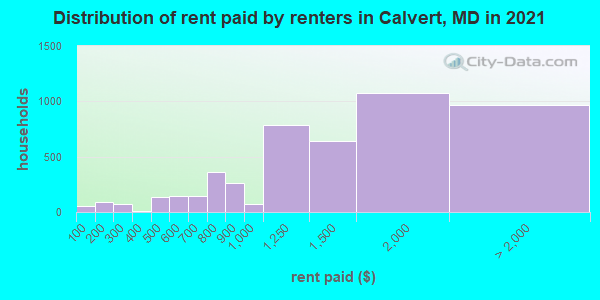
Median contract rent in 2022 for apartments: $1,535 (lower quartile is $1,098, upper quartile is $2,129)
| This county: | $1535 |
| State: | $1388 |
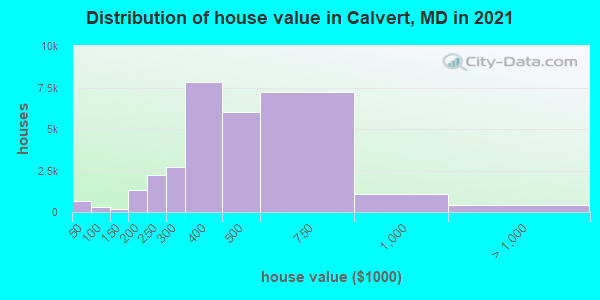
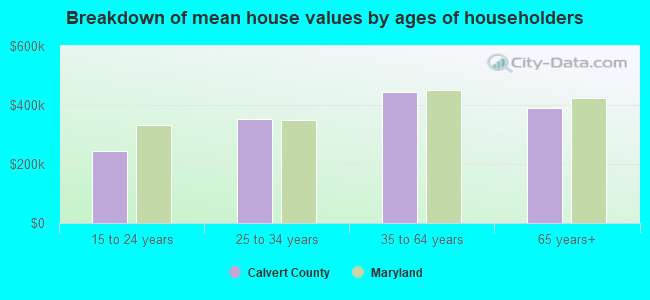
Estimated median house or condo value in 2022: $438,900 (it was $170,800 in 2000)
| Calvert: | $438,900 |
| Maryland: | $398,100 |
Median monthly housing costs for homes and condos with a mortgage: $2,185
Median monthly housing costs for units without a mortgage: $684
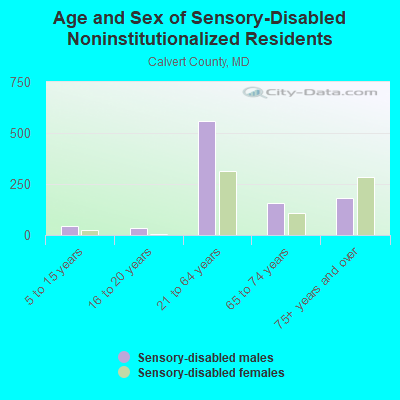
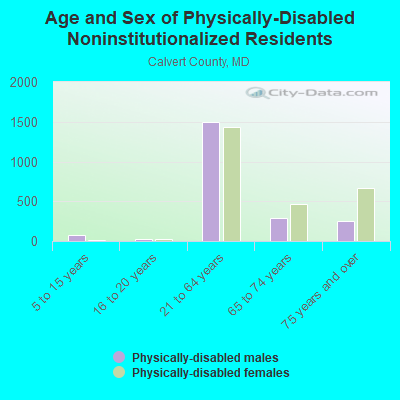
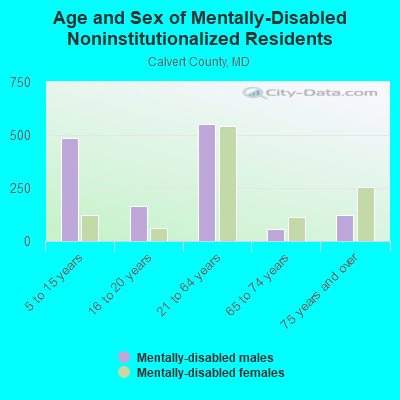
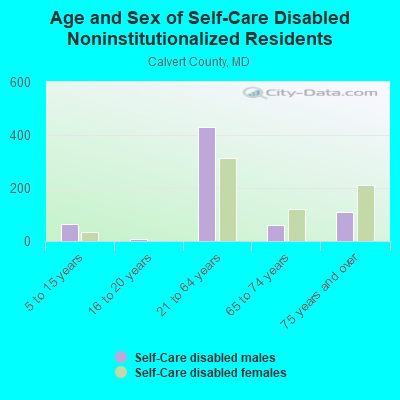
Institutionalized population: 549
Crime in 2020 (reported by the sheriff's office or county police, not the county total):
- Murders: 0
- Rapes: 12
- Robberies: 9
- Assaults: 49
- Burglaries: 76
- Thefts: 411
- Auto thefts: 31
Crime in 2019 (reported by the sheriff's office or county police, not the county total):
- Murders: 0
- Rapes: 18
- Robberies: 18
- Assaults: 75
- Burglaries: 109
- Thefts: 618
- Auto thefts: 33
Health of residents in Calvert County based on CDC Behavioral Risk Factor Surveillance System Survey Questionnaires from 2003 to 2012:
General health status score of residents in this county from 1 (poor) to 5 (excellent) is 3.6. This is about average.78.3% of residents exercised in the past month. This is about average.
47.0% of residents smoked 100+ cigarettes in their lives. This is about average.
98.0% of adult residents drank alcohol in the past 30 days. This is more than average.
75.8% of residents visited a dentist within the past year. This is about average.
Average weight of males is 201 pounds. This is more than average.
Average weight of females is 161 pounds. This is about average.
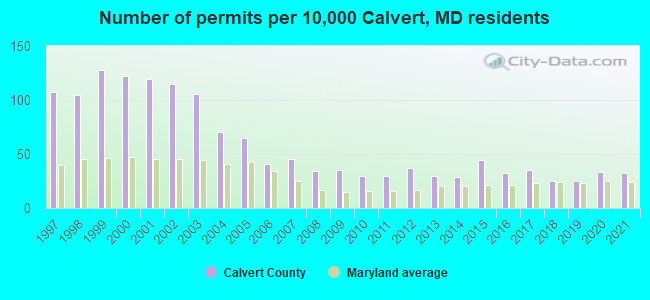
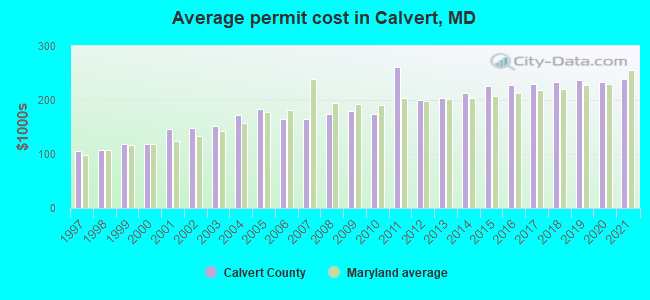
Single-family new house construction building permits:
- 2022: 127 buildings, average cost: $250,200
- 2021: 237 buildings, average cost: $237,500
- 2020: 243 buildings, average cost: $234,300
- 2019: 190 buildings, average cost: $237,000
- 2018: 184 buildings, average cost: $234,400
- 2017: 263 buildings, average cost: $229,600
- 2016: 236 buildings, average cost: $227,000
- 2015: 327 buildings, average cost: $225,200
- 2014: 213 buildings, average cost: $212,700
- 2013: 221 buildings, average cost: $202,500
- 2012: 276 buildings, average cost: $199,700
- 2011: 223 buildings, average cost: $261,700
- 2010: 220 buildings, average cost: $175,400
- 2009: 260 buildings, average cost: $179,500
- 2008: 252 buildings, average cost: $173,700
- 2007: 333 buildings, average cost: $164,600
- 2006: 305 buildings, average cost: $165,200
- 2005: 488 buildings, average cost: $184,400
- 2004: 525 buildings, average cost: $172,900
- 2003: 791 buildings, average cost: $152,300
- 2002: 855 buildings, average cost: $147,500
- 2001: 886 buildings, average cost: $146,700
- 2000: 906 buildings, average cost: $118,400
- 1999: 952 buildings, average cost: $118,700
- 1998: 785 buildings, average cost: $108,400
- 1997: 799 buildings, average cost: $104,700
Median real estate property taxes paid for housing units with mortgages in 2022: $3,612 (0.8%)
Median real estate property taxes paid for housing units with no mortgage in 2022: $3,651 (0.9%)
| Calvert County: | 3.5% |
| Maryland: | 9.6% |
Median age of residents in 2022: 40.1 years old
(Males: 37.9 years old, Females: 41.9 years old)
(Median age for: White residents: 42.2 years old, Black residents: 47.7 years old, American Indian residents: 39.3 years old, Asian residents: 53.0 years old, Hispanic or Latino residents: 25.6 years old, Other race residents: 28.8 years old)
Area name: Washington-Arlington-Alexandria, DC-VA-MD HUD Metro FMR Area
Fair market rent in 2006 for a 1-bedroom apartment in Calvert County is $1080 a month.
Fair market rent for a 2-bedroom apartment is $1225 a month.
Fair market rent for a 3-bedroom apartment is $1580 a month.
Cities in this county include: Chesapeake Ranch Estates-Drum Point, Chesapeake Ranch Estates, Chesapeake Beach, Drum Point, Calvert Beach-Long Beach, Huntingtown, Dunkirk, North Beach, Long Beach, Lusby.
2023 air pollution in Calvert County:
Ozone (1-hour): 0.039 ppm (standard limit: 0.12 ppm). Near U.S. average.
Neighboring counties: Dubois County, Indiana  , Gunnison County, Colorado , Fairfax County, Virginia
  , Sacramento County, California , Marion County, Kansas , Page County, Virginia .
| Here: | 1.7% |
| Maryland: | 2.0% |

Current college students: 3,148
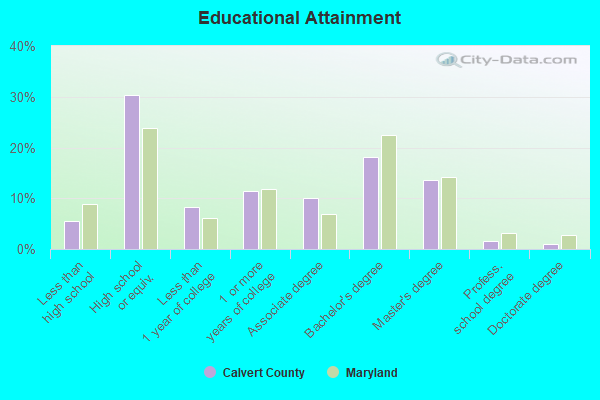
People 25 years of age or older with a high school degree or higher: 95.6%
People 25 years of age or older with a bachelor's degree or higher: 35.5%
Number of foreign born residents: 3,721 (85.3% naturalized citizens)
| Calvert County: | 3.9% |
| Whole state: | 16.7% |

- Year of entry for the foreign-born population
- 8662010 or later
- 1,0072000 to 2009
- 6491990 to 1999
- 2981980 to 1989
- 2901970 to 1979
- 564Before 1970
Mean travel time to work (commute): * minutes
Percentage of county residents living and working in this county: 81.3%
Housing units in structures:
- One, detached: 31,622
- One, attached: 2,344
- Two: 54
- 5 to 9: 76
- 10 to 19: 276
- 20 to 49: 818
- 50 or more: 459
- Mobile homes: 591
Housing units in Calvert County with a mortgage: 23,697 (3,090 second mortgage, 60 home equity loan, 2,411 both second mortgage and home equity loan)
Houses without a mortgage: 300
| Here: | 7.1% with mortgage |
| State: | 97.5% with mortgage |
Religion statistics for Calvert County
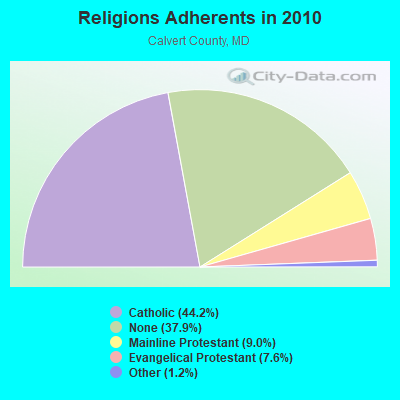
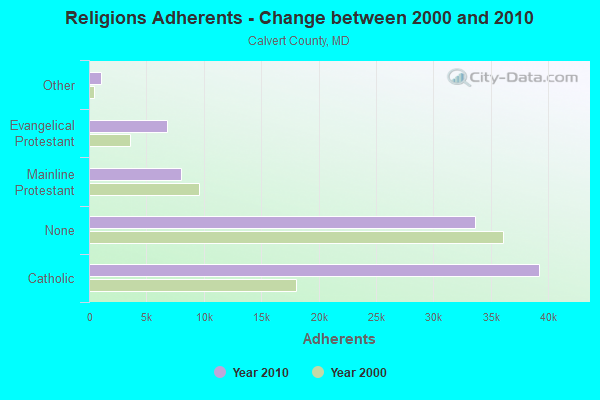
| Religion | Adherents | Congregations |
|---|---|---|
| Catholic | 39,245 | 5 |
| Mainline Protestant | 7,988 | 32 |
| Evangelical Protestant | 6,779 | 31 |
| Other | 1,076 | 3 |
| Black Protestant | - | 2 |
| None | 33,649 | - |
Source: Clifford Grammich, Kirk Hadaway, Richard Houseal, Dale E.Jones, Alexei Krindatch, Richie Stanley and Richard H.Taylor. 2012. 2010 U.S.Religion Census: Religious Congregations & Membership Study. Association of Statisticians of American Religious Bodies. Jones, Dale E., et al. 2002. Congregations and Membership in the United States 2000. Nashville, TN: Glenmary Research Center.
Food Environment Statistics:
| Calvert County: | 1.47 / 10,000 pop. |
| State: | 1.96 / 10,000 pop. |
| This county: | 0.79 / 10,000 pop. |
| Maryland: | 1.22 / 10,000 pop. |
| Calvert County: | 2.16 / 10,000 pop. |
| Maryland: | 2.05 / 10,000 pop. |
| This county: | 4.88 / 10,000 pop. |
| State: | 5.40 / 10,000 pop. |
| Calvert County: | 8.2% |
| Maryland: | 9.1% |
| Calvert County: | 26.1% |
| State: | 26.7% |
| Here: | 10.8% |
| State: | 15.5% |
Agriculture in Calvert County:
Average size of farms: 94 acresAverage value of agricultural products sold per farm: $10,105
Average value of crops sold per acre for harvested cropland: $209.43
The value of nursery, greenhouse, floriculture, and sod as a percentage of the total market value of agricultural products sold: 17.77%
The value of livestock, poultry, and their products as a percentage of the total market value of agricultural products sold: 12.54%
Average total farm production expenses per farm: $12,509
Harvested cropland as a percentage of land in farms: 45.11%
Average market value of all machinery and equipment per farm: $30,516
The percentage of farms operated by a family or individual: 90.34%
Average age of principal farm operators: 58 years
Average number of cattle and calves per 100 acres of all land in farms: 5.23
Corn for grain: 5253 harvested acres
All wheat for grain: 1756 harvested acres
Soybeans for beans: 4191 harvested acres
Vegetables: 262 harvested acres
Land in orchards: 54 acres
Earthquake activity:
Calvert County-area historical earthquake activity is significantly above Maryland state average. It is 60% smaller than the overall U.S. average.On 8/23/2011 at 17:51:04, a magnitude 5.8 (5.8 MW, Depth: 3.7 mi, Class: Moderate, Intensity: VI - VII) earthquake occurred 87.4 miles away from Calvert County center
On 8/25/2011 at 05:07:52, a magnitude 4.5 (4.5 ML, Depth: 4.2 mi, Class: Light, Intensity: IV - V) earthquake occurred 87.7 miles away from the county center
On 12/9/2003 at 20:59:14, a magnitude 4.5 (4.5 MB, 4.5 LG) earthquake occurred 98.7 miles away from the county center
On 12/9/2003 at 20:59:18, a magnitude 4.5 (4.5 ML, Depth: 6.2 mi) earthquake occurred 99.9 miles away from the county center
On 1/16/1994 at 01:49:16, a magnitude 4.6 (4.6 MB, 4.6 LG, Depth: 3.1 mi) earthquake occurred 128.7 miles away from Calvert County center
On 8/24/2011 at 00:04:36, a magnitude 4.2 (4.2 ML) earthquake occurred 88.2 miles away from the county center
Magnitude types: regional Lg-wave magnitude (LG), body-wave magnitude (MB), local magnitude (ML), moment magnitude (MW)
Most recent natural disasters:
- Maryland Covid-19 Pandemic, Incident Period: January 20, 2020, Major Disaster (Presidential) Declared DR-4491-MD: March 26, 2020, FEMA Id: 4491, Natural disaster type: Other
- Maryland Severe Winter Storm and Snowstorm, Incident Period: January 22, 2016 to January 23, 2016, Major Disaster (Presidential) Declared DR-4261: March 04, 2016, FEMA Id: 4261, Natural disaster type: Snowstorm, Winter Storm
- Maryland Hurricane Sandy, Incident Period: October 26, 2012 to November 08, 2012, Emergency Declared EM-3349: October 28, 2012, FEMA Id: 3349, Natural disaster type: Hurricane
- Maryland Hurricane Sandy, Incident Period: October 26, 2012 to November 04, 2012, Major Disaster (Presidential) Declared DR-4091: November 20, 2012, FEMA Id: 4091, Natural disaster type: Hurricane
- Maryland Severe Storms and Straight-line Winds, Incident Period: June 29, 2012 to July 08, 2012, Major Disaster (Presidential) Declared DR-4075: August 02, 2012, FEMA Id: 4075, Natural disaster type: Storm, Wind
- Maryland Hurricane Irene, Incident Period: August 26, 2011 to September 05, 2011, Emergency Declared EM-3335: August 27, 2011, FEMA Id: 3335, Natural disaster type: Hurricane
- Maryland Hurricane Irene, Incident Period: August 24, 2011 to September 05, 2011, Major Disaster (Presidential) Declared DR-4034: September 16, 2011, FEMA Id: 4034, Natural disaster type: Hurricane
- Maryland Severe Winter Storms and Snowstorms, Incident Period: February 05, 2010 to February 11, 2010, Major Disaster (Presidential) Declared DR-1910: May 06, 2010, FEMA Id: 1910, Natural disaster type: Snowstorm, Winter Storm
- Maryland Hurricane Katrina Evacuation, Incident Period: August 29, 2005 to October 01, 2005, Emergency Declared EM-3251: September 13, 2005, FEMA Id: 3251, Natural disaster type: Hurricane
- Maryland Hurricane Isabel, Incident Period: September 18, 2003 to September 29, 2003, Major Disaster (Presidential) Declared DR-1492: September 19, 2003, FEMA Id: 1492, Natural disaster type: Hurricane
- 10 other natural disasters have been reported since 1953.
The number of natural disasters in Calvert County (20) is greater than the US average (15).
Major Disasters (Presidential) Declared: 15
Emergencies Declared: 5
Causes of natural disasters: Hurricanes: 7, Winter Storms: 5, Snowstorms: 3, Storms: 3, Floods: 2, Tornadoes: 2, Blizzard: 1, Heavy Rain: 1, Ice Storm: 1, Snowfall: 1, Tropical Storm: 1, Wind: 1, Other: 1 (Note: some incidents may be assigned to more than one category).
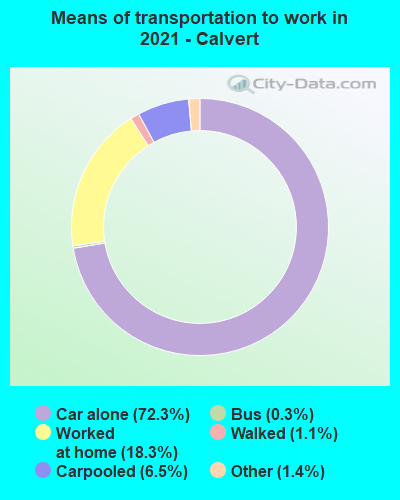
Means of transportation to work:
- Drove a car alone: 19,596 (65.8%)
- Carpooled: 1,805 (6.1%)
- Bus: 63 (0.2%)
- Subway or elevated rail: 11 (0.0%)
- Ferryboat: 30 (0.1%)
- Taxicab, motorcycle, or other means: 412 (1.4%)
- Bicycle: 51 (0.2%)
- Walked: 260 (0.9%)
- Worked at home: 8,257 (27.7%)
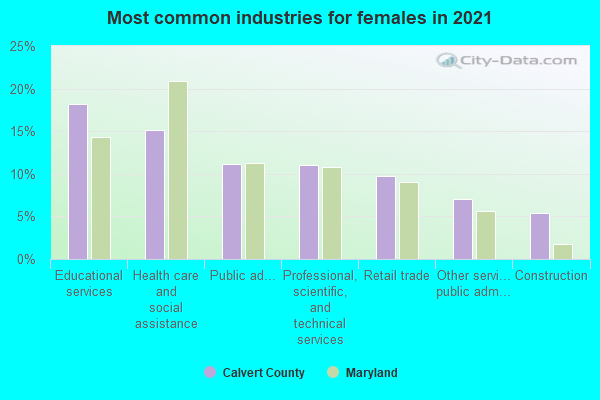
- Health care and social assistance (15%)
- Educational services (13%)
- Public administration (11%)
- Professional, scientific, and technical services (8%)
- Other services, except public administration (7%)
- Accommodation and food services (6%)
- Retail trade (5%)
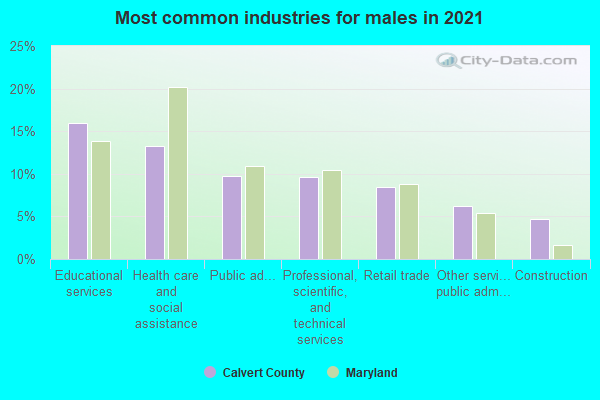
- Health care and social assistance (19%)
- Educational services (16%)
- Public administration (14%)
- Professional, scientific, and technical services (10%)
- Other services, except public administration (8%)
- Accommodation and food services (8%)
- Retail trade (6%)

- Management occupations (17%)
- Computer and mathematical occupations (12%)
- Construction and extraction occupations (10%)
- Installation, maintenance, and repair occupations (10%)
- Sales and related occupations (8%)
- Architecture and engineering occupations (6%)
- Production occupations (6%)
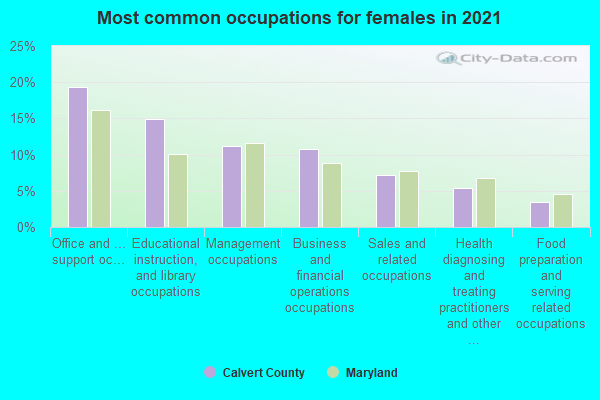
- Management occupations (19%)
- Office and administrative support occupations (17%)
- Educational instruction, and library occupations (11%)
- Business and financial operations occupations (7%)
- Sales and related occupations (6%)
- Personal care and service occupations (6%)
- Food preparation and serving related occupations (5%)
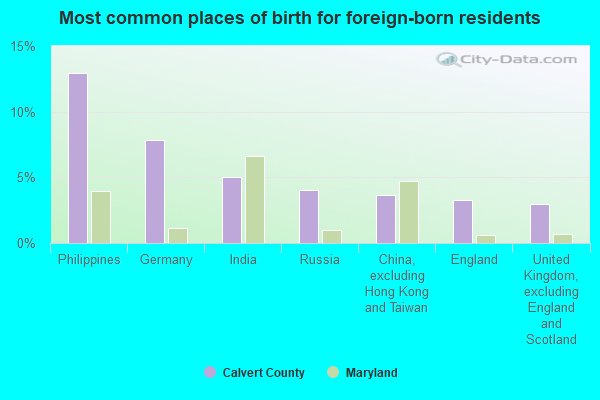
- Philippines (17%)
- Germany (9%)
- India (5%)
- Dominican Republic (5%)
- Russia (4%)
- Canada (4%)
- Honduras (3%)
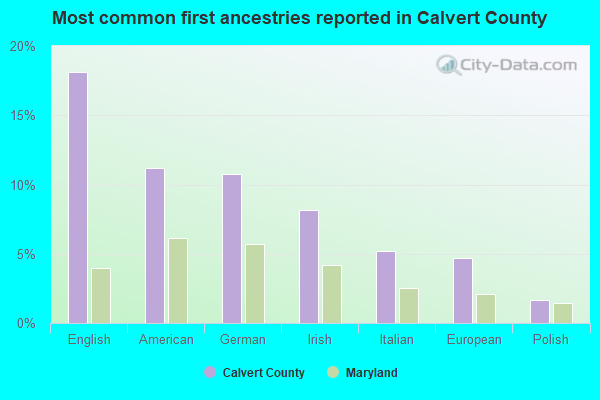
- English (17%)
- American (11%)
- German (11%)
- Irish (8%)
- Italian (5%)
- European (4%)
- Polish (2%)

People in group quarters in Calvert County, Maryland in 2010:
- 277 people in nursing facilities/skilled-nursing facilities
- 261 people in local jails and other municipal confinement facilities
- 45 people in group homes intended for adults
- 42 people in emergency and transitional shelters (with sleeping facilities) for people experiencing homelessness
- 10 people in in-patient hospice facilities
- 7 people in residential treatment centers for adults
- 7 people in other noninstitutional facilities
People in group quarters in Calvert County, Maryland in 2000:
- 323 people in nursing homes
- 136 people in local jails and other confinement facilities (including police lockups)
- 43 people in homes for the physically handicapped
- 41 people in other noninstitutional group quarters
- 21 people in homes for the mentally ill
- 9 people in religious group quarters
- 6 people in other group homes
- 2 people in other nonhousehold living situations
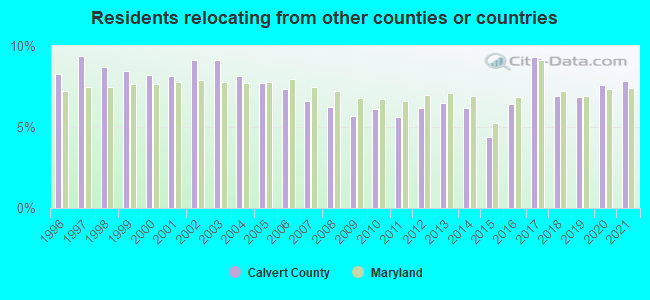
7.84% of this county's 2021 resident taxpayers lived in other counties in 2020 ($80,515 average adjusted gross income)
| Here: | 7.84% |
| Maryland average: | 7.42% |
0.10% of residents moved from foreign countries ($1,116 average AGI)
Calvert County: 0.10% Maryland average: 0.05%
4.62% relocated from other counties in Maryland ($45,227 average AGI)
3.12% relocated from other states ($34,172 average AGI)
Calvert County: 3.12% Maryland average: 3.41%
Top counties from which taxpayers relocated into this county between 2020 and 2021:
| from Anne Arundel County, MD | |
| from Prince George's County, MD | |
| from St. Mary's County, MD | |
| from Charles County, MD | |
| from District of Columbia, DC | |
| from Montgomery County, MD | |
| from Fairfax County, VA |
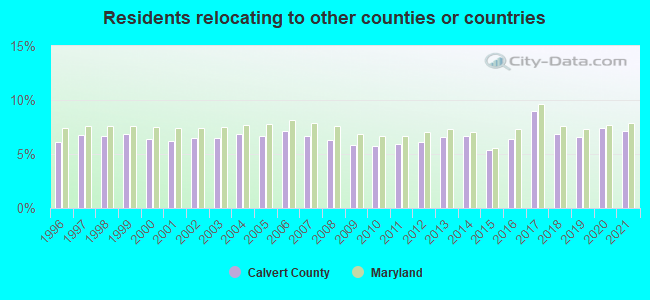
7.12% of this county's 2020 resident taxpayers moved to other counties in 2021 ($84,490 average adjusted gross income)
| Here: | 7.12% |
| Maryland average: | 7.91% |
0.05% of residents moved to foreign countries ($853 average AGI)
Calvert County: 0.05% Maryland average: 0.04%
3.44% relocated to other counties in Maryland ($37,132 average AGI)
3.62% relocated to other states ($46,505 average AGI)
Calvert County: 3.62% Maryland average: 3.93%
Top counties to which taxpayers relocated from this county between 2020 and 2021:
| to St. Mary's County, MD | |
| to Anne Arundel County, MD | |
| to Prince George's County, MD | |
| to Charles County, MD | |
| to Fairfax County, VA | |
| to Montgomery County, MD | |
| to Howard County, MD |
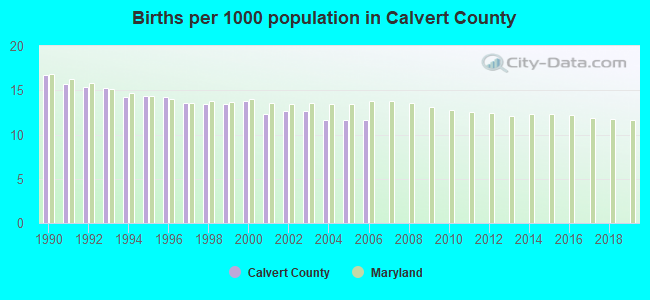
Births per 1000 population from 1990 to 1999: 14.6
Births per 1000 population from 2000 to 2006: 12.3
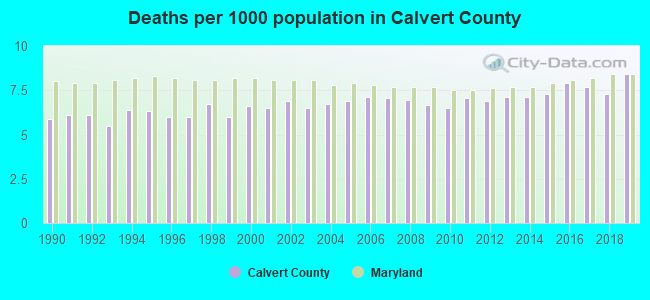
Deaths per 1000 population from 1990 to 1999: 6.1
Deaths per 1000 population from 2000 to 2009: 6.8
Deaths per 1000 population from 2010 to 2020: 7.5
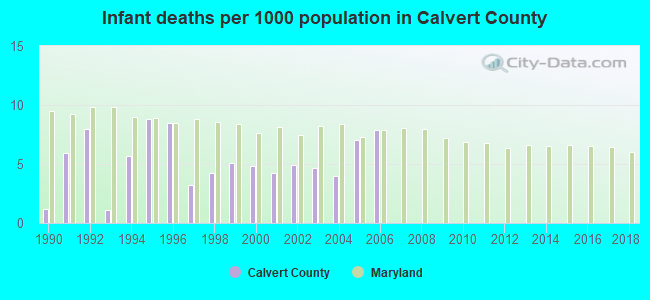
Infant deaths per 1000 live births from 1990 to 1999: 5.2
Infant deaths per 1000 live births from 2000 to 2006: 5.4
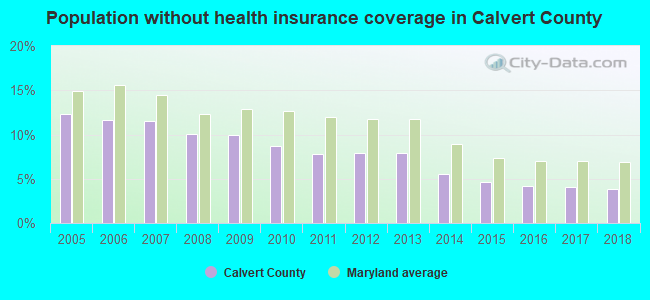
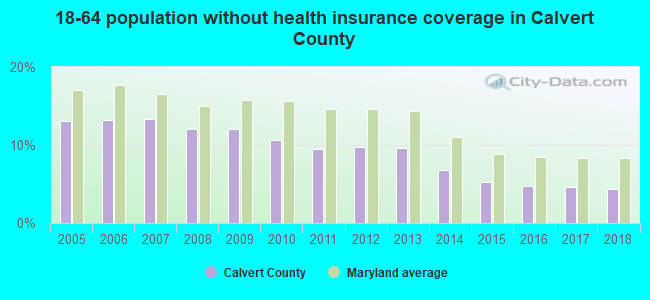
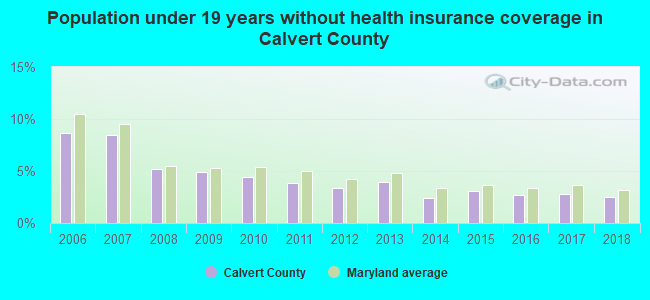
Persons under 19 years old without health insurance coverage in 2018: 2.5%
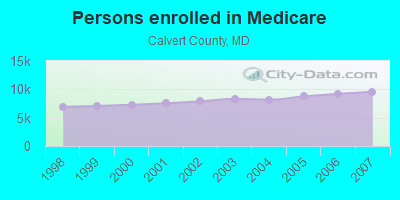
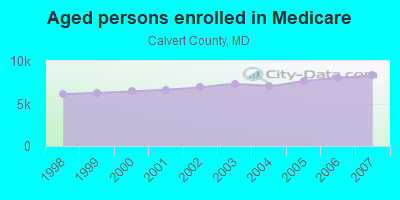
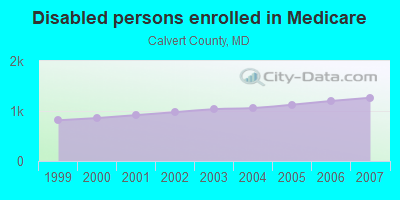
Persons enrolled in hospital insurance and/or supplemental medical insurance (Medicare) in July 1, 2007: 9,576 (8,311 aged, 1,265 disabled)
Children under 18 without health insurance coverage in 2007: 1,490 (6%)
Most common underlying causes of death in Calvert County, Maryland in 1999 - 2019:
- Atherosclerotic cardiovascular disease, so described (916)
- Bronchus or lung, unspecified - Malignant neoplasms (886)
- Atherosclerotic heart disease (681)
- Acute myocardial infarction, unspecified (582)
- Chronic obstructive pulmonary disease, unspecified (545)
- Unspecified dementia (373)
- Stroke, not specified as haemorrhage or infarction (315)
- Alzheimer disease, unspecified (303)
- Breast, unspecified - Malignant neoplasms (247)
- Colon, unspecified - Malignant neoplasms (197)
Population without health insurance coverage in 2000: 11%
Children under 18 without health insurance coverage in 2000: 8%
Short term general hospital admissions per 100,000 population in 2004: 9,043
Short term general hospital beds per 100,000 population in 2004: 136
Emergency room visits per 100,000 population in 2004: 36,350
General practice office based MDs per 100,000 population in 2005: 1,206
Medical specialist MDs per 100,000 population in 2005: 668
Dentists per 100,000 population in 1998: 18
Total births per 100,000 population, July 2005 - July 2006 : 32
Total deaths per 100,000 population, July 2005 - July 2006: 50
Limited-service eating places per 100,000 population in 2005 : 13
Beer, wine & liquor stores per 100,000 population in 2005: 1
Suicides per 1,000,000 population from 2000 to 2006: 99.1. This is more than state average.
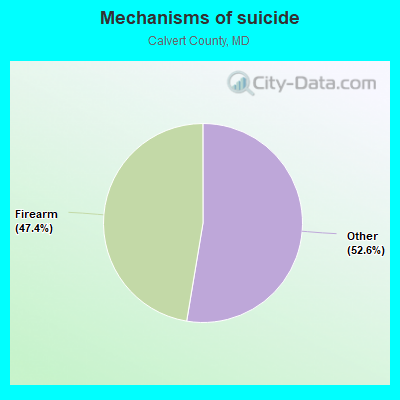
- Firearm - 46.9
- Other - 52.1
Household type by relationship:
Households: 94,573- Male householders: 16,530 (2,509 living alone), Female householders: 17,047 (3,895 living alone)
21,353 spouses (21,251 opposite-sex spouses), 1,350 unmarried partners, (1,350 opposite-sex unmarried partners), 30,950 children (29,160 natural, 216 adopted, 1,574 stepchildren), 746 grandchildren, 1,131 brothers or sisters, 1,135 parents, 0 foster children, 2,205 other relatives, 1,541 non-relatives
- In group quarters: 585
Size of family households: 9,310 2-persons, 6,125 3-persons, 5,490 4-persons, 2,439 5-persons, 1,636 6-persons, 592 7-or-more-persons.
Size of nonfamily households: 6,404 1-person, 1,509 2-persons, 72 3-persons.
17,423 married couples with children.
3,602 single-parent households (1,758 men, 1,844 women).
93.9% of residents of Calvert speak English at home.
2.1% of residents speak Spanish at home (68% speak English very well, 19% speak English well, 8% speak English not well, 5% don't speak English at all).
1.6% of residents speak other Indo-European language at home (86% speak English very well, 13% speak English well).
1.0% of residents speak Asian or Pacific Island language at home (80% speak English very well, 14% speak English well, 4% speak English not well, 2% don't speak English at all).
0.1% of residents speak other language at home (50% speak English very well, 36% speak English well, 14% speak English not well).
In fiscal year 2004:
Federal Government expenditure: $355,016,000 ($4,105 per capita)
Department of Defense expenditure: $43,712,000
Federal direct payments to individuals for retirement and disability: $222,032,000
Federal other direct payments to individuals: $53,479,000
Federal direct payments not to individuals: $6,375,000
Federal grants: $41,620,000
Federal procurement contracts: $14,324,000 ($3,934,000 Department of Defense)
Federal salaries and wages: $17,187,000 ($3,312,000 Department of Defense)
Federal Government direct loans: $3,725,000
Federal guaranteed/insured loans: $149,092,000
Federal Government insurance: $119,077,000
Population change from April 1, 2000 to July 1, 2005:
Births: 5,368| Here: | 61 per 1000 residents |
| State: | 71 per 1000 residents |
Deaths: 2,714
| Here: | 31 per 1000 residents |
| State: | 41 per 1000 residents |
Net international migration: +267
| Here: | +3 per 1000 residents |
| State: | +19 per 1000 residents |
Net internal migration: +10,556
| Here: | +120 per 1000 residents |
| State: | +2 per 1000 residents |
Total withdrawal of fresh water for public supply: 2.30 millions of gallons per day (all from ground)
| Here: | 7.9 |
| State: | 7.3 |
| Here: | 5.0 |
| State: | 4.2 |
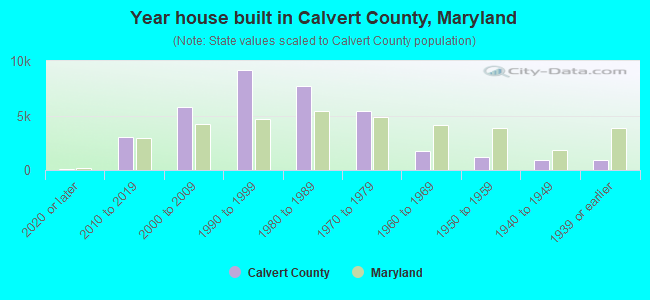
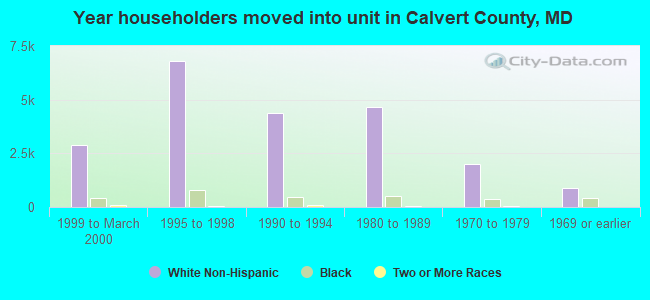
- Year house built in Calvert County, Maryland
- 8962020 or later
- 3,6062010 to 2019
- 6,6102000 to 2009
- 7,4831990 to 1999
- 7,2211980 to 1989
- 6,4051970 to 1979
- 1,4231960 to 1969
- 7811950 to 1959
- 7671940 to 1949
- 1,0481939 or earlier
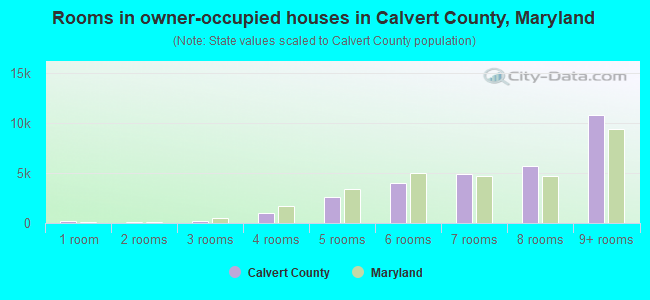
- Rooms in owner-occupied houses in Calvert County, Maryland
- 1181 room
- 332 rooms
- 2133 rooms
- 7884 rooms
- 3,4345 rooms
- 4,9966 rooms
- 3,3007 rooms
- 5,1558 rooms
- 12,3109+ rooms
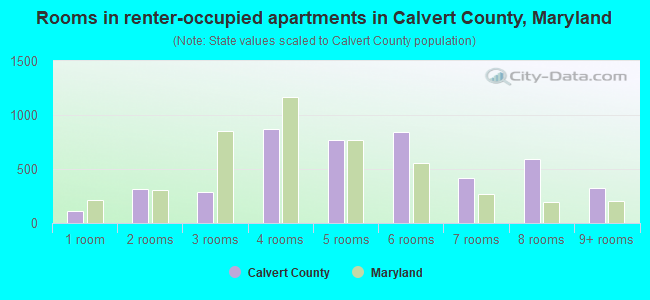
- Rooms in renter-occupied apartments in Calvert County, Maryland
- 491 room
- 2212 rooms
- 4823 rooms
- 2934 rooms
- 1,1235 rooms
- 5556 rooms
- 1017 rooms
- 1108 rooms
- 2969+ rooms
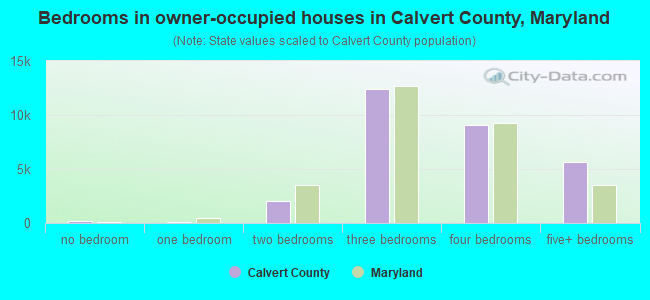
- Bedrooms in owner-occupied houses in Calvert County, Maryland
- 118no bedroom
- 1161 bedroom
- 1,6062 bedrooms
- 11,6873 bedrooms
- 11,8984 bedrooms
- 4,9225+ bedrooms
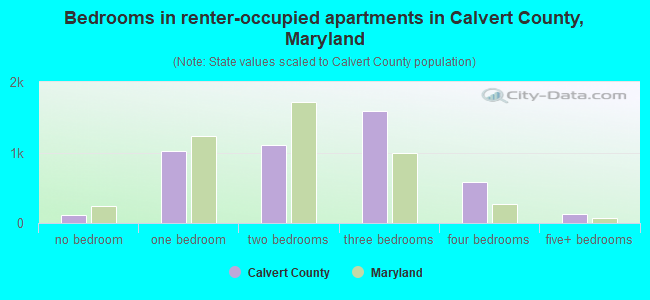
- Bedrooms in renter-occupied apartments in Calvert County, Maryland
- 49no bedroom
- 5821 bedroom
- 1,0382 bedrooms
- 1,2303 bedrooms
- 2144 bedrooms
- 1175+ bedrooms

- Cars and other vehicles available in Calvert County in owner-occupied houses/condos
- 401no vehicle
- 4,6581 vehicle
- 12,6472 vehicles
- 8,0433 vehicles
- 3,8094 vehicles
- 7895+ vehicles
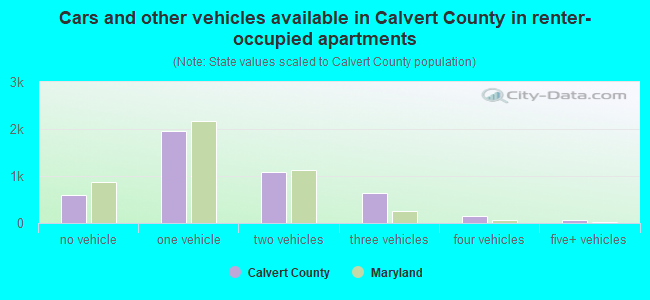
- Cars and other vehicles available in Calvert County in renter-occupied apartments
- 452no vehicle
- 1,6271 vehicle
- 9462 vehicles
- 2053 vehicles
- 04 vehicles
- 05+ vehicles
90.8% of Calvert County residents lived in the same house 1 years ago.
Out of people who lived in different houses, 31% lived in this county.
Out of people who lived in different counties, 67% lived in Maryland.
| Calvert County: | 90.8% |
| State average: | 88.5% |
Place of birth for U.S.-born residents:
- This state: 46,238
- Other state: 42,133
- Northeast: 8,487
- Midwest: 8,168
- South: 21,033
- West: 4,445
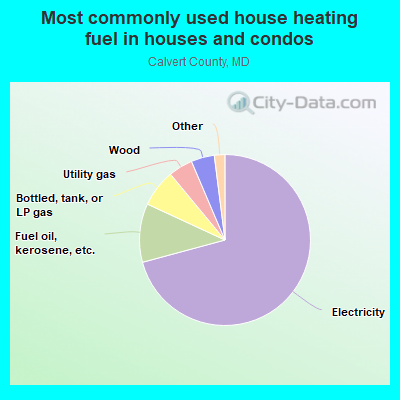
- 70.2%Electricity
- 10.9%Fuel oil, kerosene, etc.
- 7.1%Bottled, tank, or LP gas
- 5.2%Utility gas
- 4.7%Wood
- 0.9%Other fuel
- 0.5%Solar energy
- 0.4%No fuel used
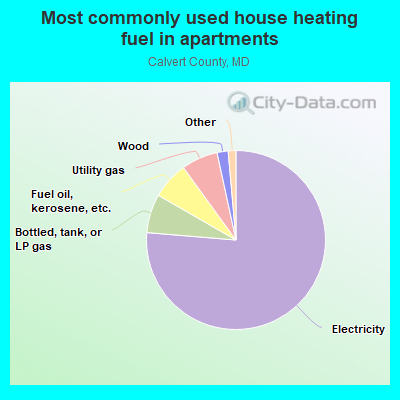
- 74.7%Electricity
- 8.4%Utility gas
- 7.1%Bottled, tank, or LP gas
- 6.7%Fuel oil, kerosene, etc.
- 2.0%Wood
- 0.5%No fuel used
- 0.4%Other fuel
- 0.3%Solar energy
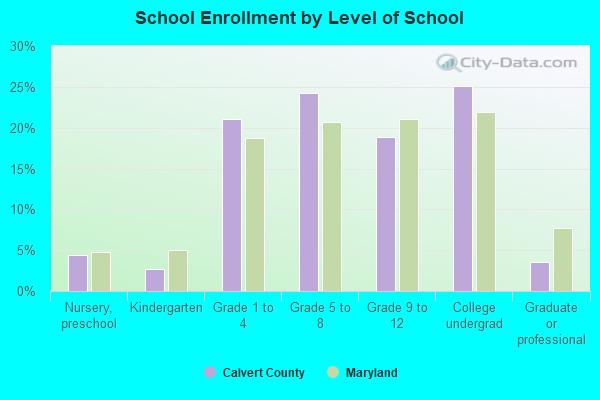
Private vs. public school enrollment:
| Here: | 15.8% |
| Maryland: | 15.2% |
| Here: | 3.7% |
| Maryland: | 14.4% |
| Here: | 11.9% |
| Maryland: | 20.2% |
Calvert County government finances - Expenditure in 2020:
- Bond Funds - Cash and Securities: $13,339,000
Cash and Securities: $11,728,000
- Charges - Solid Waste Management: $12,762,000
Solid Waste Management: $12,368,000
Other: $7,612,000
Other: $7,280,000
Sewerage: $6,003,000
Sewerage: $5,531,000
Parks and Recreation: $2,130,000
Parks and Recreation: $1,780,000
Elementary and Secondary Education School Lunch: $973,000
Elementary and Secondary Education School Lunch: $703,000
Elementary and Secondary Education - Other: $625,000
Elementary and Secondary Education School Tuition and Transportation: $302,000
Elementary and Secondary Education School Tuition and Transportation: $224,000
- Construction - Elementary and Secondary Education: $31,628,000
Elementary and Secondary Education: $14,521,000
Police Protection: $1,478,000
Police Protection: $1,160,000
Regular Highways: $863,000
Regular Highways: $851,000
Local Fire Protection: $792,000
Local Fire Protection: $694,000
Financial Administration: $583,000
General - Other: $467,000
Financial Administration: $460,000
General Public Buildings: $285,000
Parks and Recreation: $257,000
Parks and Recreation: $185,000
General - Other: $157,000
Correctional Institutions: $123,000
Protective Inspection and Regulation - Other: $117,000
Health - Other: $115,000
Judicial and Legal Services: $113,000
General Public Buildings: $100,000
Correctional Institutions: $90,000
Health - Other: $60,000
Natural Resources - Other: $51,000
Central Staff Services: $50,000
Judicial and Legal Services: $27,000
Central Staff Services: $25,000
Protective Inspection and Regulation - Other: $10,000
Corrections - Other: $3,000
Housing and Community Development: $3,000
Natural Resources - Other: $3,000
- Current Operations - Elementary and Secondary Education: $228,316,000
Elementary and Secondary Education: $212,978,000
General - Other: $72,499,000
General - Other: $65,825,000
Police Protection: $29,794,000
Police Protection: $21,623,000
Parks and Recreation: $21,397,000
Parks and Recreation: $20,607,000
Regular Highways: $15,315,000
Regular Highways: $13,888,000
Local Fire Protection: $12,599,000
Solid Waste Management: $12,008,000
Solid Waste Management: $11,914,000
Correctional Institutions: $8,696,000
Correctional Institutions: $7,194,000
Sewerage: $7,164,000
Housing and Community Development: $6,014,000
Financial Administration: $5,818,000
Central Staff Services: $5,216,000
Sewerage: $5,157,000
General Public Buildings: $4,838,000
Financial Administration: $4,829,000
Judicial and Legal Services: $4,797,000
Central Staff Services: $4,491,000
General Public Buildings: $4,448,000
Judicial and Legal Services: $4,320,000
Local Fire Protection: $4,281,000
Water Utilities: $3,386,000
Housing and Community Development: $3,303,000
Health - Other: $3,284,000
Water Utilities: $3,255,000
Health - Other: $3,187,000
Natural Resources - Other: $1,831,000
Transit Utilities: $1,763,000
Transit Utilities: $1,757,000
Natural Resources - Other: $1,581,000
Corrections - Other: $1,271,000
Protective Inspection and Regulation - Other: $285,000
Protective Inspection and Regulation - Other: $189,000
- Federal Intergovernmental - Other: $5,085,000
Education: $3,503,000
Education: $3,246,000
Other: $2,102,000
Transit Utilities: $661,000
Transit Utilities: $486,000
Housing and Community Development: $239,000
Natural Resources: $45,000
Housing and Community Development: $40,000
Natural Resources: $6,000
- General - Interest on Debt: $7,413,000
Interest on Debt: $6,697,000
- Intergovernmental to Local - Other - Elementary and Secondary Education: $2,312,000
Other - Elementary and Secondary Education: $1,826,000
- Local Intergovernmental - Other: $3,191,000
Other: $2,877,000
- Long Term Debt - Beginning Outstanding - Unspecified Public Purpose: $171,791,000
Outstanding Unspecified Public Purpose: $156,299,000
Outstanding Unspecified Public Purpose: $145,235,000
Beginning Outstanding - Unspecified Public Purpose: $136,752,000
Issue, Unspecified Public Purpose: $24,156,000
Retired Unspecified Public Purpose: $15,674,000
Retired Unspecified Public Purpose: $15,492,000
- Miscellaneous - General Revenue - Other: $12,265,000
General Revenue - Other: $8,520,000
Interest Earnings: $2,671,000
Interest Earnings: $1,348,000
Fines and Forfeits: $585,000
Fines and Forfeits: $509,000
- Other Capital Outlay - Elementary and Secondary Education: $7,616,000
Elementary and Secondary Education: $5,007,000
- Other Funds - Cash and Securities: $156,559,000
Cash and Securities: $120,725,000
- Revenue - Water Utilities: $3,232,000
Water Utilities: $2,998,000
- State Intergovernmental - Education: $103,392,000
Education: $100,192,000
Other: $4,366,000
Other: $3,893,000
Highways: $1,185,000
Highways: $887,000
Housing and Community Development: $545,000
Transit Utilities: $246,000
Transit Utilities: $241,000
Housing and Community Development: $38,000
- Tax - Property: $195,241,000
Property: $174,096,000
Individual Income: $94,424,000
Individual Income: $83,786,000
Documentary and Stock Transfer: $8,623,000
Documentary and Stock Transfer: $8,470,000
Other Selective Sales: $6,713,000
Public Utility License: $1,582,000
Public Utility License: $1,238,000
Other Selective Sales: $900,000
Alcoholic Beverage License: $111,000
Occupation and Business License - Other: $102,000
Occupation and Business License - Other: $78,000
Other License: $73,000
Other License: $64,000
Alcoholic Beverage License: $51,000
Amusements Sales: $24,000
Amusements Sales: $21,000
- Total Salaries and Wages: $186,923,000
: $166,347,000
Calvert County government finances - Revenue in 2020:
- Bond Funds - Cash and Securities: $13,339,000
Cash and Securities: $11,728,000
- Charges - Solid Waste Management: $12,762,000
Solid Waste Management: $12,368,000
Other: $7,612,000
Other: $7,280,000
Sewerage: $6,003,000
Sewerage: $5,531,000
Parks and Recreation: $2,130,000
Parks and Recreation: $1,780,000
Elementary and Secondary Education School Lunch: $973,000
Elementary and Secondary Education School Lunch: $703,000
Elementary and Secondary Education - Other: $625,000
Elementary and Secondary Education School Tuition and Transportation: $302,000
Elementary and Secondary Education School Tuition and Transportation: $224,000
- Construction - Elementary and Secondary Education: $31,628,000
Elementary and Secondary Education: $14,521,000
Police Protection: $1,478,000
Police Protection: $1,160,000
Regular Highways: $863,000
Regular Highways: $851,000
Local Fire Protection: $792,000
Local Fire Protection: $694,000
Financial Administration: $583,000
General - Other: $467,000
Financial Administration: $460,000
General Public Buildings: $285,000
Parks and Recreation: $257,000
Parks and Recreation: $185,000
General - Other: $157,000
Correctional Institutions: $123,000
Protective Inspection and Regulation - Other: $117,000
Health - Other: $115,000
Judicial and Legal Services: $113,000
General Public Buildings: $100,000
Correctional Institutions: $90,000
Health - Other: $60,000
Natural Resources - Other: $51,000
Central Staff Services: $50,000
Judicial and Legal Services: $27,000
Central Staff Services: $25,000
Protective Inspection and Regulation - Other: $10,000
Corrections - Other: $3,000
Housing and Community Development: $3,000
Natural Resources - Other: $3,000
- Current Operations - Elementary and Secondary Education: $228,316,000
Elementary and Secondary Education: $212,978,000
General - Other: $72,499,000
General - Other: $65,825,000
Police Protection: $29,794,000
Police Protection: $21,623,000
Parks and Recreation: $21,397,000
Parks and Recreation: $20,607,000
Regular Highways: $15,315,000
Regular Highways: $13,888,000
Local Fire Protection: $12,599,000
Solid Waste Management: $12,008,000
Solid Waste Management: $11,914,000
Correctional Institutions: $8,696,000
Correctional Institutions: $7,194,000
Sewerage: $7,164,000
Housing and Community Development: $6,014,000
Financial Administration: $5,818,000
Central Staff Services: $5,216,000
Sewerage: $5,157,000
General Public Buildings: $4,838,000
Financial Administration: $4,829,000
Judicial and Legal Services: $4,797,000
Central Staff Services: $4,491,000
General Public Buildings: $4,448,000
Judicial and Legal Services: $4,320,000
Local Fire Protection: $4,281,000
Water Utilities: $3,386,000
Housing and Community Development: $3,303,000
Health - Other: $3,284,000
Water Utilities: $3,255,000
Health - Other: $3,187,000
Natural Resources - Other: $1,831,000
Transit Utilities: $1,763,000
Transit Utilities: $1,757,000
Natural Resources - Other: $1,581,000
Corrections - Other: $1,271,000
Protective Inspection and Regulation - Other: $285,000
Protective Inspection and Regulation - Other: $189,000
- Federal Intergovernmental - Other: $5,085,000
Education: $3,503,000
Education: $3,246,000
Other: $2,102,000
Transit Utilities: $661,000
Transit Utilities: $486,000
Housing and Community Development: $239,000
Natural Resources: $45,000
Housing and Community Development: $40,000
Natural Resources: $6,000
- General - Interest on Debt: $7,413,000
Interest on Debt: $6,697,000
- Intergovernmental to Local - Other - Elementary and Secondary Education: $2,312,000
Other - Elementary and Secondary Education: $1,826,000
- Local Intergovernmental - Other: $3,191,000
Other: $2,877,000
- Long Term Debt - Beginning Outstanding - Unspecified Public Purpose: $171,791,000
Outstanding Unspecified Public Purpose: $156,299,000
Outstanding Unspecified Public Purpose: $145,235,000
Beginning Outstanding - Unspecified Public Purpose: $136,752,000
Issue, Unspecified Public Purpose: $24,156,000
Retired Unspecified Public Purpose: $15,674,000
Retired Unspecified Public Purpose: $15,492,000
- Miscellaneous - General Revenue - Other: $12,265,000
General Revenue - Other: $8,520,000
Interest Earnings: $2,671,000
Interest Earnings: $1,348,000
Fines and Forfeits: $585,000
Fines and Forfeits: $509,000
- Other Capital Outlay - Elementary and Secondary Education: $7,616,000
Elementary and Secondary Education: $5,007,000
- Other Funds - Cash and Securities: $156,559,000
Cash and Securities: $120,725,000
- Revenue - Water Utilities: $3,232,000
Water Utilities: $2,998,000
- State Intergovernmental - Education: $103,392,000
Education: $100,192,000
Other: $4,366,000
Other: $3,893,000
Highways: $1,185,000
Highways: $887,000
Housing and Community Development: $545,000
Transit Utilities: $246,000
Transit Utilities: $241,000
Housing and Community Development: $38,000
- Tax - Property: $195,241,000
Property: $174,096,000
Individual Income: $94,424,000
Individual Income: $83,786,000
Documentary and Stock Transfer: $8,623,000
Documentary and Stock Transfer: $8,470,000
Other Selective Sales: $6,713,000
Public Utility License: $1,582,000
Public Utility License: $1,238,000
Other Selective Sales: $900,000
Alcoholic Beverage License: $111,000
Occupation and Business License - Other: $102,000
Occupation and Business License - Other: $78,000
Other License: $73,000
Other License: $64,000
Alcoholic Beverage License: $51,000
Amusements Sales: $24,000
Amusements Sales: $21,000
- Total Salaries and Wages: $186,923,000
: $166,347,000
Calvert County government finances - Debt in 2020:
- Bond Funds - Cash and Securities: $13,339,000
Cash and Securities: $11,728,000
- Charges - Solid Waste Management: $12,762,000
Solid Waste Management: $12,368,000
Other: $7,612,000
Other: $7,280,000
Sewerage: $6,003,000
Sewerage: $5,531,000
Parks and Recreation: $2,130,000
Parks and Recreation: $1,780,000
Elementary and Secondary Education School Lunch: $973,000
Elementary and Secondary Education School Lunch: $703,000
Elementary and Secondary Education - Other: $625,000
Elementary and Secondary Education School Tuition and Transportation: $302,000
Elementary and Secondary Education School Tuition and Transportation: $224,000
- Construction - Elementary and Secondary Education: $31,628,000
Elementary and Secondary Education: $14,521,000
Police Protection: $1,478,000
Police Protection: $1,160,000
Regular Highways: $863,000
Regular Highways: $851,000
Local Fire Protection: $792,000
Local Fire Protection: $694,000
Financial Administration: $583,000
General - Other: $467,000
Financial Administration: $460,000
General Public Buildings: $285,000
Parks and Recreation: $257,000
Parks and Recreation: $185,000
General - Other: $157,000
Correctional Institutions: $123,000
Protective Inspection and Regulation - Other: $117,000
Health - Other: $115,000
Judicial and Legal Services: $113,000
General Public Buildings: $100,000
Correctional Institutions: $90,000
Health - Other: $60,000
Natural Resources - Other: $51,000
Central Staff Services: $50,000
Judicial and Legal Services: $27,000
Central Staff Services: $25,000
Protective Inspection and Regulation - Other: $10,000
Corrections - Other: $3,000
Housing and Community Development: $3,000
Natural Resources - Other: $3,000
- Current Operations - Elementary and Secondary Education: $228,316,000
Elementary and Secondary Education: $212,978,000
General - Other: $72,499,000
General - Other: $65,825,000
Police Protection: $29,794,000
Police Protection: $21,623,000
Parks and Recreation: $21,397,000
Parks and Recreation: $20,607,000
Regular Highways: $15,315,000
Regular Highways: $13,888,000
Local Fire Protection: $12,599,000
Solid Waste Management: $12,008,000
Solid Waste Management: $11,914,000
Correctional Institutions: $8,696,000
Correctional Institutions: $7,194,000
Sewerage: $7,164,000
Housing and Community Development: $6,014,000
Financial Administration: $5,818,000
Central Staff Services: $5,216,000
Sewerage: $5,157,000
General Public Buildings: $4,838,000
Financial Administration: $4,829,000
Judicial and Legal Services: $4,797,000
Central Staff Services: $4,491,000
General Public Buildings: $4,448,000
Judicial and Legal Services: $4,320,000
Local Fire Protection: $4,281,000
Water Utilities: $3,386,000
Housing and Community Development: $3,303,000
Health - Other: $3,284,000
Water Utilities: $3,255,000
Health - Other: $3,187,000
Natural Resources - Other: $1,831,000
Transit Utilities: $1,763,000
Transit Utilities: $1,757,000
Natural Resources - Other: $1,581,000
Corrections - Other: $1,271,000
Protective Inspection and Regulation - Other: $285,000
Protective Inspection and Regulation - Other: $189,000
- Federal Intergovernmental - Other: $5,085,000
Education: $3,503,000
Education: $3,246,000
Other: $2,102,000
Transit Utilities: $661,000
Transit Utilities: $486,000
Housing and Community Development: $239,000
Natural Resources: $45,000
Housing and Community Development: $40,000
Natural Resources: $6,000
- General - Interest on Debt: $7,413,000
Interest on Debt: $6,697,000
- Intergovernmental to Local - Other - Elementary and Secondary Education: $2,312,000
Other - Elementary and Secondary Education: $1,826,000
- Local Intergovernmental - Other: $3,191,000
Other: $2,877,000
- Long Term Debt - Beginning Outstanding - Unspecified Public Purpose: $171,791,000
Outstanding Unspecified Public Purpose: $156,299,000
Outstanding Unspecified Public Purpose: $145,235,000
Beginning Outstanding - Unspecified Public Purpose: $136,752,000
Issue, Unspecified Public Purpose: $24,156,000
Retired Unspecified Public Purpose: $15,674,000
Retired Unspecified Public Purpose: $15,492,000
- Miscellaneous - General Revenue - Other: $12,265,000
General Revenue - Other: $8,520,000
Interest Earnings: $2,671,000
Interest Earnings: $1,348,000
Fines and Forfeits: $585,000
Fines and Forfeits: $509,000
- Other Capital Outlay - Elementary and Secondary Education: $7,616,000
Elementary and Secondary Education: $5,007,000
- Other Funds - Cash and Securities: $156,559,000
Cash and Securities: $120,725,000
- Revenue - Water Utilities: $3,232,000
Water Utilities: $2,998,000
- State Intergovernmental - Education: $103,392,000
Education: $100,192,000
Other: $4,366,000
Other: $3,893,000
Highways: $1,185,000
Highways: $887,000
Housing and Community Development: $545,000
Transit Utilities: $246,000
Transit Utilities: $241,000
Housing and Community Development: $38,000
- Tax - Property: $195,241,000
Property: $174,096,000
Individual Income: $94,424,000
Individual Income: $83,786,000
Documentary and Stock Transfer: $8,623,000
Documentary and Stock Transfer: $8,470,000
Other Selective Sales: $6,713,000
Public Utility License: $1,582,000
Public Utility License: $1,238,000
Other Selective Sales: $900,000
Alcoholic Beverage License: $111,000
Occupation and Business License - Other: $102,000
Occupation and Business License - Other: $78,000
Other License: $73,000
Other License: $64,000
Alcoholic Beverage License: $51,000
Amusements Sales: $24,000
Amusements Sales: $21,000
- Total Salaries and Wages: $186,923,000
: $166,347,000
Calvert County government finances - Cash and Securities in 2020:
- Bond Funds - Cash and Securities: $13,339,000
Cash and Securities: $11,728,000
- Charges - Solid Waste Management: $12,762,000
Solid Waste Management: $12,368,000
Other: $7,612,000
Other: $7,280,000
Sewerage: $6,003,000
Sewerage: $5,531,000
Parks and Recreation: $2,130,000
Parks and Recreation: $1,780,000
Elementary and Secondary Education School Lunch: $973,000
Elementary and Secondary Education School Lunch: $703,000
Elementary and Secondary Education - Other: $625,000
Elementary and Secondary Education School Tuition and Transportation: $302,000
Elementary and Secondary Education School Tuition and Transportation: $224,000
- Construction - Elementary and Secondary Education: $31,628,000
Elementary and Secondary Education: $14,521,000
Police Protection: $1,478,000
Police Protection: $1,160,000
Regular Highways: $863,000
Regular Highways: $851,000
Local Fire Protection: $792,000
Local Fire Protection: $694,000
Financial Administration: $583,000
General - Other: $467,000
Financial Administration: $460,000
General Public Buildings: $285,000
Parks and Recreation: $257,000
Parks and Recreation: $185,000
General - Other: $157,000
Correctional Institutions: $123,000
Protective Inspection and Regulation - Other: $117,000
Health - Other: $115,000
Judicial and Legal Services: $113,000
General Public Buildings: $100,000
Correctional Institutions: $90,000
Health - Other: $60,000
Natural Resources - Other: $51,000
Central Staff Services: $50,000
Judicial and Legal Services: $27,000
Central Staff Services: $25,000
Protective Inspection and Regulation - Other: $10,000
Corrections - Other: $3,000
Housing and Community Development: $3,000
Natural Resources - Other: $3,000
- Current Operations - Elementary and Secondary Education: $228,316,000
Elementary and Secondary Education: $212,978,000
General - Other: $72,499,000
General - Other: $65,825,000
Police Protection: $29,794,000
Police Protection: $21,623,000
Parks and Recreation: $21,397,000
Parks and Recreation: $20,607,000
Regular Highways: $15,315,000
Regular Highways: $13,888,000
Local Fire Protection: $12,599,000
Solid Waste Management: $12,008,000
Solid Waste Management: $11,914,000
Correctional Institutions: $8,696,000
Correctional Institutions: $7,194,000
Sewerage: $7,164,000
Housing and Community Development: $6,014,000
Financial Administration: $5,818,000
Central Staff Services: $5,216,000
Sewerage: $5,157,000
General Public Buildings: $4,838,000
Financial Administration: $4,829,000
Judicial and Legal Services: $4,797,000
Central Staff Services: $4,491,000
General Public Buildings: $4,448,000
Judicial and Legal Services: $4,320,000
Local Fire Protection: $4,281,000
Water Utilities: $3,386,000
Housing and Community Development: $3,303,000
Health - Other: $3,284,000
Water Utilities: $3,255,000
Health - Other: $3,187,000
Natural Resources - Other: $1,831,000
Transit Utilities: $1,763,000
Transit Utilities: $1,757,000
Natural Resources - Other: $1,581,000
Corrections - Other: $1,271,000
Protective Inspection and Regulation - Other: $285,000
Protective Inspection and Regulation - Other: $189,000
- Federal Intergovernmental - Other: $5,085,000
Education: $3,503,000
Education: $3,246,000
Other: $2,102,000
Transit Utilities: $661,000
Transit Utilities: $486,000
Housing and Community Development: $239,000
Natural Resources: $45,000
Housing and Community Development: $40,000
Natural Resources: $6,000
- General - Interest on Debt: $7,413,000
Interest on Debt: $6,697,000
- Intergovernmental to Local - Other - Elementary and Secondary Education: $2,312,000
Other - Elementary and Secondary Education: $1,826,000
- Local Intergovernmental - Other: $3,191,000
Other: $2,877,000
- Long Term Debt - Beginning Outstanding - Unspecified Public Purpose: $171,791,000
Outstanding Unspecified Public Purpose: $156,299,000
Outstanding Unspecified Public Purpose: $145,235,000
Beginning Outstanding - Unspecified Public Purpose: $136,752,000
Issue, Unspecified Public Purpose: $24,156,000
Retired Unspecified Public Purpose: $15,674,000
Retired Unspecified Public Purpose: $15,492,000
- Miscellaneous - General Revenue - Other: $12,265,000
General Revenue - Other: $8,520,000
Interest Earnings: $2,671,000
Interest Earnings: $1,348,000
Fines and Forfeits: $585,000
Fines and Forfeits: $509,000
- Other Capital Outlay - Elementary and Secondary Education: $7,616,000
Elementary and Secondary Education: $5,007,000
- Other Funds - Cash and Securities: $156,559,000
Cash and Securities: $120,725,000
- Revenue - Water Utilities: $3,232,000
Water Utilities: $2,998,000
- State Intergovernmental - Education: $103,392,000
Education: $100,192,000
Other: $4,366,000
Other: $3,893,000
Highways: $1,185,000
Highways: $887,000
Housing and Community Development: $545,000
Transit Utilities: $246,000
Transit Utilities: $241,000
Housing and Community Development: $38,000
- Tax - Property: $195,241,000
Property: $174,096,000
Individual Income: $94,424,000
Individual Income: $83,786,000
Documentary and Stock Transfer: $8,623,000
Documentary and Stock Transfer: $8,470,000
Other Selective Sales: $6,713,000
Public Utility License: $1,582,000
Public Utility License: $1,238,000
Other Selective Sales: $900,000
Alcoholic Beverage License: $111,000
Occupation and Business License - Other: $102,000
Occupation and Business License - Other: $78,000
Other License: $73,000
Other License: $64,000
Alcoholic Beverage License: $51,000
Amusements Sales: $24,000
Amusements Sales: $21,000
- Total Salaries and Wages: $186,923,000
: $166,347,000
Supplemental Security Income (SSI) in 2006:
- Total number of recipients: 726
- Number of aged recipients: 92
- Number of blind and disabled recipients: 634
- Number of recipients under 18: 58
- Number of recipients between 18 and 64: 491
- Number of recipients older than 64: 177
- Number of recipients also receiving OASDI: 251
- Amount of payments (thousands of dollars): 349
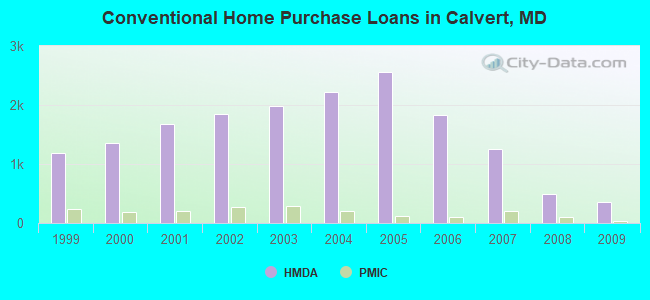
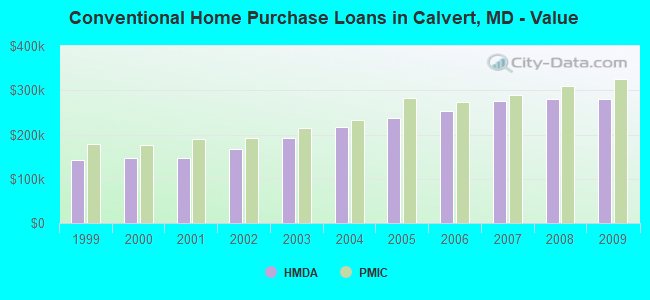
| Home Mortgage Disclosure Act Aggregated Statistics For Year 2009 (Based on 17 full tracts) | ||||||||||||||
| A) FHA, FSA/RHS & VA Home Purchase Loans | B) Conventional Home Purchase Loans | C) Refinancings | D) Home Improvement Loans | E) Loans on Dwellings For 5+ Families | F) Non-occupant Loans on < 5 Family Dwellings (A B C & D) | G) Loans On Manufactured Home Dwelling (A B C & D) | ||||||||
|---|---|---|---|---|---|---|---|---|---|---|---|---|---|---|
| Number | Average Value | Number | Average Value | Number | Average Value | Number | Average Value | Number | Average Value | Number | Average Value | Number | Average Value | |
| LOANS ORIGINATED | 602 | $299,663 | 358 | $279,293 | 3,272 | $273,336 | 158 | $150,430 | 1 | $2,000,000 | 200 | $235,615 | 2 | $345,500 |
| APPLICATIONS APPROVED, NOT ACCEPTED | 12 | $316,333 | 21 | $344,667 | 245 | $290,604 | 28 | $84,179 | 0 | $0 | 17 | $275,647 | 0 | $0 |
| APPLICATIONS DENIED | 67 | $264,866 | 55 | $300,527 | 1,015 | $301,332 | 101 | $104,663 | 0 | $0 | 75 | $253,400 | 15 | $116,667 |
| APPLICATIONS WITHDRAWN | 57 | $265,211 | 44 | $330,750 | 693 | $301,690 | 37 | $154,541 | 1 | $1,500,000 | 52 | $278,481 | 2 | $427,000 |
| FILES CLOSED FOR INCOMPLETENESS | 14 | $248,143 | 8 | $229,250 | 139 | $295,417 | 14 | $145,857 | 0 | $0 | 16 | $222,062 | 0 | $0 |
| Private Mortgage Insurance Companies Aggregated Statistics For Year 2009 (Based on 17 full tracts) | ||||||
| A) Conventional Home Purchase Loans | B) Refinancings | C) Non-occupant Loans on < 5 Family Dwellings (A & B) | ||||
|---|---|---|---|---|---|---|
| Number | Average Value | Number | Average Value | Number | Average Value | |
| LOANS ORIGINATED | 31 | $324,355 | 57 | $329,333 | 3 | $287,333 |
| APPLICATIONS APPROVED, NOT ACCEPTED | 15 | $367,133 | 27 | $348,926 | 0 | $0 |
| APPLICATIONS DENIED | 13 | $316,462 | 26 | $375,731 | 0 | $0 |
| APPLICATIONS WITHDRAWN | 4 | $368,250 | 5 | $379,200 | 0 | $0 |
| FILES CLOSED FOR INCOMPLETENESS | 2 | $347,000 | 0 | $0 | 0 | $0 |
| Most common first names in Calvert County, MD among deceased individuals | ||
| Name | Count | Lived (average) |
|---|---|---|
| John | 307 | 73.9 years |
| Mary | 300 | 79.0 years |
| William | 299 | 73.9 years |
| James | 254 | 71.4 years |
| Robert | 175 | 70.6 years |
| Charles | 159 | 72.3 years |
| George | 146 | 75.6 years |
| Joseph | 142 | 74.3 years |
| Thomas | 129 | 74.0 years |
| Margaret | 121 | 79.0 years |
| Most common last names in Calvert County, MD among deceased individuals | ||
| Last name | Count | Lived (average) |
|---|---|---|
| Jones | 140 | 73.1 years |
| Bowen | 137 | 77.1 years |
| Smith | 126 | 74.2 years |
| Johnson | 87 | 74.3 years |
| Brown | 71 | 75.2 years |
| King | 68 | 78.4 years |
| Gross | 64 | 70.7 years |
| Thomas | 58 | 71.3 years |
| Gray | 50 | 77.5 years |
| Brooks | 48 | 73.2 years |
| Businesses in Calvert County, MD | ||||
| Name | Count | Name | Count | |
|---|---|---|---|---|
| 7-Eleven | 8 | Office Depot | 1 | |
| AT&T | 2 | Outback | 1 | |
| Ace Hardware | 2 | Outback Steakhouse | 1 | |
| Advance Auto Parts | 2 | Panera Bread | 1 | |
| Applebee's | 1 | Papa John's Pizza | 4 | |
| Arby's | 2 | Payless | 1 | |
| AutoZone | 2 | Penske | 1 | |
| Baskin-Robbins | 1 | Pizza Hut | 2 | |
| Blockbuster | 2 | Quiznos | 1 | |
| CVS | 2 | RadioShack | 2 | |
| Chevrolet | 1 | Rite Aid | 1 | |
| Comfort Inn | 1 | Ruby Tuesday | 1 | |
| Curves | 1 | SAS Shoes | 1 | |
| DHL | 1 | Safeway | 2 | |
| Domino's Pizza | 4 | Sears | 1 | |
| Dunkin Donuts | 1 | Starbucks | 5 | |
| Fashion Bug | 1 | Subway | 5 | |
| FedEx | 9 | Super 8 | 1 | |
| Ford | 1 | T-Mobile | 2 | |
| GNC | 1 | Taco Bell | 2 | |
| GameStop | 2 | The Room Place | 1 | |
| Giant | 3 | Toyota | 1 | |
| H&R Block | 3 | True Value | 1 | |
| Hilton | 1 | U-Haul | 5 | |
| Holiday Inn | 2 | UPS | 9 | |
| IHOP | 1 | Verizon Wireless | 1 | |
| KFC | 2 | Vons | 2 | |
| Kmart | 1 | Walgreens | 2 | |
| Marriott | 1 | Walmart | 2 | |
| MasterBrand Cabinets | 4 | Wendy's | 1 | |
| McDonald's | 4 | World Gym | 2 | |
| Nike | 4 | |||
Calvert County on our top lists:
- #34 on the list of "Top 101 counties with the lowest total withdrawal of fresh water for public supply (pop. 50,000+)"
- #80 on the list of "Top 101 counties with the highest percentage of residents that visited a dentist within the past year"
- #95 on the list of "Top 101 counties with the largest number of children under 18 without health insurance coverage in 2000 (pop. 50,000+)"
- #100 on the list of "Top 101 counties with the highest percentage of residents relocating from foreign countries between 2010 and 2011 (pop. 50,000+)"