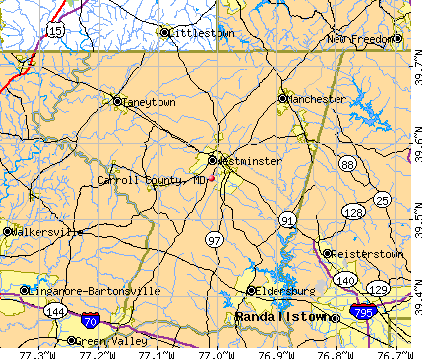
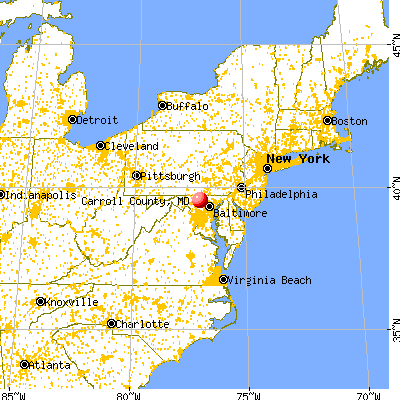
Carroll County, Maryland (MD)
County owner-occupied free and clear houses and condos in 2010: 10,788
County owner-occupied houses and condos in 2000: 43,037
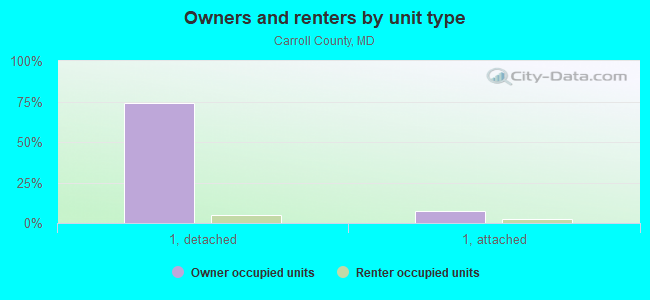
Renter-occupied apartments: 10,758 (it was 9,466 in 2000)
| % of renters here: | 18% |
| State: | 32% |
Land area: 449 sq. mi.
Water area: 3.3 sq. mi.
Population density: 390 people per square mile (high).
Industries providing employment: Educational, health and social services (24.8%), Professional, scientific, management, administrative, and waste management services (13.7%), Construction (10.2%).
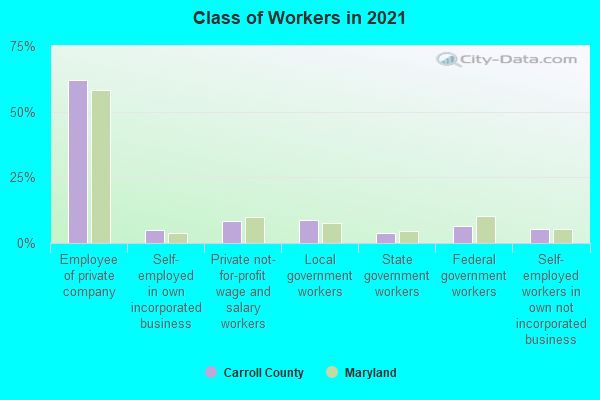
Type of workers:
- Private wage or salary: 74%
- Government: 20%
- Self-employed, not incorporated: 6%
- Unpaid family work: 0%
- OSM Map
- General Map
- Google Map
- MSN Map

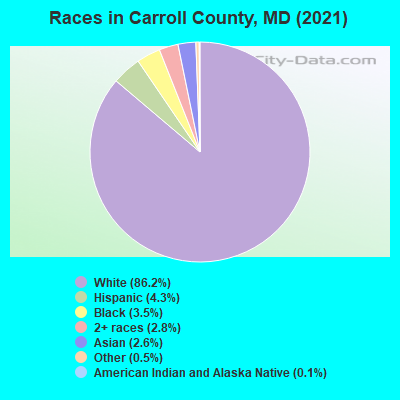
- 147,38984.1%White Non-Hispanic Alone
- 8,1224.6%Hispanic or Latino
- 7,1324.1%Two or more races
- 6,5943.8%Black Non-Hispanic Alone
- 3,5322.0%Asian alone
- 2,4621.4%Some other race alone
- 740.04%American Indian and Alaska Native alone
| Median resident age: | 41.3 years |
| Maryland median age: | 39.7 years |
| Males: 87,880 | |
| Females: 87,425 |


| Carroll County: | 2.0 people |
| Maryland: | 3 people |
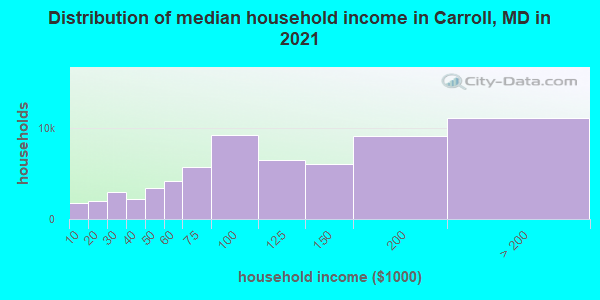
Estimated median household income in 2022: $104,942 ($60,021 in 1999)
| This county: | $104,942 |
| Maryland: | $94,991 |
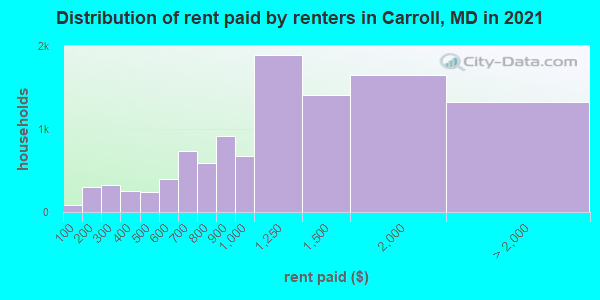
Median contract rent in 2022 for apartments: $1,090 (lower quartile is $797, upper quartile is $1,486)
| This county: | $1090 |
| State: | $1388 |
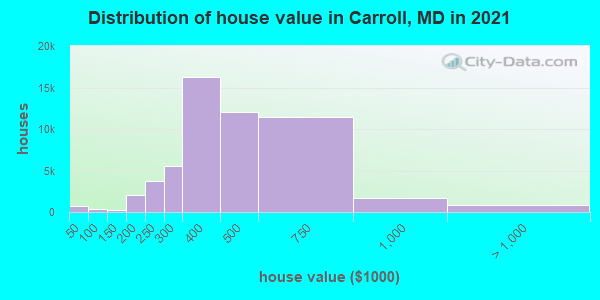
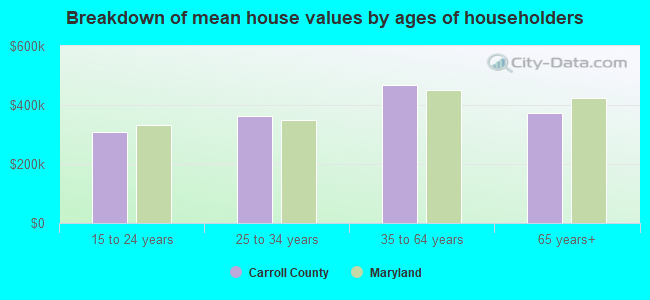
Estimated median house or condo value in 2022: $415,800 (it was $163,300 in 2000)
| Carroll: | $415,800 |
| Maryland: | $398,100 |
Mean price in 2022:
Median monthly housing costs for homes and condos with a mortgage: $2,112Detached houses: $459,464
Here: $459,464 State: $526,819 Townhouses or other attached units: $306,699
Here: $306,699 State: $328,305 In 2-unit structures: $253,074
Here: $253,074 State: $346,599 In 3-to-4-unit structures: $406,896
Here: $406,896 State: $295,378 In 5-or-more-unit structures: $226,520
Here: $226,520 State: $350,378 Mobile homes: $39,227
Here: $39,227 State: $89,353
Median monthly housing costs for units without a mortgage: $580
Institutionalized population: 1,966
Crime in 2020 (reported by the sheriff's office or county police, not the county total):
- Murders: 2
- Rapes: 19
- Robberies: 4
- Assaults: 42
- Burglaries: 51
- Thefts: 259
- Auto thefts: 11
Crime in 2019 (reported by the sheriff's office or county police, not the county total):
- Murders: 1
- Rapes: 25
- Robberies: 9
- Assaults: 69
- Burglaries: 86
- Thefts: 479
- Auto thefts: 36
Health of residents in Carroll County based on CDC Behavioral Risk Factor Surveillance System Survey Questionnaires from 2013 to 2021:
General health status score of residents in this county from 1 (poor) to 5 (excellent) is 3.5. This is about average.73.7% of residents exercised in the past month. This is about average.
41.4% of residents smoked 100+ cigarettes in their lives. This is about average.
56.5% of adult residents drank alcohol in the past 30 days. This is less than average.
72.1% of residents visited a dentist within the past year. This is about average.
Average weight of males is 198 pounds. This is about average.
Average weight of females is 166 pounds. This is about average.
Health of residents in Carroll County based on CDC Behavioral Risk Factor Surveillance System Survey Questionnaires from 2003 to 2012:
General health status score of residents in this county from 1 (poor) to 5 (excellent) is 3.6. This is better than average.67.6% of residents exercised in the past month. This is less than average.
42.7% of residents smoked 100+ cigarettes in their lives. This is about average.
98.5% of adult residents drank alcohol in the past 30 days. This is more than average.
77.1% of residents visited a dentist within the past year. This is more than average.
Average weight of males is 191 pounds. This is about average.
Average weight of females is 153 pounds. This is less than average.
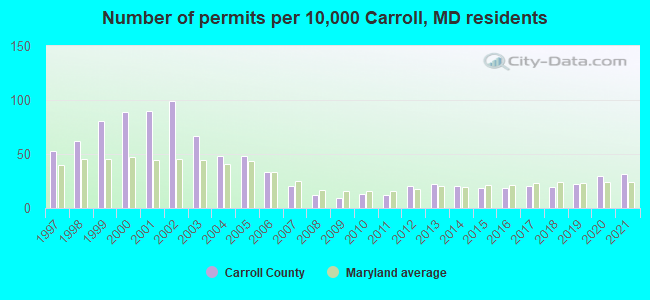
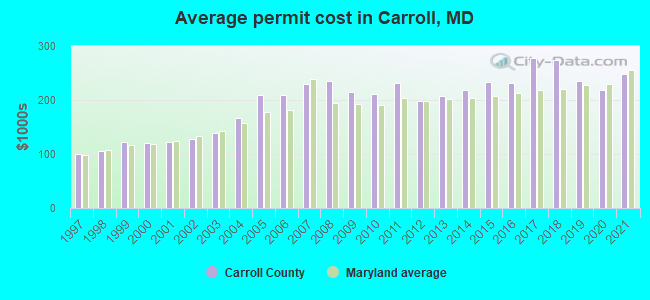
Single-family new house construction building permits:
- 2022: 294 buildings, average cost: $305,200
- 2021: 481 buildings, average cost: $247,500
- 2020: 443 buildings, average cost: $217,600
- 2019: 330 buildings, average cost: $234,800
- 2018: 288 buildings, average cost: $275,300
- 2017: 308 buildings, average cost: $277,800
- 2016: 286 buildings, average cost: $230,500
- 2015: 279 buildings, average cost: $234,400
- 2014: 305 buildings, average cost: $217,500
- 2013: 329 buildings, average cost: $208,000
- 2012: 307 buildings, average cost: $198,900
- 2011: 183 buildings, average cost: $231,200
- 2010: 195 buildings, average cost: $212,100
- 2009: 142 buildings, average cost: $214,600
- 2008: 188 buildings, average cost: $235,600
- 2007: 312 buildings, average cost: $229,900
- 2006: 507 buildings, average cost: $209,900
- 2005: 723 buildings, average cost: $210,200
- 2004: 732 buildings, average cost: $167,300
- 2003: 1005 buildings, average cost: $138,300
- 2002: 1499 buildings, average cost: $127,900
- 2001: 1350 buildings, average cost: $122,000
- 2000: 1347 buildings, average cost: $119,600
- 1999: 1218 buildings, average cost: $121,600
- 1998: 931 buildings, average cost: $104,600
- 1997: 791 buildings, average cost: $99,600
Median real estate property taxes paid for housing units with mortgages in 2022: $3,663 (0.8%)
Median real estate property taxes paid for housing units with no mortgage in 2022: $3,451 (0.9%)
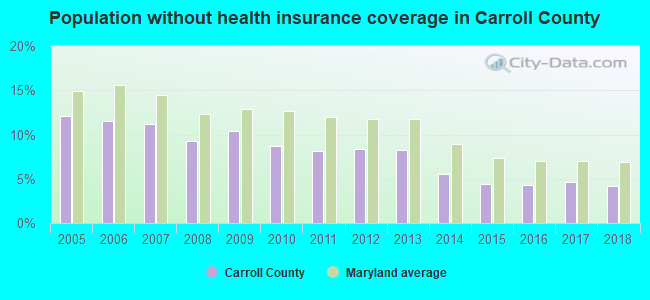
| Carroll County: | 5.4% |
| Maryland: | 9.6% |
Median age of residents in 2022: 41.3 years old
(Males: 39.7 years old, Females: 43.4 years old)
(Median age for: White residents: 43.8 years old, Black residents: 38.1 years old, American Indian residents: 52.3 years old, Asian residents: 46.5 years old, Hispanic or Latino residents: 26.6 years old, Other race residents: 26.0 years old)
Area name: Baltimore-Towson, MD HUD Metro FMR Area
Fair market rent in 2006 for a 1-bedroom apartment in Carroll County is $791 a month.
Fair market rent for a 2-bedroom apartment is $950 a month.
Fair market rent for a 3-bedroom apartment is $1220 a month.
Cities in this county include: Eldersburg, Westminster, District 1, Taneytown, Mount Airy, Taneytown, Hampstead, Sykesville, District 2, Uniontown, Manchester, New Windsor.
2023 air pollution in Carroll County:
Ozone (1-hour): 0.039 ppm (standard limit: 0.12 ppm). Near U.S. average.
Notable locations in this county outside city limits:
Notable locations in Carroll County: Two Hundred Seventy Technology Park (A), Locust View Farm (B), Kidwiler Farms (C), Frederick Pony Club (D), Monocacy Aqueduct (E), Dudrow Industrial Park (F), Calico Rocks Campground (G), Ballenger Creek Sewage Treatment Plant (H), Snowmill Farm (I), New Hope Valley Campground (J), Moxley Farms (K), Maplesville Farms (L), Maplecrest Farm (M), Intercoastal Industrial Center (N), Camp Airy (O), Camp Peniel (P), Gapview Farm (Q), Charlesville Station (R), Bald Eagle Island Campground (S), Frederick County Landfill (T). Display/hide their locations on the map
Shopping Centers: New Market Shopping Center (1), Libertytown Shopping Center (2), Evergreen Square Shopping Center (3), Francis Scott Key Mall Shopping Center (4). Display/hide their locations on the map
Churches in Carroll County include: Apples Church (A), Beaver Dam Presbyterian Church (B), Bells Chapel (C), Brook Hill Church (D), Central Chapel (E), Ceres-Bethel Church (F), Deerfield United Methodist Church (G), Friends Creek Church of God (H), Saint Anthony Shrine Roman Catholic Church (I). Display/hide their locations on the map
Cemeteries: Summers Family Cemetery (1), Koontz Cemetery (2), Israel Creek Cemetery (3), Hope Hill Cemetery (4), Browns Cemetery (5), Mount Hope Cemetery (6), Yingling Cemetery (7). Display/hide their locations on the map
Reservoirs: Fishing Creek Reservoir (A), Lily Pons Fish Ponds (B), Hunting Creek Lake (C), Chevy Chase Lake (D), Emmitsburg Reservoir (E), Lake Jennifer (F), Frank Bentz Memorial Lake (G), Middletown Reservoir (H). Display/hide their locations on the map
Streams, rivers, and creeks: Addison Run (A), Ballenger Creek (B), Beaver Branch (C), Beaver Dam Creek (D), Bennett Creek (E), Bush Creek (F), Buzzard Branch (G), Cabbage Run (H), Catoctin Creek (I). Display/hide their locations on the map
Parks in Carroll County include: Catoctin Mountain Park (1), Loys Station Park (2), Creagerstown Park (3), Catoctin Mountain Zoological Park (4), Catoctin Furnace Historic District (5), Wolfsville Puritan Park East (6), Reno Monument (7), Monocacy National Battlefield (8), Monocacy Natural Resources Area (9). Display/hide their locations on the map
Neighboring counties: Baltimore County  , Cape May County, New Jersey , Garrett County
  , Henry County, Indiana , Knox County, Missouri , Monroe County, Indiana , Baltimore city .
| Here: | 1.6% |
| Maryland: | 2.0% |
Current college students: 7,232
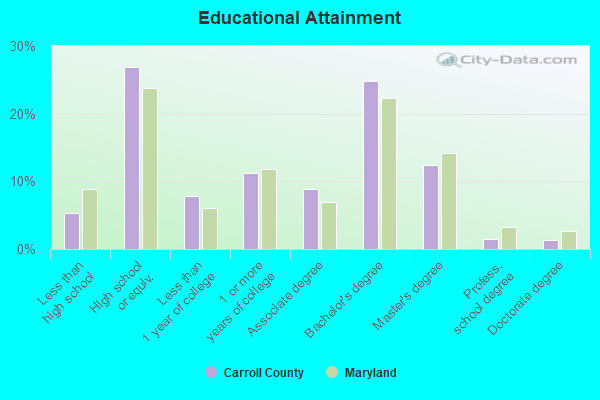
People 25 years of age or older with a high school degree or higher: 95.1%
People 25 years of age or older with a bachelor's degree or higher: 40.1%
Number of foreign born residents: 9,695 (60.8% naturalized citizens)
| Carroll County: | 5.5% |
| Whole state: | 16.7% |
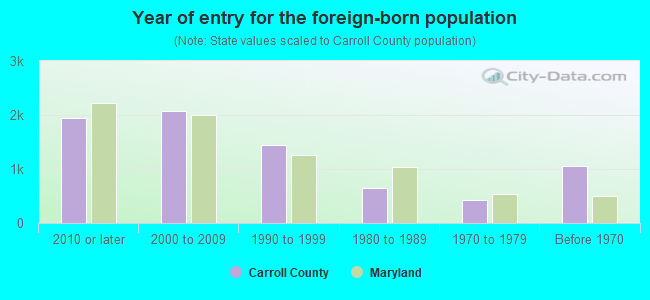
- Year of entry for the foreign-born population
- 2,6072010 or later
- 2,2422000 to 2009
- 1,5661990 to 1999
- 6391980 to 1989
- 4181970 to 1979
- 1,061Before 1970
Mean travel time to work (commute): minutes
Percentage of county residents living and working in this county: 96.6%
Housing units in structures:
- One, detached: 52,293
- One, attached: 8,003
- Two: 1,252
- 3 or 4: 715
- 5 to 9: 1,007
- 10 to 19: 1,184
- 20 to 49: 447
- 50 or more: 1,427
- Mobile homes: 217
Housing units in Carroll County with a mortgage: 39,836 (5,414 second mortgage, 108 home equity loan, 4,969 both second mortgage and home equity loan)
Houses without a mortgage: 1,491
| Here: | 97.5% with mortgage |
| State: | 97.5% with mortgage |
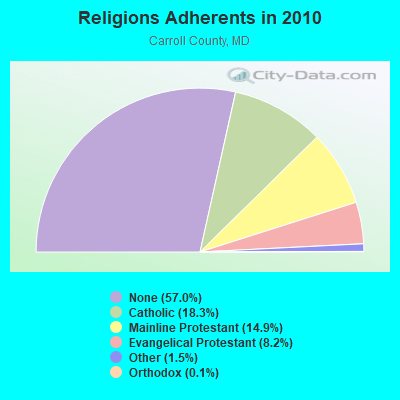
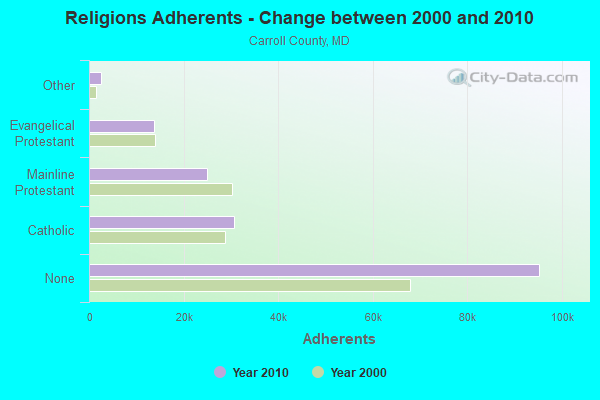
Religion statistics for Carroll County
| Religion | Adherents | Congregations |
|---|---|---|
| Catholic | 30,551 | 4 |
| Mainline Protestant | 24,903 | 75 |
| Evangelical Protestant | 13,764 | 68 |
| Other | 2,472 | 9 |
| Orthodox | 226 | 2 |
| None | 95,218 | - |
Source: Clifford Grammich, Kirk Hadaway, Richard Houseal, Dale E.Jones, Alexei Krindatch, Richie Stanley and Richard H.Taylor. 2012. 2010 U.S.Religion Census: Religious Congregations & Membership Study. Association of Statisticians of American Religious Bodies. Jones, Dale E., et al. 2002. Congregations and Membership in the United States 2000. Nashville, TN: Glenmary Research Center.
Food Environment Statistics:
| Carroll County: | 1.18 / 10,000 pop. |
| State: | 1.96 / 10,000 pop. |
| Here: | 0.06 / 10,000 pop. |
| Maryland: | 0.07 / 10,000 pop. |
| This county: | 1.01 / 10,000 pop. |
| Maryland: | 1.22 / 10,000 pop. |
| Carroll County: | 1.84 / 10,000 pop. |
| Maryland: | 2.05 / 10,000 pop. |
| This county: | 5.63 / 10,000 pop. |
| State: | 5.40 / 10,000 pop. |
| Carroll County: | 7.6% |
| Maryland: | 9.1% |
| Carroll County: | 24.5% |
| State: | 26.7% |
| Here: | 13.8% |
| State: | 15.5% |
Agriculture in Carroll County:
Average size of farms: 139 acresAverage value of agricultural products sold per farm: $65,175
Average value of crops sold per acre for harvested cropland: $312.08
The value of nursery, greenhouse, floriculture, and sod as a percentage of the total market value of agricultural products sold: 18.05%
The value of livestock, poultry, and their products as a percentage of the total market value of agricultural products sold: 54.84%
Average total farm production expenses per farm: $64,619
Harvested cropland as a percentage of land in farms: 67.77%
Irrigated harvested cropland as a percentage of land in farms: 0.55%
Average market value of all machinery and equipment per farm: $67,770
The percentage of farms operated by a family or individual: 88.85%
Average age of principal farm operators: 55 years
Average number of cattle and calves per 100 acres of all land in farms: 20.83
Milk cows as a percentage of all cattle and calves: 28.47%
Corn for grain: 30710 harvested acres
All wheat for grain: 7583 harvested acres
Soybeans for beans: 20426 harvested acres
Vegetables: 3,283 harvested acres
Land in orchards: 517 acres
Tornado activity:
Carroll County historical area-adjusted tornado activity is significantly below Maryland state average. It is 1723231.2 times below overall U.S. average.Tornadoes in this county have caused one injury recorded between 1950 and 2004.
On 4/5/1952, a category 1 (max. wind speeds 73-112 mph) tornado injured one person and caused between $5000 and $50,000 in damages.
Earthquake activity:
Carroll County-area historical earthquake activity is significantly above Maryland state average. It is 58% smaller than the overall U.S. average.On 8/23/2011 at 17:51:04, a magnitude 5.8 (5.8 MW, Depth: 3.7 mi, Class: Moderate, Intensity: VI - VII) earthquake occurred 124.2 miles away from Carroll County center
On 1/16/1994 at 01:49:16, a magnitude 4.6 (4.6 MB, 4.6 LG, Depth: 3.1 mi, Class: Light, Intensity: IV - V) earthquake occurred 74.5 miles away from the county center
On 9/25/1998 at 19:52:52, a magnitude 5.2 (4.8 MB, 4.3 MS, 5.2 LG, 4.5 MW, Depth: 3.1 mi) earthquake occurred 222.8 miles away from the county center
On 8/25/2011 at 05:07:52, a magnitude 4.5 (4.5 ML, Depth: 4.2 mi) earthquake occurred 122.5 miles away from the county center
On 12/9/2003 at 20:59:18, a magnitude 4.5 (4.5 ML, Depth: 6.2 mi) earthquake occurred 136.4 miles away from Carroll County center
On 1/16/1994 at 00:42:43, a magnitude 4.2 (4.2 MB, 4.0 LG, Depth: 3.1 mi) earthquake occurred 75.5 miles away from the county center
Magnitude types: regional Lg-wave magnitude (LG), body-wave magnitude (MB), local magnitude (ML), surface-wave magnitude (MS), moment magnitude (MW)
Most recent natural disasters:
- Maryland Covid-19 Pandemic, Incident Period: January 20, 2020, Major Disaster (Presidential) Declared DR-4491-MD: March 26, 2020, FEMA Id: 4491, Natural disaster type: Other
- Maryland Severe Winter Storm and Snowstorm, Incident Period: January 22, 2016 to January 23, 2016, Major Disaster (Presidential) Declared DR-4261: March 04, 2016, FEMA Id: 4261, Natural disaster type: Snowstorm, Winter Storm
- Maryland Snow Storm, Incident Period: February 12, 2014 to February 13, 2014, Major Disaster (Presidential) Declared DR-4170: April 10, 2014, FEMA Id: 4170, Natural disaster type: Storm, Snow
- Maryland Hurricane Sandy, Incident Period: October 26, 2012 to November 08, 2012, Emergency Declared EM-3349: October 28, 2012, FEMA Id: 3349, Natural disaster type: Hurricane
- Maryland Hurricane Sandy, Incident Period: October 26, 2012 to November 04, 2012, Major Disaster (Presidential) Declared DR-4091: November 20, 2012, FEMA Id: 4091, Natural disaster type: Hurricane
- Maryland Hurricane Irene, Incident Period: August 26, 2011 to September 05, 2011, Emergency Declared EM-3335: August 27, 2011, FEMA Id: 3335, Natural disaster type: Hurricane
- Maryland Severe Winter Storms and Snowstorms, Incident Period: February 05, 2010 to February 11, 2010, Major Disaster (Presidential) Declared DR-1910: May 06, 2010, FEMA Id: 1910, Natural disaster type: Snowstorm, Winter Storm
- Maryland Hurricane Katrina Evacuation, Incident Period: August 29, 2005 to October 01, 2005, Emergency Declared EM-3251: September 13, 2005, FEMA Id: 3251, Natural disaster type: Hurricane
- Maryland Hurricane Isabel, Incident Period: September 18, 2003 to September 29, 2003, Major Disaster (Presidential) Declared DR-1492: September 19, 2003, FEMA Id: 1492, Natural disaster type: Hurricane
- Maryland Snowstorm, Incident Period: February 14, 2003 to February 23, 2003, Emergency Declared EM-3179: March 14, 2003, FEMA Id: 3179, Natural disaster type: Snowstorm
- 7 other natural disasters have been reported since 1953.
The number of natural disasters in Carroll County (17) is near the US average (15).
Major Disasters (Presidential) Declared: 12
Emergencies Declared: 5
Causes of natural disasters: Hurricanes: 5, Floods: 4, Snowstorms: 3, Storms: 3, Winter Storms: 3, Blizzard: 1, Heavy Rain: 1, Snow: 1, Snowfall: 1, Tropical Storm: 1, Other: 1 (Note: some incidents may be assigned to more than one category).
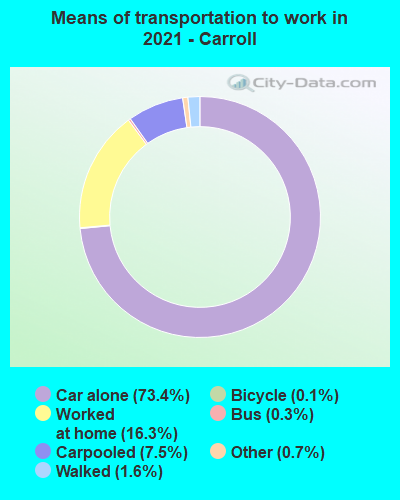
Means of transportation to work:
- Drove a car alone: 43,801 (67.0%)
- Carpooled: 4,889 (7.5%)
- Bus: 143 (0.2%)
- Subway or elevated rail: 4 (0.0%)
- Long-distance train or commuter rail: 5 (0.0%)
- Taxicab, motorcycle, or other means: 307 (0.5%)
- Bicycle: 35 (0.1%)
- Walked: 867 (1.3%)
- Worked at home: 16,366 (25.0%)
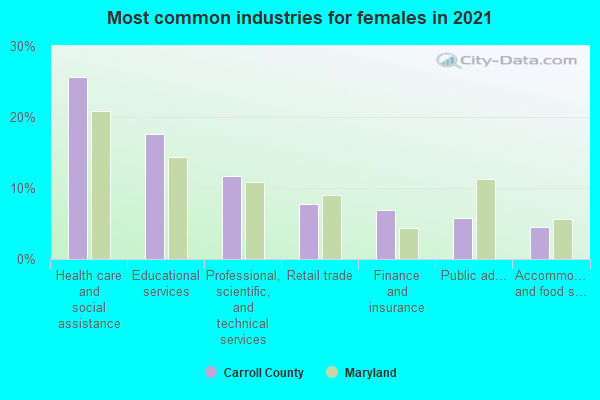
- Health care and social assistance (18%)
- Educational services (12%)
- Professional, scientific, and technical services (8%)
- Finance and insurance (6%)
- Retail trade (6%)
- Public administration (6%)
- Other services, except public administration (5%)
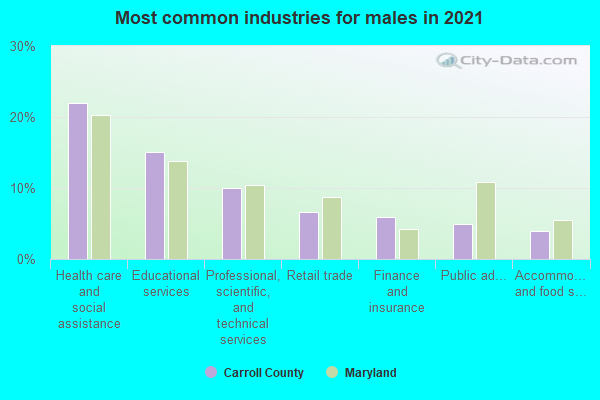
- Health care and social assistance (22%)
- Educational services (15%)
- Professional, scientific, and technical services (9%)
- Finance and insurance (8%)
- Retail trade (7%)
- Public administration (7%)
- Other services, except public administration (6%)
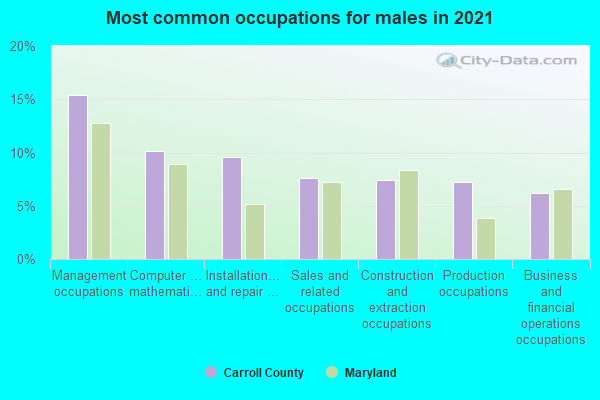
- Management occupations (18%)
- Construction and extraction occupations (9%)
- Sales and related occupations (8%)
- Computer and mathematical occupations (8%)
- Business and financial operations occupations (7%)
- Installation, maintenance, and repair occupations (6%)
- Food preparation and serving related occupations (6%)
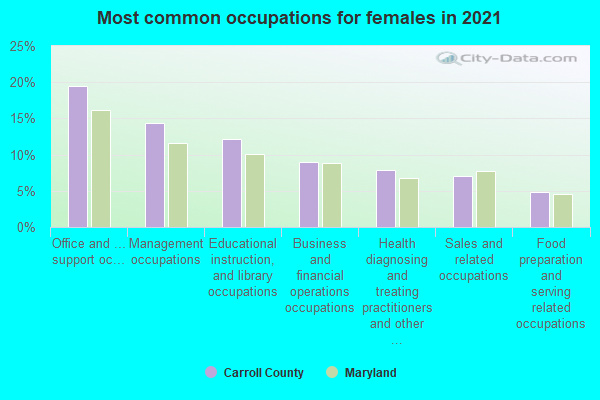
- Office and administrative support occupations (15%)
- Management occupations (14%)
- Business and financial operations occupations (12%)
- Educational instruction, and library occupations (10%)
- Health diagnosing and treating practitioners and other technical occupations (8%)
- Sales and related occupations (7%)
- Health technologists and technicians (4%)
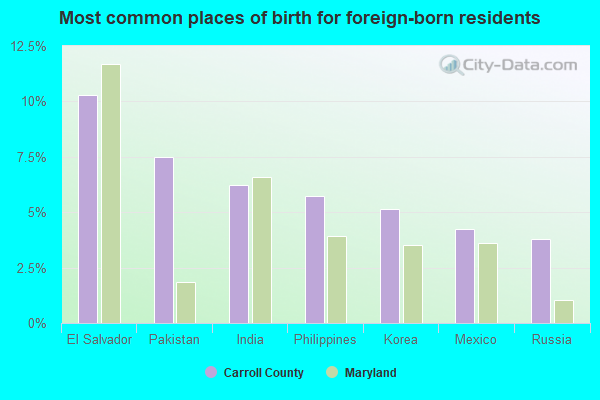
- El Salvador (9%)
- India (7%)
- Philippines (6%)
- Korea (5%)
- Mexico (5%)
- China, excluding Hong Kong and Taiwan (5%)
- Ukraine (4%)
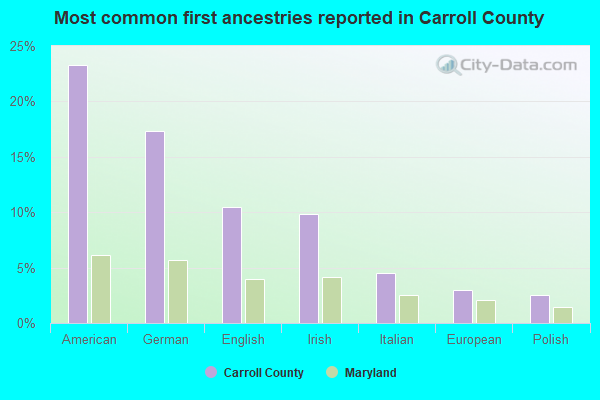
- American (24%)
- German (17%)
- English (10%)
- Irish (10%)
- Italian (5%)
- Polish (3%)
- European (3%)
People in group quarters in Carroll County, Maryland in 2010:
- 1,059 people in college/university student housing
- 919 people in nursing facilities/skilled-nursing facilities
- 514 people in state prisons
- 247 people in mental (psychiatric) hospitals and psychiatric units in other hospitals
- 234 people in local jails and other municipal confinement facilities
- 107 people in emergency and transitional shelters (with sleeping facilities) for people experiencing homelessness
- 61 people in other noninstitutional facilities
- 50 people in group homes intended for adults
- 50 people in workers' group living quarters and job corps centers
- 45 people in group homes for juveniles (non-correctional)
- 26 people in residential treatment centers for adults
- 7 people in in-patient hospice facilities
People in group quarters in Carroll County, Maryland in 2000:
- 1,100 people in college dormitories (includes college quarters off campus)
- 913 people in nursing homes
- 489 people in state prisons
- 353 people in mental (psychiatric) hospitals or wards
- 220 people in other noninstitutional group quarters
- 193 people in local jails and other confinement facilities (including police lockups)
- 106 people in training schools for juvenile delinquents
- 70 people in other group homes
- 62 people in homes or halfway houses for drug/alcohol abuse
- 41 people in homes for the mentally retarded
- 16 people in homes for the mentally ill
- 10 people in homes for the physically handicapped
- 8 people in religious group quarters
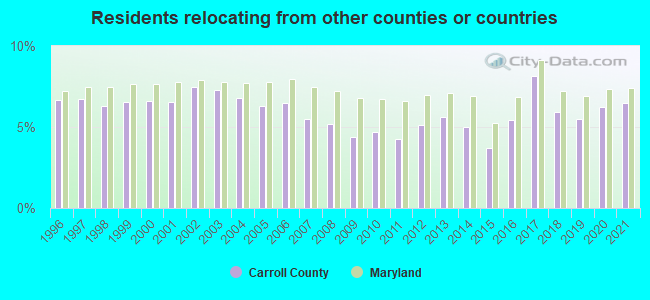
6.49% of this county's 2021 resident taxpayers lived in other counties in 2020 ($75,243 average adjusted gross income)
| Here: | 6.49% |
| Maryland average: | 7.42% |
10 or fewer of this county's residents moved from foreign countries.
4.58% relocated from other counties in Maryland ($56,711 average AGI)
1.91% relocated from other states ($18,532 average AGI)
Carroll County: 1.91% Maryland average: 3.41%
Top counties from which taxpayers relocated into this county between 2020 and 2021:
| from Baltimore County, MD | |
| from Howard County, MD | |
| from Frederick County, MD | |
| from Anne Arundel County, MD | |
| from Montgomery County, MD | |
| from Baltimore city, MD | |
| from York County, PA |
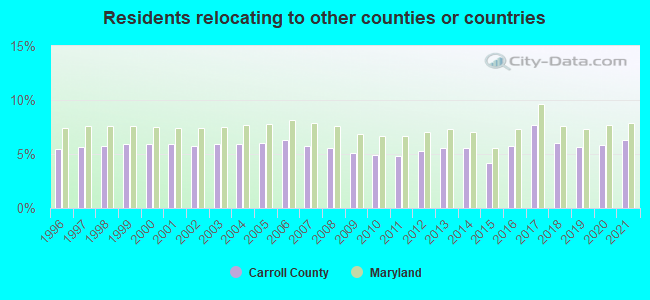
6.27% of this county's 2020 resident taxpayers moved to other counties in 2021 ($82,015 average adjusted gross income)
| Here: | 6.27% |
| Maryland average: | 7.91% |
0.03% of residents moved to foreign countries ($566 average AGI)
Carroll County: 0.03% Maryland average: 0.04%
3.06% relocated to other counties in Maryland ($36,437 average AGI)
3.18% relocated to other states ($45,012 average AGI)
Carroll County: 3.18% Maryland average: 3.93%
Top counties to which taxpayers relocated from this county between 2020 and 2021:
| to Baltimore County, MD | |
| to Frederick County, MD | |
| to York County, PA | |
| to Howard County, MD | |
| to Adams County, PA | |
| to Baltimore city, MD | |
| to Anne Arundel County, MD |
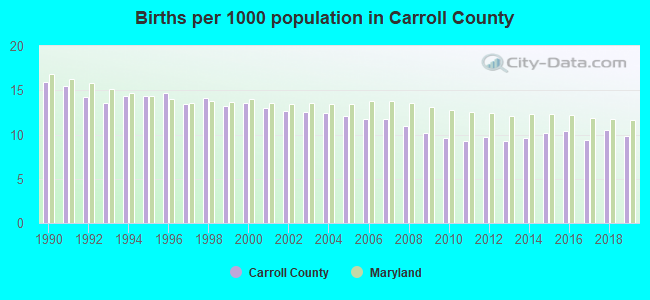
Births per 1000 population from 1990 to 1999: 14.3
Births per 1000 population from 2000 to 2009: 12.1
Births per 1000 population from 2010 to 2022: 8.3
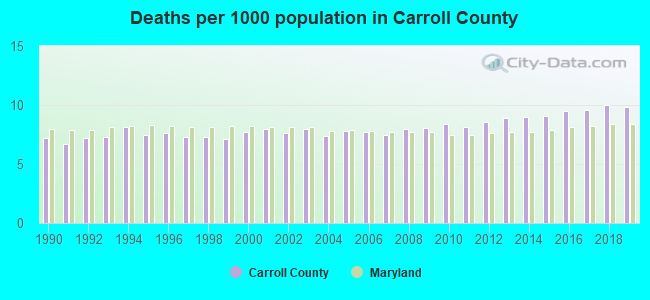
Deaths per 1000 population from 1990 to 1999: 7.3
Deaths per 1000 population from 2000 to 2009: 7.8
Deaths per 1000 population from 2010 to 2020: 9.3
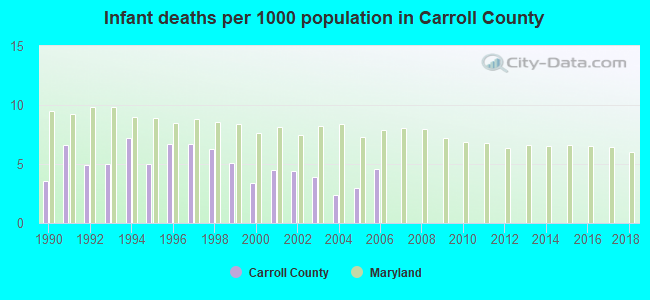
Infant deaths per 1000 live births from 1990 to 1999: 5.7
Infant deaths per 1000 live births from 2000 to 2006: 3.7
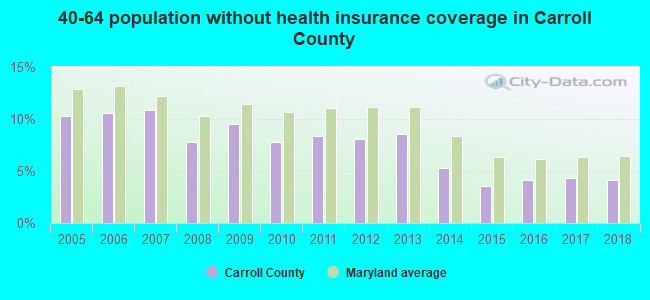
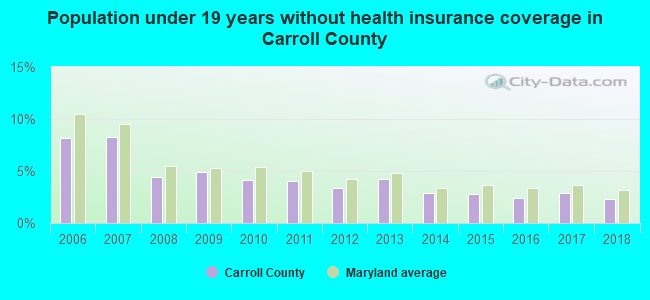
Persons under 19 years old without health insurance coverage in 2018: 2.3%

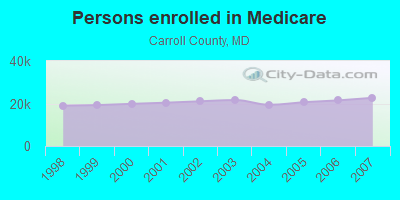
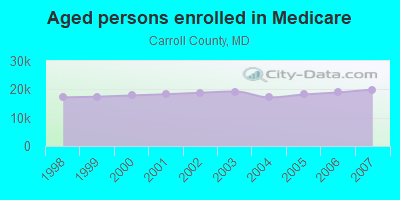
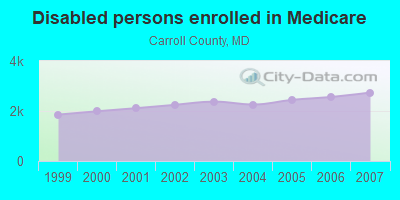
Persons enrolled in hospital insurance and/or supplemental medical insurance (Medicare) in July 1, 2007: 22,668 (19,930 aged, 2,738 disabled)
Children under 18 without health insurance coverage in 2007: 2,300 (5%)
Most common underlying causes of death in Carroll County, Maryland in 1999 - 2019:
- Bronchus or lung, unspecified - Malignant neoplasms (1,777)
- Unspecified dementia (1,747)
- Atherosclerotic heart disease (1,627)
- Atherosclerotic cardiovascular disease, so described (1,544)
- Acute myocardial infarction, unspecified (1,317)
- Chronic obstructive pulmonary disease, unspecified (1,305)
- Stroke, not specified as haemorrhage or infarction (979)
- Alzheimer disease, unspecified (863)
- Congestive heart failure (611)
- Septicaemia, unspecified (573)
Population without health insurance coverage in 2000: 7%
Children under 18 without health insurance coverage in 2000: 6%
Short term general hospital admissions per 100,000 population in 2004: 8,229
Short term general hospital beds per 100,000 population in 2004: 116
Emergency room visits per 100,000 population in 2004: 28,910
General practice office based MDs per 100,000 population in 2005: 1,203
Medical specialist MDs per 100,000 population in 2005: 764
Dentists per 100,000 population in 1998: 18
Total births per 100,000 population, July 2005 - July 2006 : 49
Total deaths per 100,000 population, July 2005 - July 2006: 81
Limited-service eating places per 100,000 population in 2005 : 18
Beer, wine & liquor stores per 100,000 population in 2005: 1
Homicides per 1,000,000 population from 2000 to 2006: 18.6. This is less than state average.
Suicides per 1,000,000 population from 2000 to 2006: 111.8. This is more than state average.
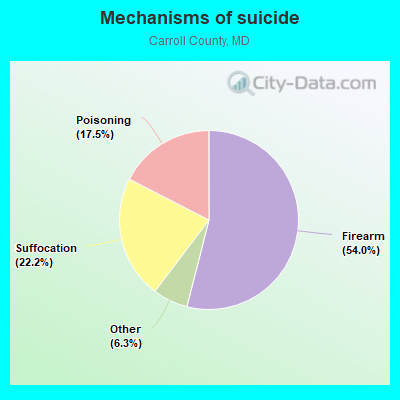
- Firearm - 60.3
- Suffocation - 24.8
- Poisoning - 19.5
- Other - 7.1
Household type by relationship:
Households: 175,305- Male householders: 32,748 (6,210 living alone), Female householders: 31,689 (8,517 living alone)
37,797 spouses (37,232 opposite-sex spouses), 4,118 unmarried partners, (3,930 opposite-sex unmarried partners), 53,262 children (50,232 natural, 1,110 adopted, 1,920 stepchildren), 2,522 grandchildren, 686 brothers or sisters, 2,720 parents, 50 foster children, 2,071 other relatives, 3,126 non-relatives
- In group quarters: 4,516
Size of family households: 18,019 2-persons, 11,491 3-persons, 11,204 4-persons, 3,344 5-persons, 1,798 6-persons, 838 7-or-more-persons.
Size of nonfamily households: 14,727 1-person, 2,803 2-persons, 213 3-persons.
29,172 married couples with children.
7,070 single-parent households (2,221 men, 4,849 women).
93.1% of residents of Carroll speak English at home.
2.3% of residents speak Spanish at home (64% speak English very well, 20% speak English well, 11% speak English not well, 6% don't speak English at all).
2.1% of residents speak other Indo-European language at home (78% speak English very well, 13% speak English well, 5% speak English not well, 4% don't speak English at all).
1.3% of residents speak Asian or Pacific Island language at home (61% speak English very well, 26% speak English well, 12% speak English not well, 1% don't speak English at all).
0.4% of residents speak other language at home (77% speak English very well, 23% speak English well).
In fiscal year 2004:
Federal Government expenditure: $701,617,000 ($4,223 per capita)
Department of Defense expenditure: $50,577,000
Federal direct payments to individuals for retirement and disability: $394,930,000
Federal other direct payments to individuals: $149,697,000
Federal direct payments not to individuals: $3,924,000
Federal grants: $88,742,000
Federal procurement contracts: $37,289,000 ($27,794,000 Department of Defense)
Federal salaries and wages: $27,035,000 ($1,277,000 Department of Defense)
Federal Government direct loans: $1,797,000
Federal guaranteed/insured loans: $165,006,000
Federal Government insurance: $29,541,000
Population change from April 1, 2000 to July 1, 2005:
Births: 9,952| Here: | 59 per 1000 residents |
| State: | 71 per 1000 residents |
Deaths: 6,380
| Here: | 38 per 1000 residents |
| State: | 41 per 1000 residents |
Net international migration: +393
| Here: | +2 per 1000 residents |
| State: | +19 per 1000 residents |
Net internal migration: +13,957
| Here: | +83 per 1000 residents |
| State: | +2 per 1000 residents |
Total withdrawal of fresh water for public supply: 6.71 millions of gallons per day (38% from ground, 62% from surface)
| Here: | 7.7 |
| State: | 7.3 |
| Here: | 4.2 |
| State: | 4.2 |
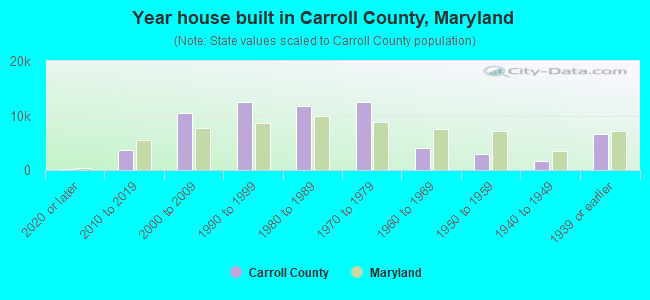
- Year house built in Carroll County, Maryland
- 7642020 or later
- 3,5722010 to 2019
- 8,7472000 to 2009
- 11,9531990 to 1999
- 13,1671980 to 1989
- 11,0131970 to 1979
- 4,6881960 to 1969
- 3,5071950 to 1959
- 1,1821940 to 1949
- 7,9521939 or earlier
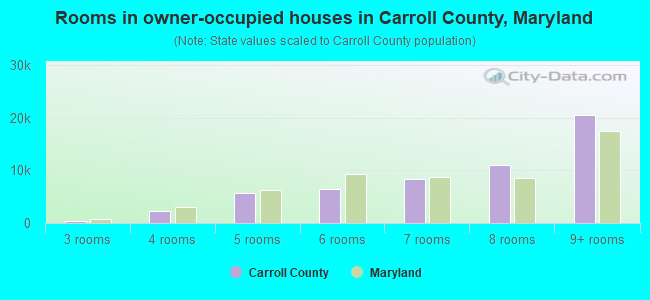
- Rooms in owner-occupied houses in Carroll County, Maryland
- 201 room
- 02 rooms
- 903 rooms
- 1,9984 rooms
- 4,9965 rooms
- 9,7516 rooms
- 8,2377 rooms
- 9,2848 rooms
- 19,6359+ rooms
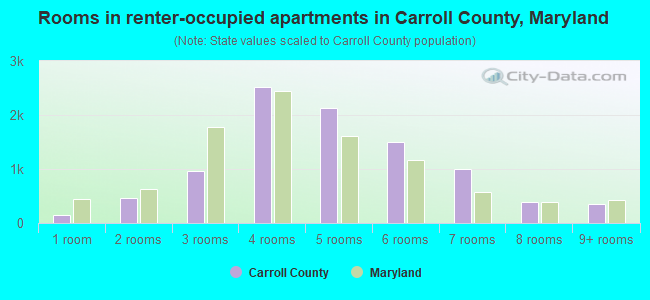
- Rooms in renter-occupied apartments in Carroll County, Maryland
- 8391 room
- 2452 rooms
- 1,4803 rooms
- 3,5664 rooms
- 2,0195 rooms
- 9616 rooms
- 4087 rooms
- 6178 rooms
- 2919+ rooms
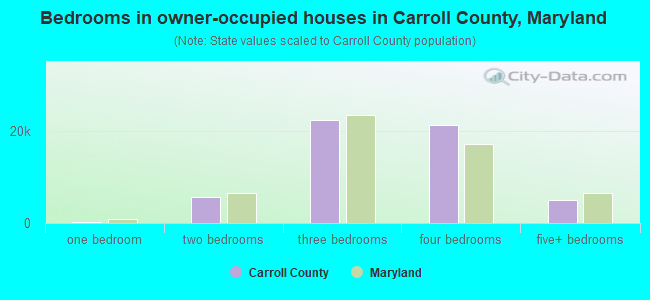
- Bedrooms in owner-occupied houses in Carroll County, Maryland
- 20no bedroom
- 1711 bedroom
- 3,9942 bedrooms
- 24,0293 bedrooms
- 20,0234 bedrooms
- 5,7745+ bedrooms
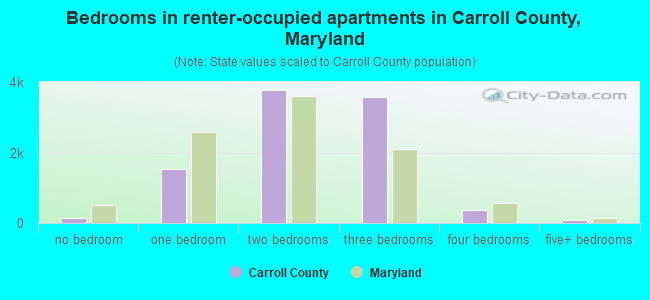
- Bedrooms in renter-occupied apartments in Carroll County, Maryland
- 930no bedroom
- 2,6791 bedroom
- 4,1132 bedrooms
- 2,0383 bedrooms
- 6214 bedrooms
- 455+ bedrooms
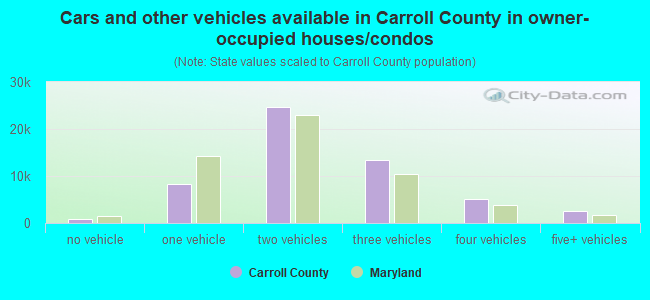
- Cars and other vehicles available in Carroll County in owner-occupied houses/condos
- 1,054no vehicle
- 9,2901 vehicle
- 22,1612 vehicles
- 13,9773 vehicles
- 5,4974 vehicles
- 2,0325+ vehicles
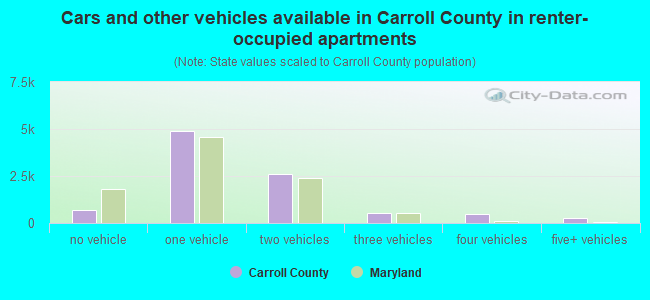
- Cars and other vehicles available in Carroll County in renter-occupied apartments
- 1,551no vehicle
- 6,0921 vehicle
- 1,8432 vehicles
- 6733 vehicles
- 1674 vehicles
- 1005+ vehicles
90.2% of Carroll County residents lived in the same house 1 years ago.
Out of people who lived in different houses, 24% lived in this county.
Out of people who lived in different counties, 74% lived in Maryland.
| Carroll County: | 90.2% |
| State average: | 88.5% |
Place of birth for U.S.-born residents:
- This state: 116,203
- Other state: 47,102
- Northeast: 21,529
- Midwest: 7,322
- South: 14,978
- West: 3,273
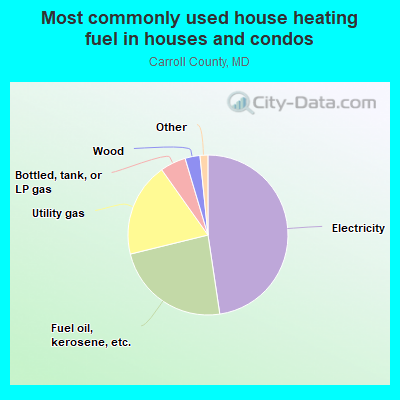
- 44.2%Electricity
- 24.1%Utility gas
- 20.2%Fuel oil, kerosene, etc.
- 6.1%Bottled, tank, or LP gas
- 3.9%Wood
- 0.9%Other fuel
- 0.4%No fuel used
- 0.2%Solar energy
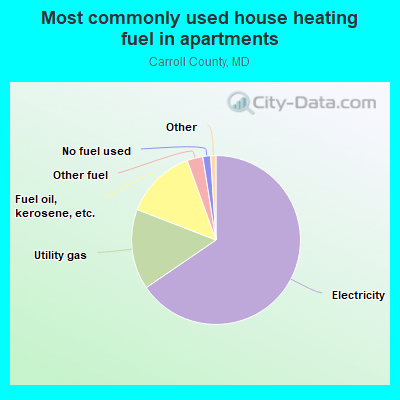
- 70.4%Electricity
- 14.7%Fuel oil, kerosene, etc.
- 10.1%Utility gas
- 4.8%Bottled, tank, or LP gas
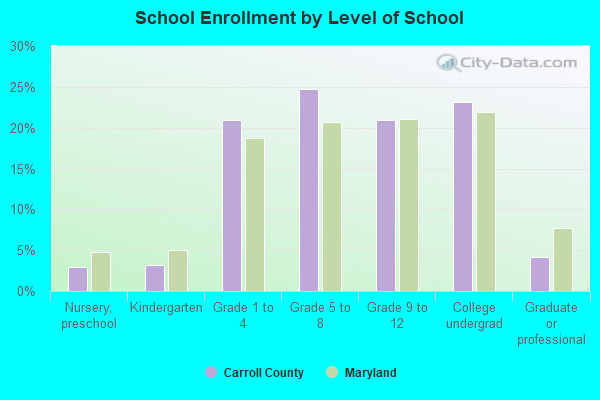
Private vs. public school enrollment:
| Here: | 20.9% |
| Maryland: | 15.2% |
| Here: | 12.0% |
| Maryland: | 14.4% |
| Here: | 29.6% |
| Maryland: | 20.2% |
Carroll County government finances - Expenditure in 2020:
- Bond Funds - Cash and Securities: $42,264,000
Cash and Securities: $19,618,000
- Charges - Higher Education - Other: $9,565,000
Higher Education - Other: $8,674,000
Solid Waste Management: $7,414,000
Sewerage: $7,215,000
Sewerage: $7,044,000
Solid Waste Management: $7,018,000
Other: $4,074,000
Other: $3,774,000
Elementary and Secondary Education School Lunch: $3,450,000
Elementary and Secondary Education School Lunch: $2,660,000
Parks and Recreation: $2,009,000
Parks and Recreation: $1,408,000
Air Transportation: $828,000
Air Transportation: $826,000
Higher Education Auxiliary Enterprises: $492,000
Higher Education Auxiliary Enterprises: $459,000
Elementary and Secondary Education - Other: $309,000
Elementary and Secondary Education School Tuition and Transportation: $269,000
Elementary and Secondary Education School Tuition and Transportation: $205,000
Regular Highways: $156,000
Regular Highways: $33,000
- Construction - Elementary and Secondary Education: $14,125,000
Elementary and Secondary Education: $8,370,000
Libraries: $45,000
- Current Operations - Elementary and Secondary Education: $346,874,000
Elementary and Secondary Education: $332,546,000
General - Other: $36,965,000
Other Higher Education: $33,621,000
General - Other: $32,830,000
Other Higher Education: $31,818,000
Regular Highways: $29,502,000
Regular Highways: $22,878,000
Police Protection: $21,759,000
Libraries: $17,897,000
Police Protection: $17,342,000
Libraries: $16,932,000
Natural Resources - Other: $15,433,000
Local Fire Protection: $15,142,000
Local Fire Protection: $14,225,000
Correctional Institutions: $11,893,000
Correctional Institutions: $11,696,000
Judicial and Legal Services: $11,524,000
Financial Administration: $11,440,000
Financial Administration: $11,063,000
Housing and Community Development: $10,471,000
Solid Waste Management: $10,461,000
Judicial and Legal Services: $9,668,000
General Public Buildings: $9,303,000
General Public Buildings: $9,133,000
Solid Waste Management: $8,957,000
Natural Resources - Other: $8,500,000
Housing and Community Development: $8,208,000
Parks and Recreation: $7,780,000
Central Staff Services: $7,501,000
Sewerage: $7,092,000
Sewerage: $7,053,000
Central Staff Services: $6,851,000
Water Utilities: $6,683,000
Health - Other: $6,273,000
Health - Other: $5,899,000
Parks and Recreation: $5,576,000
Water Utilities: $5,059,000
Protective Inspection and Regulation - Other: $2,412,000
Transit Utilities: $2,366,000
Protective Inspection and Regulation - Other: $2,346,000
Transit Utilities: $2,013,000
Air Transportation: $984,000
Air Transportation: $779,000
Higher Education Auxiliary Enterprises: $498,000
Higher Education Auxiliary Enterprises: $327,000
- Federal Intergovernmental - Housing and Community Development: $6,679,000
Housing and Community Development: $6,154,000
Other: $5,161,000
Other: $4,294,000
Education: $3,155,000
Education: $2,431,000
Transit Utilities: $1,167,000
Transit Utilities: $924,000
Natural Resources: $898,000
Highways: $259,000
Natural Resources: $75,000
- General - Interest on Debt: $16,380,000
Interest on Debt: $15,457,000
- Intergovernmental to Local - Other - Libraries: $15,390,000
Other - Libraries: $14,326,000
Other - Elementary and Secondary Education: $7,154,000
Other - Elementary and Secondary Education: $6,939,000
- Local Intergovernmental - Other: $16,392,000
Other: $14,992,000
Education: $12,516,000
Education: $11,397,000
- Long Term Debt - Beginning Outstanding - Unspecified Public Purpose: $353,814,000
Beginning Outstanding - Unspecified Public Purpose: $325,137,000
Outstanding Unspecified Public Purpose: $323,474,000
Outstanding Unspecified Public Purpose: $320,080,000
Retired Unspecified Public Purpose: $74,411,000
Issue, Unspecified Public Purpose: $72,748,000
Retired Unspecified Public Purpose: $33,777,000
Issue, Unspecified Public Purpose: $43,000
- Miscellaneous - General Revenue - Other: $12,485,000
General Revenue - Other: $11,698,000
Interest Earnings: $7,709,000
Rents: $7,038,000
Rents: $6,193,000
Interest Earnings: $2,899,000
Sale of Property: $228,000
Sale of Property: $162,000
Fines and Forfeits: $85,000
Fines and Forfeits: $66,000
Donations From Private Sources: $50,000
Donations From Private Sources: $25,000
- Other Capital Outlay - Elementary and Secondary Education: $1,676,000
Regular Highways: $1,525,000
Regular Highways: $1,216,000
Elementary and Secondary Education: $1,078,000
General - Other: $1,070,000
Police Protection: $1,029,000
General - Other: $417,000
Libraries: $376,000
General Public Building: $207,000
Police Protection: $207,000
Parks and Recreation: $170,000
Correctional Institutions: $110,000
Parks and Recreation: $99,000
Judicial and Legal Services: $96,000
General Public Building: $78,000
Correctional Institutions: $68,000
Financial Administration: $37,000
Libraries: $24,000
Financial Administration: $24,000
Central Staff Services: $12,000
Central Staff Services: $11,000
Protective Inspection and Regulation - Other: $5,000
Judicial and Legal Services: $3,000
- Other Funds - Cash and Securities: $156,603,000
Cash and Securities: $134,729,000
- Revenue - Water Utilities: $5,134,000
Water Utilities: $4,929,000
- State Intergovernmental - Education: $168,068,000
Education: $155,121,000
Other: $13,878,000
Other: $9,353,000
Highways: $2,177,000
Highways: $1,207,000
Transit Utilities: $489,000
Housing and Community Development: $248,000
Transit Utilities: $155,000
Housing and Community Development: $132,000
Health and Hospitals: $94,000
- Tax - Property: $218,894,000
Property: $207,862,000
Individual Income: $172,999,000
Individual Income: $153,487,000
Documentary and Stock Transfer: $14,841,000
Documentary and Stock Transfer: $13,924,000
Public Utility License: $1,708,000
Public Utility License: $1,663,000
Other License: $1,275,000
Other License: $1,238,000
Other Selective Sales: $733,000
Other Selective Sales: $688,000
Amusements Sales: $355,000
Amusements Sales: $251,000
Alcoholic Beverage License: $223,000
Alcoholic Beverage License: $153,000
Occupation and Business License - Other: $117,000
Occupation and Business License - Other: $55,000
- Total Salaries and Wages: $236,217,000
: $231,142,000
Carroll County government finances - Revenue in 2020:
- Bond Funds - Cash and Securities: $42,264,000
Cash and Securities: $19,618,000
- Charges - Higher Education - Other: $9,565,000
Higher Education - Other: $8,674,000
Solid Waste Management: $7,414,000
Sewerage: $7,215,000
Sewerage: $7,044,000
Solid Waste Management: $7,018,000
Other: $4,074,000
Other: $3,774,000
Elementary and Secondary Education School Lunch: $3,450,000
Elementary and Secondary Education School Lunch: $2,660,000
Parks and Recreation: $2,009,000
Parks and Recreation: $1,408,000
Air Transportation: $828,000
Air Transportation: $826,000
Higher Education Auxiliary Enterprises: $492,000
Higher Education Auxiliary Enterprises: $459,000
Elementary and Secondary Education - Other: $309,000
Elementary and Secondary Education School Tuition and Transportation: $269,000
Elementary and Secondary Education School Tuition and Transportation: $205,000
Regular Highways: $156,000
Regular Highways: $33,000
- Construction - Elementary and Secondary Education: $14,125,000
Elementary and Secondary Education: $8,370,000
Libraries: $45,000
- Current Operations - Elementary and Secondary Education: $346,874,000
Elementary and Secondary Education: $332,546,000
General - Other: $36,965,000
Other Higher Education: $33,621,000
General - Other: $32,830,000
Other Higher Education: $31,818,000
Regular Highways: $29,502,000
Regular Highways: $22,878,000
Police Protection: $21,759,000
Libraries: $17,897,000
Police Protection: $17,342,000
Libraries: $16,932,000
Natural Resources - Other: $15,433,000
Local Fire Protection: $15,142,000
Local Fire Protection: $14,225,000
Correctional Institutions: $11,893,000
Correctional Institutions: $11,696,000
Judicial and Legal Services: $11,524,000
Financial Administration: $11,440,000
Financial Administration: $11,063,000
Housing and Community Development: $10,471,000
Solid Waste Management: $10,461,000
Judicial and Legal Services: $9,668,000
General Public Buildings: $9,303,000
General Public Buildings: $9,133,000
Solid Waste Management: $8,957,000
Natural Resources - Other: $8,500,000
Housing and Community Development: $8,208,000
Parks and Recreation: $7,780,000
Central Staff Services: $7,501,000
Sewerage: $7,092,000
Sewerage: $7,053,000
Central Staff Services: $6,851,000
Water Utilities: $6,683,000
Health - Other: $6,273,000
Health - Other: $5,899,000
Parks and Recreation: $5,576,000
Water Utilities: $5,059,000
Protective Inspection and Regulation - Other: $2,412,000
Transit Utilities: $2,366,000
Protective Inspection and Regulation - Other: $2,346,000
Transit Utilities: $2,013,000
Air Transportation: $984,000
Air Transportation: $779,000
Higher Education Auxiliary Enterprises: $498,000
Higher Education Auxiliary Enterprises: $327,000
- Federal Intergovernmental - Housing and Community Development: $6,679,000
Housing and Community Development: $6,154,000
Other: $5,161,000
Other: $4,294,000
Education: $3,155,000
Education: $2,431,000
Transit Utilities: $1,167,000
Transit Utilities: $924,000
Natural Resources: $898,000
Highways: $259,000
Natural Resources: $75,000
- General - Interest on Debt: $16,380,000
Interest on Debt: $15,457,000
- Intergovernmental to Local - Other - Libraries: $15,390,000
Other - Libraries: $14,326,000
Other - Elementary and Secondary Education: $7,154,000
Other - Elementary and Secondary Education: $6,939,000
- Local Intergovernmental - Other: $16,392,000
Other: $14,992,000
Education: $12,516,000
Education: $11,397,000
- Long Term Debt - Beginning Outstanding - Unspecified Public Purpose: $353,814,000
Beginning Outstanding - Unspecified Public Purpose: $325,137,000
Outstanding Unspecified Public Purpose: $323,474,000
Outstanding Unspecified Public Purpose: $320,080,000
Retired Unspecified Public Purpose: $74,411,000
Issue, Unspecified Public Purpose: $72,748,000
Retired Unspecified Public Purpose: $33,777,000
Issue, Unspecified Public Purpose: $43,000
- Miscellaneous - General Revenue - Other: $12,485,000
General Revenue - Other: $11,698,000
Interest Earnings: $7,709,000
Rents: $7,038,000
Rents: $6,193,000
Interest Earnings: $2,899,000
Sale of Property: $228,000
Sale of Property: $162,000
Fines and Forfeits: $85,000
Fines and Forfeits: $66,000
Donations From Private Sources: $50,000
Donations From Private Sources: $25,000
- Other Capital Outlay - Elementary and Secondary Education: $1,676,000
Regular Highways: $1,525,000
Regular Highways: $1,216,000
Elementary and Secondary Education: $1,078,000
General - Other: $1,070,000
Police Protection: $1,029,000
General - Other: $417,000
Libraries: $376,000
General Public Building: $207,000
Police Protection: $207,000
Parks and Recreation: $170,000
Correctional Institutions: $110,000
Parks and Recreation: $99,000
Judicial and Legal Services: $96,000
General Public Building: $78,000
Correctional Institutions: $68,000
Financial Administration: $37,000
Libraries: $24,000
Financial Administration: $24,000
Central Staff Services: $12,000
Central Staff Services: $11,000
Protective Inspection and Regulation - Other: $5,000
Judicial and Legal Services: $3,000
- Other Funds - Cash and Securities: $156,603,000
Cash and Securities: $134,729,000
- Revenue - Water Utilities: $5,134,000
Water Utilities: $4,929,000
- State Intergovernmental - Education: $168,068,000
Education: $155,121,000
Other: $13,878,000
Other: $9,353,000
Highways: $2,177,000
Highways: $1,207,000
Transit Utilities: $489,000
Housing and Community Development: $248,000
Transit Utilities: $155,000
Housing and Community Development: $132,000
Health and Hospitals: $94,000
- Tax - Property: $218,894,000
Property: $207,862,000
Individual Income: $172,999,000
Individual Income: $153,487,000
Documentary and Stock Transfer: $14,841,000
Documentary and Stock Transfer: $13,924,000
Public Utility License: $1,708,000
Public Utility License: $1,663,000
Other License: $1,275,000
Other License: $1,238,000
Other Selective Sales: $733,000
Other Selective Sales: $688,000
Amusements Sales: $355,000
Amusements Sales: $251,000
Alcoholic Beverage License: $223,000
Alcoholic Beverage License: $153,000
Occupation and Business License - Other: $117,000
Occupation and Business License - Other: $55,000
- Total Salaries and Wages: $236,217,000
: $231,142,000
Carroll County government finances - Debt in 2020:
- Bond Funds - Cash and Securities: $42,264,000
Cash and Securities: $19,618,000
- Charges - Higher Education - Other: $9,565,000
Higher Education - Other: $8,674,000
Solid Waste Management: $7,414,000
Sewerage: $7,215,000
Sewerage: $7,044,000
Solid Waste Management: $7,018,000
Other: $4,074,000
Other: $3,774,000
Elementary and Secondary Education School Lunch: $3,450,000
Elementary and Secondary Education School Lunch: $2,660,000
Parks and Recreation: $2,009,000
Parks and Recreation: $1,408,000
Air Transportation: $828,000
Air Transportation: $826,000
Higher Education Auxiliary Enterprises: $492,000
Higher Education Auxiliary Enterprises: $459,000
Elementary and Secondary Education - Other: $309,000
Elementary and Secondary Education School Tuition and Transportation: $269,000
Elementary and Secondary Education School Tuition and Transportation: $205,000
Regular Highways: $156,000
Regular Highways: $33,000
- Construction - Elementary and Secondary Education: $14,125,000
Elementary and Secondary Education: $8,370,000
Libraries: $45,000
- Current Operations - Elementary and Secondary Education: $346,874,000
Elementary and Secondary Education: $332,546,000
General - Other: $36,965,000
Other Higher Education: $33,621,000
General - Other: $32,830,000
Other Higher Education: $31,818,000
Regular Highways: $29,502,000
Regular Highways: $22,878,000
Police Protection: $21,759,000
Libraries: $17,897,000
Police Protection: $17,342,000
Libraries: $16,932,000
Natural Resources - Other: $15,433,000
Local Fire Protection: $15,142,000
Local Fire Protection: $14,225,000
Correctional Institutions: $11,893,000
Correctional Institutions: $11,696,000
Judicial and Legal Services: $11,524,000
Financial Administration: $11,440,000
Financial Administration: $11,063,000
Housing and Community Development: $10,471,000
Solid Waste Management: $10,461,000
Judicial and Legal Services: $9,668,000
General Public Buildings: $9,303,000
General Public Buildings: $9,133,000
Solid Waste Management: $8,957,000
Natural Resources - Other: $8,500,000
Housing and Community Development: $8,208,000
Parks and Recreation: $7,780,000
Central Staff Services: $7,501,000
Sewerage: $7,092,000
Sewerage: $7,053,000
Central Staff Services: $6,851,000
Water Utilities: $6,683,000
Health - Other: $6,273,000
Health - Other: $5,899,000
Parks and Recreation: $5,576,000
Water Utilities: $5,059,000
Protective Inspection and Regulation - Other: $2,412,000
Transit Utilities: $2,366,000
Protective Inspection and Regulation - Other: $2,346,000
Transit Utilities: $2,013,000
Air Transportation: $984,000
Air Transportation: $779,000
Higher Education Auxiliary Enterprises: $498,000
Higher Education Auxiliary Enterprises: $327,000
- Federal Intergovernmental - Housing and Community Development: $6,679,000
Housing and Community Development: $6,154,000
Other: $5,161,000
Other: $4,294,000
Education: $3,155,000
Education: $2,431,000
Transit Utilities: $1,167,000
Transit Utilities: $924,000
Natural Resources: $898,000
Highways: $259,000
Natural Resources: $75,000
- General - Interest on Debt: $16,380,000
Interest on Debt: $15,457,000
- Intergovernmental to Local - Other - Libraries: $15,390,000
Other - Libraries: $14,326,000
Other - Elementary and Secondary Education: $7,154,000
Other - Elementary and Secondary Education: $6,939,000
- Local Intergovernmental - Other: $16,392,000
Other: $14,992,000
Education: $12,516,000
Education: $11,397,000
- Long Term Debt - Beginning Outstanding - Unspecified Public Purpose: $353,814,000
Beginning Outstanding - Unspecified Public Purpose: $325,137,000
Outstanding Unspecified Public Purpose: $323,474,000
Outstanding Unspecified Public Purpose: $320,080,000
Retired Unspecified Public Purpose: $74,411,000
Issue, Unspecified Public Purpose: $72,748,000
Retired Unspecified Public Purpose: $33,777,000
Issue, Unspecified Public Purpose: $43,000
- Miscellaneous - General Revenue - Other: $12,485,000
General Revenue - Other: $11,698,000
Interest Earnings: $7,709,000
Rents: $7,038,000
Rents: $6,193,000
Interest Earnings: $2,899,000
Sale of Property: $228,000
Sale of Property: $162,000
Fines and Forfeits: $85,000
Fines and Forfeits: $66,000
Donations From Private Sources: $50,000
Donations From Private Sources: $25,000
- Other Capital Outlay - Elementary and Secondary Education: $1,676,000
Regular Highways: $1,525,000
Regular Highways: $1,216,000
Elementary and Secondary Education: $1,078,000
General - Other: $1,070,000
Police Protection: $1,029,000
General - Other: $417,000
Libraries: $376,000
General Public Building: $207,000
Police Protection: $207,000
Parks and Recreation: $170,000
Correctional Institutions: $110,000
Parks and Recreation: $99,000
Judicial and Legal Services: $96,000
General Public Building: $78,000
Correctional Institutions: $68,000
Financial Administration: $37,000
Libraries: $24,000
Financial Administration: $24,000
Central Staff Services: $12,000
Central Staff Services: $11,000
Protective Inspection and Regulation - Other: $5,000
Judicial and Legal Services: $3,000
- Other Funds - Cash and Securities: $156,603,000
Cash and Securities: $134,729,000
- Revenue - Water Utilities: $5,134,000
Water Utilities: $4,929,000
- State Intergovernmental - Education: $168,068,000
Education: $155,121,000
Other: $13,878,000
Other: $9,353,000
Highways: $2,177,000
Highways: $1,207,000
Transit Utilities: $489,000
Housing and Community Development: $248,000
Transit Utilities: $155,000
Housing and Community Development: $132,000
Health and Hospitals: $94,000
- Tax - Property: $218,894,000
Property: $207,862,000
Individual Income: $172,999,000
Individual Income: $153,487,000
Documentary and Stock Transfer: $14,841,000
Documentary and Stock Transfer: $13,924,000
Public Utility License: $1,708,000
Public Utility License: $1,663,000
Other License: $1,275,000
Other License: $1,238,000
Other Selective Sales: $733,000
Other Selective Sales: $688,000
Amusements Sales: $355,000
Amusements Sales: $251,000
Alcoholic Beverage License: $223,000
Alcoholic Beverage License: $153,000
Occupation and Business License - Other: $117,000
Occupation and Business License - Other: $55,000
- Total Salaries and Wages: $236,217,000
: $231,142,000
Carroll County government finances - Cash and Securities in 2020:
- Bond Funds - Cash and Securities: $42,264,000
Cash and Securities: $19,618,000
- Charges - Higher Education - Other: $9,565,000
Higher Education - Other: $8,674,000
Solid Waste Management: $7,414,000
Sewerage: $7,215,000
Sewerage: $7,044,000
Solid Waste Management: $7,018,000
Other: $4,074,000
Other: $3,774,000
Elementary and Secondary Education School Lunch: $3,450,000
Elementary and Secondary Education School Lunch: $2,660,000
Parks and Recreation: $2,009,000
Parks and Recreation: $1,408,000
Air Transportation: $828,000
Air Transportation: $826,000
Higher Education Auxiliary Enterprises: $492,000
Higher Education Auxiliary Enterprises: $459,000
Elementary and Secondary Education - Other: $309,000
Elementary and Secondary Education School Tuition and Transportation: $269,000
Elementary and Secondary Education School Tuition and Transportation: $205,000
Regular Highways: $156,000
Regular Highways: $33,000
- Construction - Elementary and Secondary Education: $14,125,000
Elementary and Secondary Education: $8,370,000
Libraries: $45,000
- Current Operations - Elementary and Secondary Education: $346,874,000
Elementary and Secondary Education: $332,546,000
General - Other: $36,965,000
Other Higher Education: $33,621,000
General - Other: $32,830,000
Other Higher Education: $31,818,000
Regular Highways: $29,502,000
Regular Highways: $22,878,000
Police Protection: $21,759,000
Libraries: $17,897,000
Police Protection: $17,342,000
Libraries: $16,932,000
Natural Resources - Other: $15,433,000
Local Fire Protection: $15,142,000
Local Fire Protection: $14,225,000
Correctional Institutions: $11,893,000
Correctional Institutions: $11,696,000
Judicial and Legal Services: $11,524,000
Financial Administration: $11,440,000
Financial Administration: $11,063,000
Housing and Community Development: $10,471,000
Solid Waste Management: $10,461,000
Judicial and Legal Services: $9,668,000
General Public Buildings: $9,303,000
General Public Buildings: $9,133,000
Solid Waste Management: $8,957,000
Natural Resources - Other: $8,500,000
Housing and Community Development: $8,208,000
Parks and Recreation: $7,780,000
Central Staff Services: $7,501,000
Sewerage: $7,092,000
Sewerage: $7,053,000
Central Staff Services: $6,851,000
Water Utilities: $6,683,000
Health - Other: $6,273,000
Health - Other: $5,899,000
Parks and Recreation: $5,576,000
Water Utilities: $5,059,000
Protective Inspection and Regulation - Other: $2,412,000
Transit Utilities: $2,366,000
Protective Inspection and Regulation - Other: $2,346,000
Transit Utilities: $2,013,000
Air Transportation: $984,000
Air Transportation: $779,000
Higher Education Auxiliary Enterprises: $498,000
Higher Education Auxiliary Enterprises: $327,000
- Federal Intergovernmental - Housing and Community Development: $6,679,000
Housing and Community Development: $6,154,000
Other: $5,161,000
Other: $4,294,000
Education: $3,155,000
Education: $2,431,000
Transit Utilities: $1,167,000
Transit Utilities: $924,000
Natural Resources: $898,000
Highways: $259,000
Natural Resources: $75,000
- General - Interest on Debt: $16,380,000
Interest on Debt: $15,457,000
- Intergovernmental to Local - Other - Libraries: $15,390,000
Other - Libraries: $14,326,000
Other - Elementary and Secondary Education: $7,154,000
Other - Elementary and Secondary Education: $6,939,000
- Local Intergovernmental - Other: $16,392,000
Other: $14,992,000
Education: $12,516,000
Education: $11,397,000
- Long Term Debt - Beginning Outstanding - Unspecified Public Purpose: $353,814,000
Beginning Outstanding - Unspecified Public Purpose: $325,137,000
Outstanding Unspecified Public Purpose: $323,474,000
Outstanding Unspecified Public Purpose: $320,080,000
Retired Unspecified Public Purpose: $74,411,000
Issue, Unspecified Public Purpose: $72,748,000
Retired Unspecified Public Purpose: $33,777,000
Issue, Unspecified Public Purpose: $43,000
- Miscellaneous - General Revenue - Other: $12,485,000
General Revenue - Other: $11,698,000
Interest Earnings: $7,709,000
Rents: $7,038,000
Rents: $6,193,000
Interest Earnings: $2,899,000
Sale of Property: $228,000
Sale of Property: $162,000
Fines and Forfeits: $85,000
Fines and Forfeits: $66,000
Donations From Private Sources: $50,000
Donations From Private Sources: $25,000
- Other Capital Outlay - Elementary and Secondary Education: $1,676,000
Regular Highways: $1,525,000
Regular Highways: $1,216,000
Elementary and Secondary Education: $1,078,000
General - Other: $1,070,000
Police Protection: $1,029,000
General - Other: $417,000
Libraries: $376,000
General Public Building: $207,000
Police Protection: $207,000
Parks and Recreation: $170,000
Correctional Institutions: $110,000
Parks and Recreation: $99,000
Judicial and Legal Services: $96,000
General Public Building: $78,000
Correctional Institutions: $68,000
Financial Administration: $37,000
Libraries: $24,000
Financial Administration: $24,000
Central Staff Services: $12,000
Central Staff Services: $11,000
Protective Inspection and Regulation - Other: $5,000
Judicial and Legal Services: $3,000
- Other Funds - Cash and Securities: $156,603,000
Cash and Securities: $134,729,000
- Revenue - Water Utilities: $5,134,000
Water Utilities: $4,929,000
- State Intergovernmental - Education: $168,068,000
Education: $155,121,000
Other: $13,878,000
Other: $9,353,000
Highways: $2,177,000
Highways: $1,207,000
Transit Utilities: $489,000
Housing and Community Development: $248,000
Transit Utilities: $155,000
Housing and Community Development: $132,000
Health and Hospitals: $94,000
- Tax - Property: $218,894,000
Property: $207,862,000
Individual Income: $172,999,000
Individual Income: $153,487,000
Documentary and Stock Transfer: $14,841,000
Documentary and Stock Transfer: $13,924,000
Public Utility License: $1,708,000
Public Utility License: $1,663,000
Other License: $1,275,000
Other License: $1,238,000
Other Selective Sales: $733,000
Other Selective Sales: $688,000
Amusements Sales: $355,000
Amusements Sales: $251,000
Alcoholic Beverage License: $223,000
Alcoholic Beverage License: $153,000
Occupation and Business License - Other: $117,000
Occupation and Business License - Other: $55,000
- Total Salaries and Wages: $236,217,000
: $231,142,000
Supplemental Security Income (SSI) in 2006:
- Total number of recipients: 1,157
- Number of aged recipients: 98
- Number of blind and disabled recipients: 1,059
- Number of recipients under 18: 145
- Number of recipients between 18 and 64: 808
- Number of recipients older than 64: 204
- Number of recipients also receiving OASDI: 412
- Amount of payments (thousands of dollars): 541
| Home Mortgage Disclosure Act Aggregated Statistics For Year 2009 (Based on 30 full tracts) | ||||||||||||||
| A) FHA, FSA/RHS & VA Home Purchase Loans | B) Conventional Home Purchase Loans | C) Refinancings | D) Home Improvement Loans | E) Loans on Dwellings For 5+ Families | F) Non-occupant Loans on < 5 Family Dwellings (A B C & D) | G) Loans On Manufactured Home Dwelling (A B C & D) | ||||||||
|---|---|---|---|---|---|---|---|---|---|---|---|---|---|---|
| Number | Average Value | Number | Average Value | Number | Average Value | Number | Average Value | Number | Average Value | Number | Average Value | Number | Average Value | |
| LOANS ORIGINATED | 749 | $273,429 | 677 | $254,650 | 6,162 | $248,673 | 312 | $126,253 | 8 | $1,789,750 | 143 | $205,182 | 1 | $40,000 |
| APPLICATIONS APPROVED, NOT ACCEPTED | 23 | $279,087 | 62 | $261,097 | 402 | $257,535 | 51 | $98,314 | 0 | $0 | 12 | $248,917 | 3 | $56,000 |
| APPLICATIONS DENIED | 71 | $268,352 | 90 | $218,778 | 1,471 | $273,264 | 159 | $82,478 | 2 | $225,000 | 56 | $173,661 | 23 | $65,087 |
| APPLICATIONS WITHDRAWN | 68 | $280,897 | 101 | $255,366 | 1,266 | $273,264 | 55 | $162,800 | 1 | $200,000 | 23 | $255,739 | 1 | $400,000 |
| FILES CLOSED FOR INCOMPLETENESS | 16 | $210,062 | 16 | $361,250 | 353 | $270,700 | 19 | $157,211 | 0 | $0 | 11 | $242,545 | 1 | $38,000 |
| Private Mortgage Insurance Companies Aggregated Statistics For Year 2009 (Based on 30 full tracts) | ||||||
| A) Conventional Home Purchase Loans | B) Refinancings | C) Non-occupant Loans on < 5 Family Dwellings (A & B) | ||||
|---|---|---|---|---|---|---|
| Number | Average Value | Number | Average Value | Number | Average Value | |
| LOANS ORIGINATED | 82 | $275,122 | 109 | $315,716 | 0 | $0 |
| APPLICATIONS APPROVED, NOT ACCEPTED | 36 | $317,528 | 50 | $319,460 | 1 | $185,000 |
| APPLICATIONS DENIED | 21 | $220,286 | 28 | $323,321 | 0 | $0 |
| APPLICATIONS WITHDRAWN | 2 | $352,000 | 10 | $297,400 | 0 | $0 |
| FILES CLOSED FOR INCOMPLETENESS | 4 | $313,500 | 3 | $327,333 | 0 | $0 |
| Most common first names in Carroll County, MD among deceased individuals | ||
| Name | Count | Lived (average) |
|---|---|---|
| Mary | 960 | 80.8 years |
| John | 866 | 75.2 years |
| William | 783 | 74.7 years |
| Charles | 709 | 75.5 years |
| James | 536 | 72.3 years |
| George | 527 | 76.4 years |
| Robert | 512 | 71.5 years |
| Margaret | 482 | 80.5 years |
| Helen | 468 | 81.2 years |
| Ruth | 362 | 81.8 years |
| Most common last names in Carroll County, MD among deceased individuals | ||
| Last name | Count | Lived (average) |
|---|---|---|
| Smith | 355 | 76.1 years |
| Miller | 248 | 77.0 years |
| Myers | 238 | 77.9 years |
| Brown | 233 | 76.2 years |
| Martin | 133 | 76.6 years |
| Jones | 127 | 74.9 years |
| Haines | 117 | 77.0 years |
| Green | 111 | 78.5 years |
| Barnes | 108 | 78.4 years |
| Davis | 104 | 76.3 years |
| Businesses in Carroll County, MD | ||||
| Name | Count | Name | Count | |
|---|---|---|---|---|
| 7-Eleven | 7 | La-Z-Boy | 1 | |
| AT&T | 3 | Lane Furniture | 3 | |
| Ace Hardware | 2 | Lowe's | 1 | |
| Advance Auto Parts | 4 | Marshalls | 1 | |
| Applebee's | 1 | MasterBrand Cabinets | 21 | |
| Arby's | 4 | McDonald's | 7 | |
| Baskin-Robbins | 3 | Motherhood Maternity | 1 | |
| Bath & Body Works | 1 | New York & Co | 1 | |
| Bed Bath & Beyond | 1 | Nike | 4 | |
| Best Western | 1 | Office Depot | 1 | |
| Blockbuster | 1 | Old Navy | 1 | |
| Buffalo Wild Wings | 1 | Olive Garden | 1 | |
| Burger King | 5 | Pac Sun | 1 | |
| CVS | 5 | Panera Bread | 2 | |
| Chevrolet | 3 | Papa John's Pizza | 2 | |
| Chick-Fil-A | 2 | Payless | 1 | |
| Chipotle | 1 | Penske | 2 | |
| Cold Stone Creamery | 1 | PetSmart | 1 | |
| Curves | 6 | Pier 1 Imports | 1 | |
| DHL | 3 | Pizza Hut | 6 | |
| Dairy Queen | 3 | Popeyes | 1 | |
| Days Inn | 1 | Qdoba Mexican Grill | 1 | |
| Deb | 1 | Quiznos | 3 | |
| Decora Cabinetry | 8 | RadioShack | 5 | |
| Dennys | 2 | Rite Aid | 5 | |
| Domino's Pizza | 2 | Ruby Tuesday | 1 | |
| DressBarn | 1 | Rue21 | 1 | |
| Dressbarn | 1 | Safeway | 3 | |
| Dunkin Donuts | 6 | Sears | 2 | |
| FedEx | 21 | Sprint Nextel | 1 | |
| Firestone Complete Auto Care | 1 | Staples | 1 | |
| Foot Locker | 1 | Starbucks | 5 | |
| Ford | 2 | Subway | 10 | |
| GNC | 4 | T-Mobile | 7 | |
| GameStop | 4 | T.J.Maxx | 1 | |
| Giant | 1 | Taco Bell | 4 | |
| Goodwill | 3 | Target | 1 | |
| H&R Block | 6 | The Room Place | 2 | |
| Home Depot | 2 | Toyota | 1 | |
| Honda | 1 | Toys"R"Us | 1 | |
| IHOP | 1 | True Value | 1 | |
| JoS. A. Bank | 2 | U-Haul | 10 | |
| Jones New York | 2 | UPS | 18 | |
| Journeys | 1 | Vans | 1 | |
| KFC | 4 | Verizon Wireless | 3 | |
| Kincaid | 1 | Vons | 3 | |
| Kmart | 1 | Walgreens | 2 | |
| Kohl's | 2 | Walmart | 4 | |
| Kroger | 1 | Wendy's | 3 | |
Carroll County on our top lists:
- #17 on the list of "Top 101 counties with the largest decrease in the number of births per 1000 residents 2000-2006 to 2007-2013 (pop 50,000+)"
- #29 on the list of "Top 101 counties with the lowest average weight of females"
- #36 on the list of "Top 101 counties with the lowest percentage of residents that exercised in the past month"
- #53 on the list of "Top 101 counties with the lowest number of births per 1000 residents 2007-2013"
- #53 on the list of "Top 101 counties with the lowest number of births per 1000 residents 2007-2013 (pop 50,000+)"
- #58 on the list of "Top 101 counties with the highest percentage of residents that visited a dentist within the past year"
- #67 on the list of "Top 101 counties with the best general health status score of residents (1-5), 3 years of data"
- #77 on the list of "Top 101 counties with the lowest percentage of residents that smoked 100+ cigarettes in their lives"
- #83 on the list of "Top 101 counties with highest percentage of residents voting for 3rd party candidates in the 2012 Presidential Election (pop. 50,000+)"
- #99 on the list of "Top 101 counties with the largest number of people without health insurance coverage in 2000 (pop. 50,000+)"