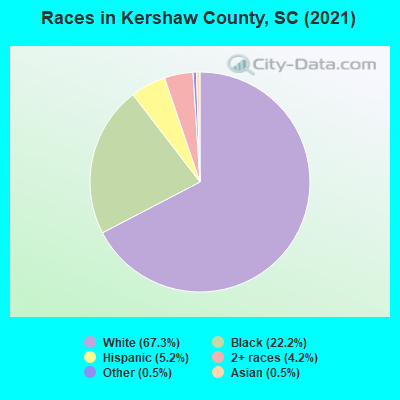
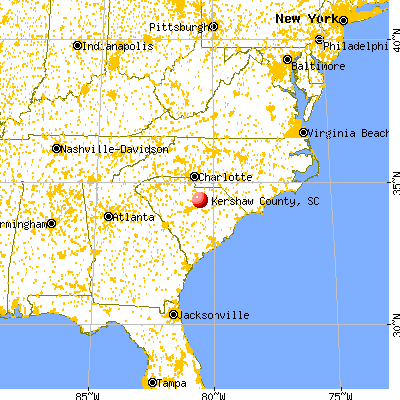
Kershaw County, South Carolina (SC)
County owner-occupied free and clear houses and condos in 2010: 6,786
County owner-occupied houses and condos in 2000: 16,554
Renter-occupied apartments: 5,179 (it was 3,634 in 2000)
| % of renters here: | 18% |
| State: | 31% |
Land area: 726 sq. mi.
Water area: 14.0 sq. mi.
Population density: 93 people per square mile (average).
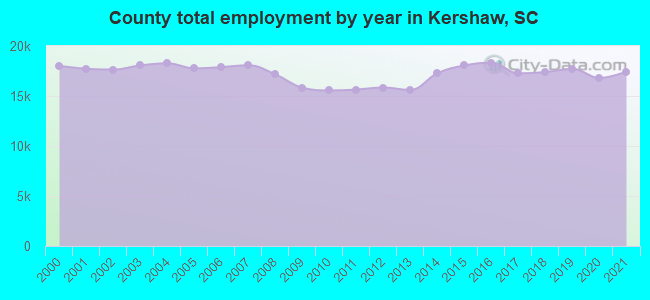
Industries providing employment: Educational, health and social services (22.2%), Manufacturing (15.1%).
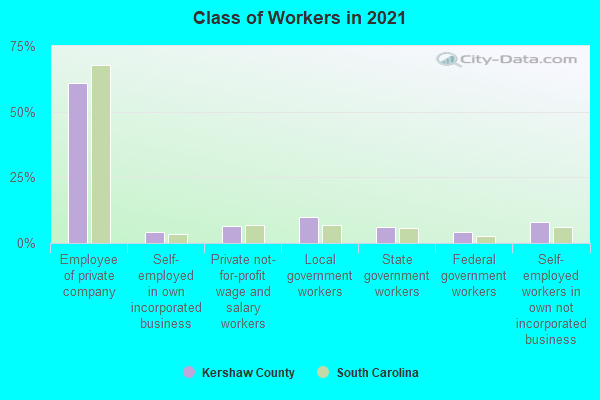
Type of workers:
- Private wage or salary: 73%
- Government: 20%
- Self-employed, not incorporated: 6%
- Unpaid family work: 0%
- OSM Map
- General Map
- Google Map
- MSN Map


- 45,32467.1%White Non-Hispanic Alone
- 14,98622.2%Black Non-Hispanic Alone
- 3,6565.4%Hispanic or Latino
- 3,0934.6%Two or more races
- 3110.5%Asian alone
- 690.1%Native Hawaiian and Other
Pacific Islander alone - 450.07%Some other race alone
- 380.06%American Indian and Alaska Native alone
| Median resident age: | 42.3 years |
| South Carolina median age: | 40.5 years |
| Males: 32,901 | |
| Females: 34,850 |

 | Columbia - general (5183 replies) |
| The Vista and 5 Points (3452 replies) |
| South Carolina Urban Planning Thread (107 replies) |
| New metro area development/construction (790 replies) |
| U.S. Census Bureau's South Carolina City and Town Population Estimates as of 7/1/2022 (49 replies) |
| What's New or Coming To Sumter (2739 replies) |
| Kershaw County: | 2.0 people |
| South Carolina: | 2 people |
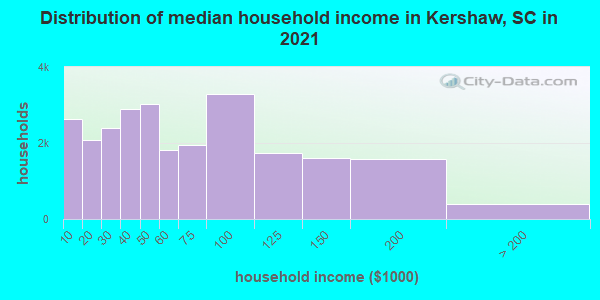
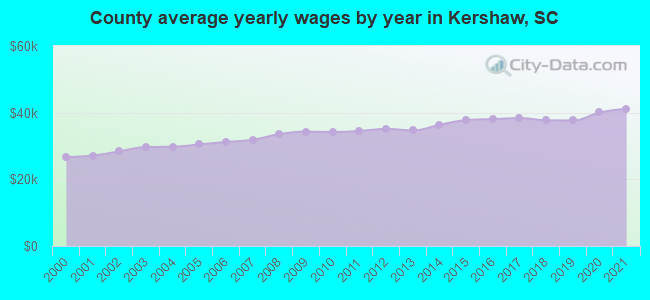
Estimated median household income in 2022: $58,684 ($38,804 in 1999)
| This county: | $58,684 |
| South Carolina: | $64,115 |
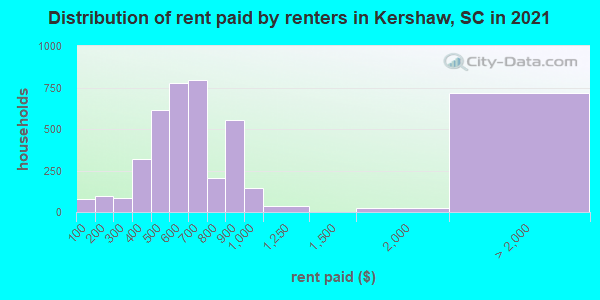
Median contract rent in 2022 for apartments: $737 (lower quartile is $552, upper quartile is $1,001)
| This county: | $737 |
| State: | $893 |
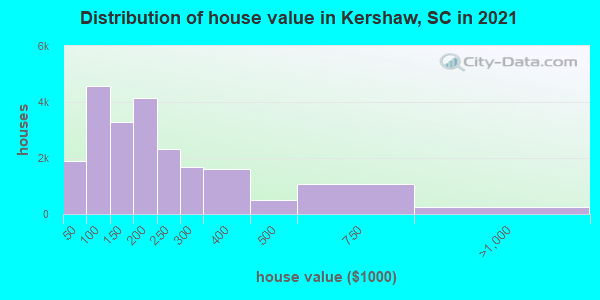
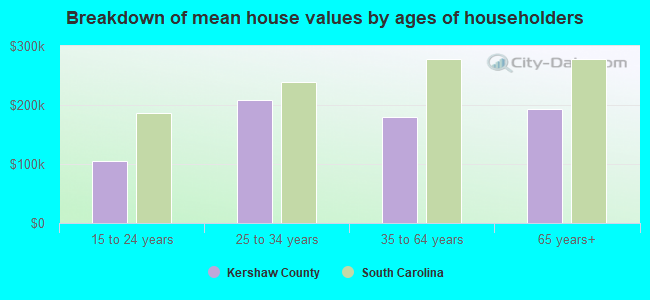
Estimated median house or condo value in 2022: $201,100 (it was $77,000 in 2000)
| Kershaw: | $201,100 |
| South Carolina: | $254,600 |
Median monthly housing costs for homes and condos with a mortgage: $1,285
Median monthly housing costs for units without a mortgage: $371
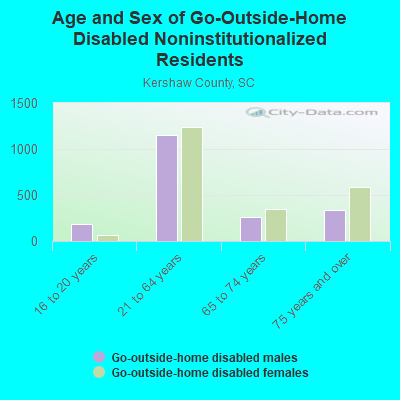
Institutionalized population: 278
Crime in 2021 (reported by the sheriff's office or county police, not the county total):
- Murders: 2
- Rapes: 25
- Robberies: 7
- Assaults: 162
- Burglaries: 156
- Thefts: 692
- Auto thefts: 82
Crime in 2020 (reported by the sheriff's office or county police, not the county total):
- Murders: 4
- Rapes: 27
- Robberies: 9
- Assaults: 140
- Burglaries: 255
- Thefts: 861
- Auto thefts: 126
Health of residents in Kershaw County based on CDC Behavioral Risk Factor Surveillance System Survey Questionnaires from 2013 to 2021:
General health status score of residents in this county from 1 (poor) to 5 (excellent) is 3.4. This is about average.71.3% of residents exercised in the past month. This is about average.
42.0% of residents smoked 100+ cigarettes in their lives. This is about average.
49.2% of adult residents drank alcohol in the past 30 days. This is less than average.
66.9% of residents visited a dentist within the past year. This is less than average.
Average weight of males is 200 pounds. This is more than average.
Average weight of females is 169 pounds. This is more than average.
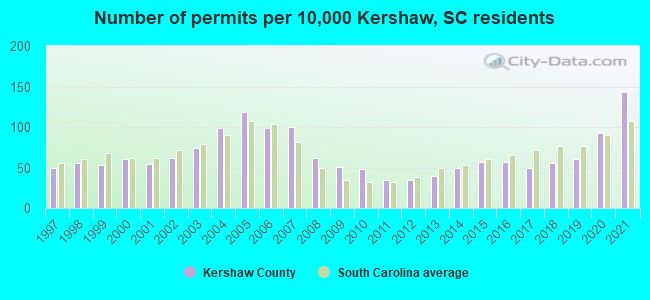
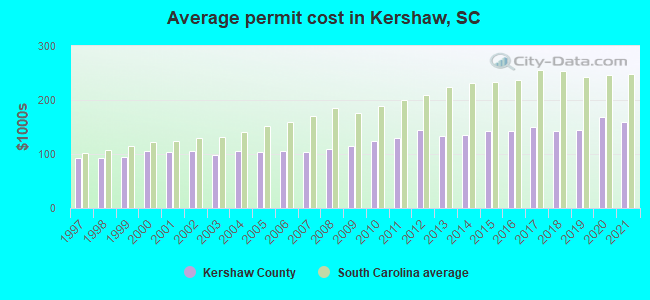
Single-family new house construction building permits:
- 2022: 385 buildings, average cost: $154,400
- 2021: 753 buildings, average cost: $158,600
- 2020: 486 buildings, average cost: $168,500
- 2019: 318 buildings, average cost: $144,900
- 2018: 292 buildings, average cost: $143,100
- 2017: 262 buildings, average cost: $150,300
- 2016: 298 buildings, average cost: $142,100
- 2015: 299 buildings, average cost: $142,300
- 2014: 262 buildings, average cost: $136,300
- 2013: 210 buildings, average cost: $133,100
- 2012: 185 buildings, average cost: $144,600
- 2011: 179 buildings, average cost: $128,800
- 2010: 252 buildings, average cost: $124,000
- 2009: 266 buildings, average cost: $113,600
- 2008: 324 buildings, average cost: $110,000
- 2007: 524 buildings, average cost: $103,100
- 2006: 522 buildings, average cost: $105,500
- 2005: 624 buildings, average cost: $104,300
- 2004: 520 buildings, average cost: $105,200
- 2003: 391 buildings, average cost: $98,600
- 2002: 329 buildings, average cost: $105,000
- 2001: 282 buildings, average cost: $104,400
- 2000: 314 buildings, average cost: $105,800
- 1999: 281 buildings, average cost: $93,600
- 1998: 287 buildings, average cost: $93,300
- 1997: 263 buildings, average cost: $92,500
Median real estate property taxes paid for housing units with mortgages in 2022: $1,182 (0.5%)
Median real estate property taxes paid for housing units with no mortgage in 2022: $678 (0.5%)
| Kershaw County: | 11.5% |
| South Carolina: | 14.0% |
Median age of residents in 2022: 42.3 years old
(Males: 38.3 years old, Females: 45.2 years old)
(Median age for: White residents: 44.3 years old, Black residents: 39.5 years old, Asian residents: 49.8 years old, Hispanic or Latino residents: 33.0 years old, Other race residents: 20.7 years old)
Fair market rent in 2006 for a 1-bedroom apartment in Kershaw County is $407 a month.
Fair market rent for a 2-bedroom apartment is $500 a month.
Fair market rent for a 3-bedroom apartment is $629 a month.
Cities in this county include: Camden, Lugoff, Boykin, Mount Pisgah, Westville, Elgin, Bethune.
Neighboring counties: Laurens County  , Valencia County, New Mexico , Monroe County, Mississippi , Meigs County, Tennessee
  , Tuscaloosa County, Alabama , Hale County, Texas , Lubbock County, Texas .
| Here: | 3.1% |
| South Carolina: | 3.1% |
Current college students: 1,348
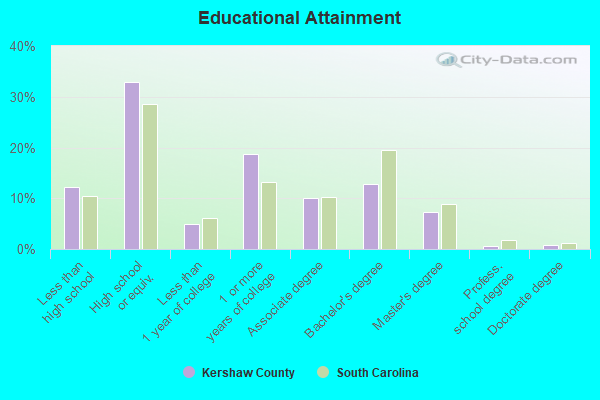
People 25 years of age or older with a high school degree or higher: 86.9%
People 25 years of age or older with a bachelor's degree or higher: 22.0%
Number of foreign born residents: 1,423 (41.0% naturalized citizens)
| Kershaw County: | 2.1% |
| Whole state: | 5.2% |
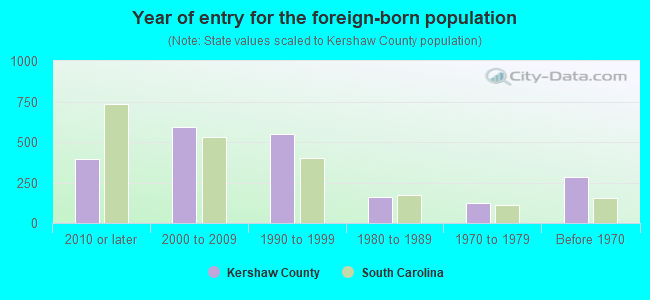
- Year of entry for the foreign-born population
- 3822010 or later
- 5762000 to 2009
- 3301990 to 1999
- 1631980 to 1989
- 1211970 to 1979
- 283Before 1970
Mean travel time to work (commute): minutes
Percentage of county residents living and working in this county: 99.0%
Housing units in structures:
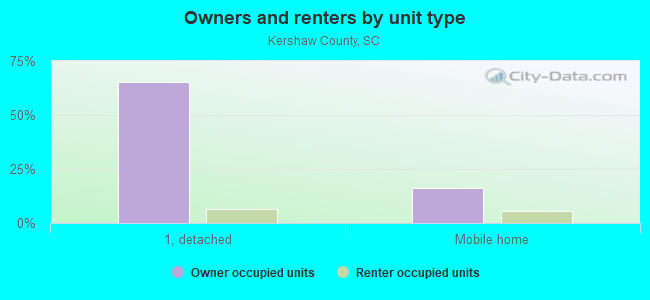
- One, detached: 21,730
- One, attached: 245
- Two: 190
- 3 or 4: 224
- 5 to 9: 472
- 10 to 19: 37
- 20 to 49: 261
- 50 or more: 305
- Mobile homes: 6,488
- Boats, RVs, vans, etc.: 74
Housing units in Kershaw County with a mortgage: 11,534 (894 second mortgage, 0 home equity loan, 758 both second mortgage and home equity loan)
Houses without a mortgage: 159
| Here: | 6.5% with mortgage |
| State: | 97.3% with mortgage |
Religion statistics for Kershaw County
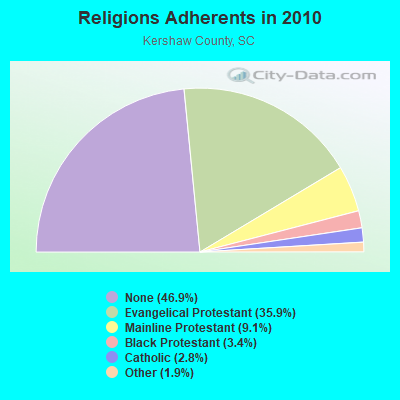
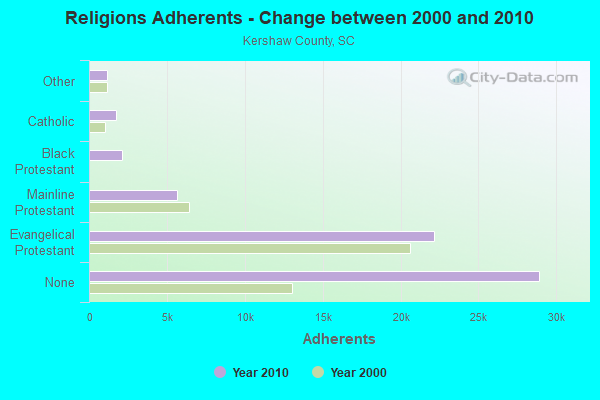
| Religion | Adherents | Congregations |
|---|---|---|
| Evangelical Protestant | 22,139 | 83 |
| Mainline Protestant | 5,627 | 30 |
| Black Protestant | 2,126 | 13 |
| Catholic | 1,724 | 1 |
| Other | 1,166 | 4 |
| None | 28,915 | - |
Source: Clifford Grammich, Kirk Hadaway, Richard Houseal, Dale E.Jones, Alexei Krindatch, Richie Stanley and Richard H.Taylor. 2012. 2010 U.S.Religion Census: Religious Congregations & Membership Study. Association of Statisticians of American Religious Bodies. Jones, Dale E., et al. 2002. Congregations and Membership in the United States 2000. Nashville, TN: Glenmary Research Center.
Food Environment Statistics:
| Kershaw County: | 1.55 / 10,000 pop. |
| State: | 1.99 / 10,000 pop. |
| Here: | 0.17 / 10,000 pop. |
| South Carolina: | 0.15 / 10,000 pop. |
| This county: | 0.86 / 10,000 pop. |
| South Carolina: | 0.85 / 10,000 pop. |
| Kershaw County: | 5.85 / 10,000 pop. |
| South Carolina: | 5.38 / 10,000 pop. |
| This county: | 5.85 / 10,000 pop. |
| State: | 7.75 / 10,000 pop. |
| Kershaw County: | 11.5% |
| South Carolina: | 10.6% |
| Kershaw County: | 30.0% |
| State: | 29.4% |
| Here: | 15.3% |
| State: | 13.4% |
Agriculture in Kershaw County:
Average size of farms: 146 acresAverage value of agricultural products sold per farm: $176,356
Average value of crops sold per acre for harvested cropland: $210.10
The value of nursery, greenhouse, floriculture, and sod as a percentage of the total market value of agricultural products sold: 0.71%
The value of livestock, poultry, and their products as a percentage of the total market value of agricultural products sold: 97.54%
Average total farm production expenses per farm: $125,924
Harvested cropland as a percentage of land in farms: 14.21%
Irrigated harvested cropland as a percentage of land in farms: 6.30%
Average market value of all machinery and equipment per farm: $43,702
The percentage of farms operated by a family or individual: 91.86%
Average age of principal farm operators: 56 years
Average number of cattle and calves per 100 acres of all land in farms: 7.01
Corn for grain: 1110 harvested acres
All wheat for grain: 1406 harvested acres
Soybeans for beans: 1576 harvested acres
Vegetables: 147 harvested acres
Land in orchards: 38 acres
Earthquake activity:
Kershaw County-area historical earthquake activity is significantly above South Carolina state average. It is 31% smaller than the overall U.S. average.On 8/23/2011 at 17:51:04, a magnitude 5.8 (5.8 MW, Depth: 3.7 mi, Class: Moderate, Intensity: VI - VII) earthquake occurred 291.3 miles away from Kershaw County center
On 8/2/1974 at 08:52:09, a magnitude 4.9 (4.3 MB, 4.9 LG, Class: Light, Intensity: IV - V) earthquake occurred 111.7 miles away from the county center
On 8/9/2020 at 12:07:37, a magnitude 5.1 (5.1 MW, Depth: 4.7 mi) earthquake occurred 153.5 miles away from the county center
On 11/22/1974 at 05:25:55, a magnitude 4.7 (4.7 MB) earthquake occurred 99.9 miles away from the county center
On 8/21/1992 at 16:31:55, a magnitude 4.4 (4.1 MB, 4.1 LG, 4.4 LG, Depth: 6.2 mi) earthquake occurred 90.4 miles away from Kershaw County center
On 4/13/1998 at 09:56:11, a magnitude 3.9 (3.5 MB, 3.9 LG, Depth: 3.1 mi, Class: Light, Intensity: II - III) earthquake occurred 23.4 miles away from the county center
Magnitude types: regional Lg-wave magnitude (LG), body-wave magnitude (MB), moment magnitude (MW)
Most recent natural disasters:
- South Carolina Covid-19 Pandemic, Incident Period: January 20, 2020, FEMA Id: 4492, Natural disaster type: Other
- South Carolina Hurricane Irma, Incident Period: September 6, 2017 - September 13, 2017, FEMA Id: 4346, Natural disaster type: Hurricane
- South Carolina Hurricane Matthew, Incident Period: October 04, 2016 to October 30, 2016, Emergency Declared EM-3378: October 06, 2016, FEMA Id: 3378, Natural disaster type: Hurricane
- South Carolina Hurricane Matthew, Incident Period: October 04, 2016 to October 30, 2016, Major Disaster (Presidential) Declared DR-4286: October 11, 2016, FEMA Id: 4286, Natural disaster type: Hurricane
- South Carolina Severe Storms and Flooding, Incident Period: October 01, 2015 to October 23, 2015, Emergency Declared EM-3373: October 03, 2015, FEMA Id: 3373, Natural disaster type: Storm, Flood
- South Carolina Severe Storms and Flooding, Incident Period: October 01, 2015 to October 23, 2015, Major Disaster (Presidential) Declared DR-4241: October 05, 2015, FEMA Id: 4241, Natural disaster type: Storm, Flood
- South Carolina Severe Winter Storm, Incident Period: February 10, 2014 to February 19, 2014, Emergency Declared EM-3369: February 12, 2014, FEMA Id: 3369, Natural disaster type: Winter Storm
- South Carolina Hurricane Katrina Evacuation, Incident Period: August 29, 2005 to October 01, 2005, Emergency Declared EM-3233: September 10, 2005, FEMA Id: 3233, Natural disaster type: Hurricane
- South Carolina Tropical Storm Frances, Incident Period: September 06, 2004 to October 11, 2004, Major Disaster (Presidential) Declared DR-1566: October 07, 2004, FEMA Id: 1566, Natural disaster type: Tropical Storm
- South Carolina Severe Ice Storm, Incident Period: January 26, 2004 to January 30, 2004, Major Disaster (Presidential) Declared DR-1509: February 13, 2004, FEMA Id: 1509, Natural disaster type: Ice Storm
- 7 other natural disasters have been reported since 1953.
The number of natural disasters in Kershaw County (17) is near the US average (15).
Major Disasters (Presidential) Declared: 9
Emergencies Declared: 6
Causes of natural disasters: Hurricanes: 7, Storms: 4, Floods: 3, Winter Storms: 2, Drought: 1, Ice Storm: 1, Tornado: 1, Tropical Storm: 1, Other: 1 (Note: some incidents may be assigned to more than one category).
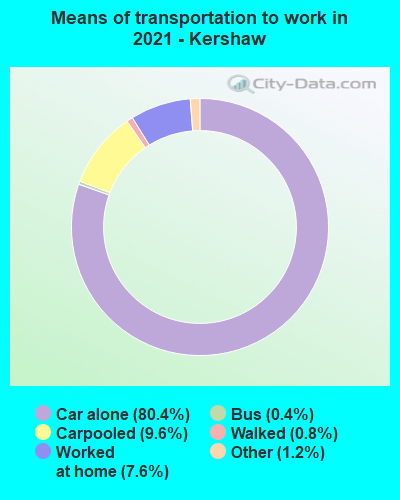
Means of transportation to work:
- Drove a car alone: 15,553 (75.4%)
- Carpooled: 2,032 (9.9%)
- Bus: 52 (0.3%)
- Taxicab, motorcycle, or other means: 431 (2.1%)
- Bicycle: 34 (0.2%)
- Walked: 44 (0.2%)
- Worked at home: 2,581 (12.5%)
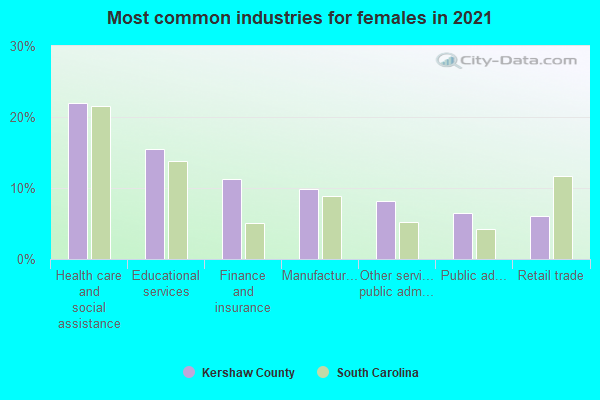
- Health care and social assistance (24%)
- Educational services (13%)
- Manufacturing (12%)
- Accommodation and food services (9%)
- Finance and insurance (8%)
- Retail trade (8%)
- Other services, except public administration (7%)
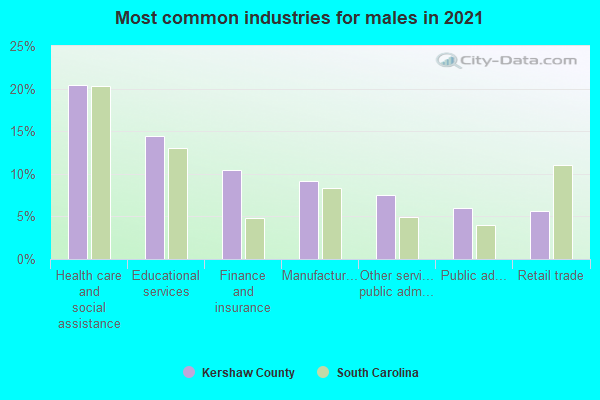
- Health care and social assistance (26%)
- Educational services (14%)
- Manufacturing (13%)
- Accommodation and food services (9%)
- Finance and insurance (9%)
- Retail trade (8%)
- Other services, except public administration (8%)
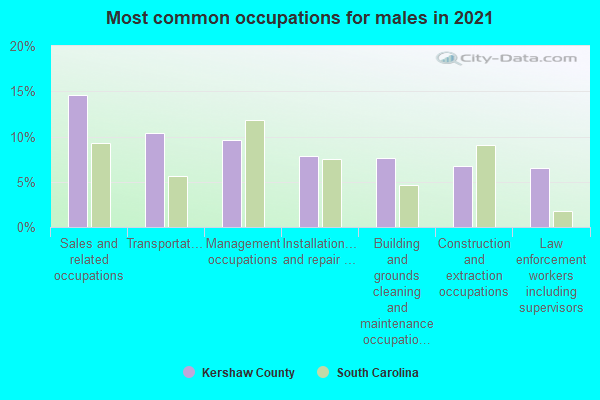
- Production occupations (17%)
- Construction and extraction occupations (15%)
- Transportation occupations (11%)
- Management occupations (9%)
- Building and grounds cleaning and maintenance occupations (8%)
- Sales and related occupations (7%)
- Installation, maintenance, and repair occupations (6%)
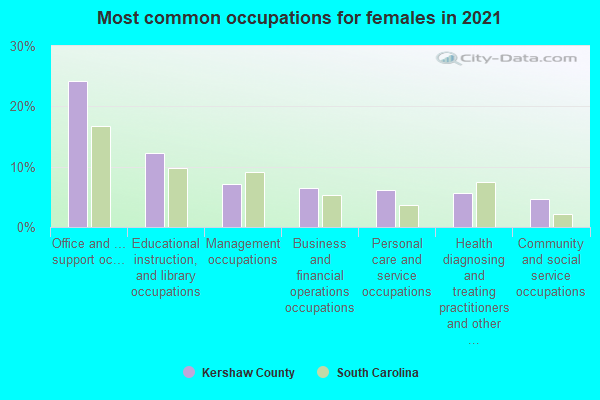
- Office and administrative support occupations (19%)
- Production occupations (12%)
- Educational instruction, and library occupations (11%)
- Management occupations (10%)
- Business and financial operations occupations (7%)
- Sales and related occupations (6%)
- Healthcare support occupations (6%)
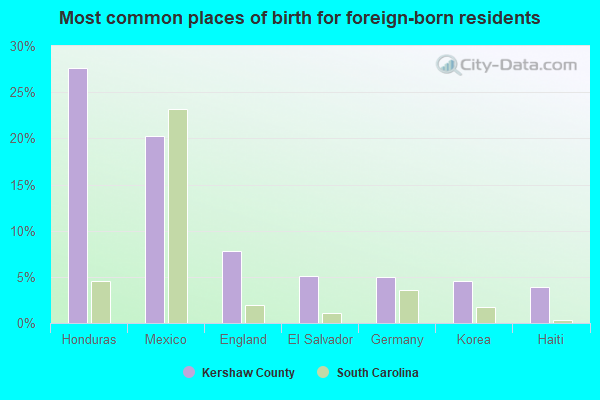
- Mexico (20%)
- Honduras (17%)
- El Salvador (8%)
- England (7%)
- Canada (6%)
- Germany (6%)
- Philippines (4%)
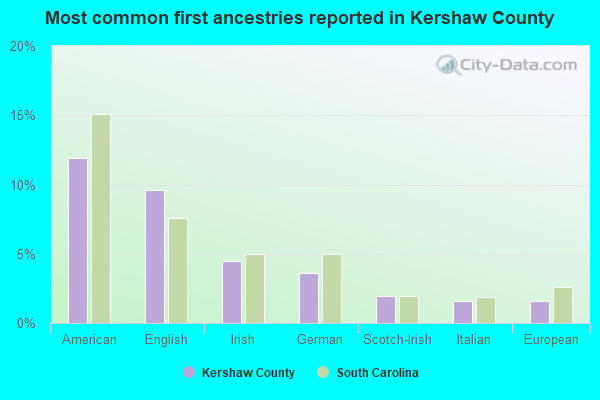
- American (13%)
- English (10%)
- Irish (5%)
- German (4%)
- Scotch-Irish (2%)
- European (2%)
- Italian (2%)
People in group quarters in Kershaw County, South Carolina in 2010:
- 252 people in nursing facilities/skilled-nursing facilities
- 125 people in college/university student housing
- 40 people in group homes intended for adults
- 33 people in other noninstitutional facilities
- 26 people in group homes for juveniles (non-correctional)
- 26 people in residential treatment centers for adults
- 16 people in workers' group living quarters and job corps centers
- 8 people in emergency and transitional shelters (with sleeping facilities) for people experiencing homelessness
People in group quarters in Kershaw County, South Carolina in 2000:
- 294 people in nursing homes
- 88 people in local jails and other confinement facilities (including police lockups)
- 70 people in other noninstitutional group quarters
- 68 people in homes for the mentally retarded
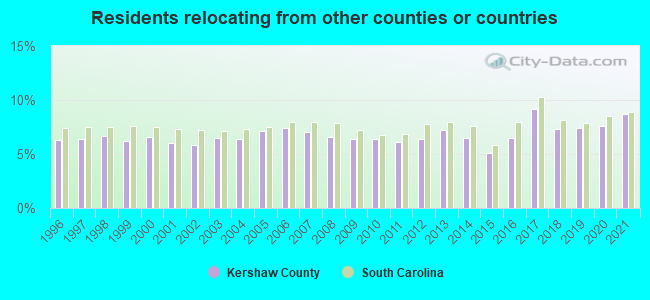
8.75% of this county's 2021 resident taxpayers lived in other counties in 2020 ($59,796 average adjusted gross income)
| Here: | 8.75% |
| South Carolina average: | 8.89% |
0.09% of residents moved from foreign countries ($639 average AGI)
Kershaw County: 0.09% South Carolina average: 0.04%
5.37% relocated from other counties in South Carolina ($31,885 average AGI)
3.29% relocated from other states ($27,272 average AGI)
Kershaw County: 3.29% South Carolina average: 4.96%
Top counties from which taxpayers relocated into this county between 2020 and 2021:
| from Richland County, SC | |
| from Lexington County, SC | |
| from Lancaster County, SC | |
| from Lee County, SC | |
| from Sumter County, SC | |
| from York County, SC | |
| from Fairfield County, SC |
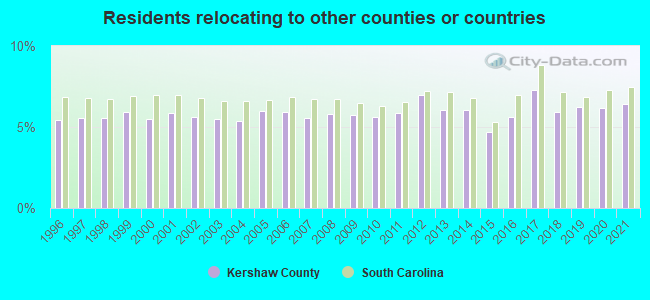
6.45% of this county's 2020 resident taxpayers moved to other counties in 2021 ($53,425 average adjusted gross income)
| Here: | 6.45% |
| South Carolina average: | 7.46% |
10 or fewer of this county's residents moved to foreign countries.
4.31% relocated to other counties in South Carolina ($34,333 average AGI)
2.14% relocated to other states ($19,093 average AGI)
Kershaw County: 2.14% South Carolina average: 3.47%
Top counties to which taxpayers relocated from this county between 2020 and 2021:
| to Richland County, SC | |
| to Lexington County, SC | |
| to Lancaster County, SC | |
| to Lee County, SC | |
| to Sumter County, SC | |
| to Fairfield County, SC | |
| to Horry County, SC |
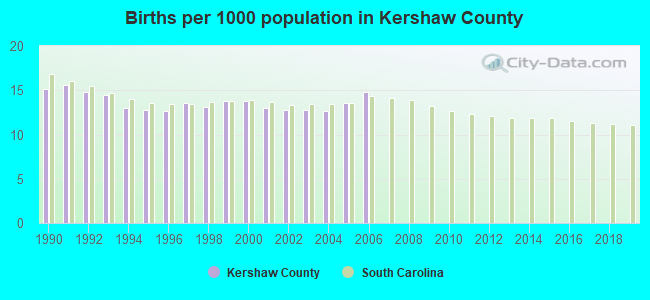
Births per 1000 population from 1990 to 1999: 13.9
Births per 1000 population from 2000 to 2006: 13.4
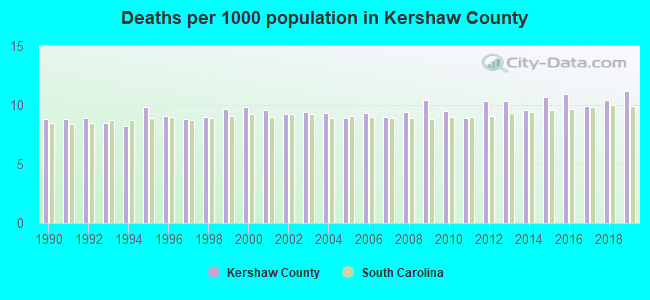
Deaths per 1000 population from 1990 to 1999: 9.0
Deaths per 1000 population from 2000 to 2009: 9.4
Deaths per 1000 population from 2010 to 2020: 10.4
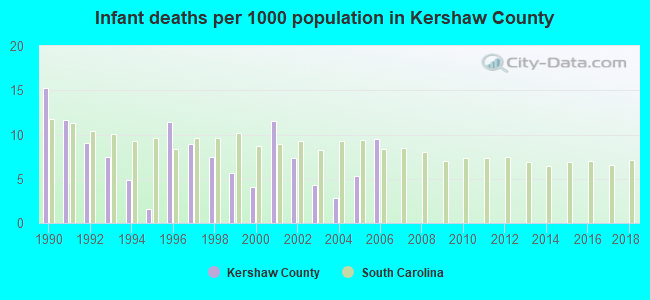
Infant deaths per 1000 live births from 1990 to 1999: 8.3
Infant deaths per 1000 live births from 2000 to 2006: 6.4
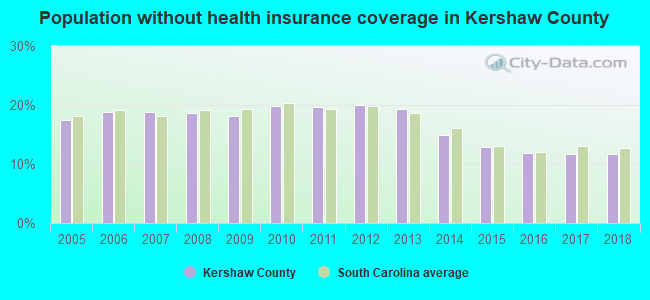
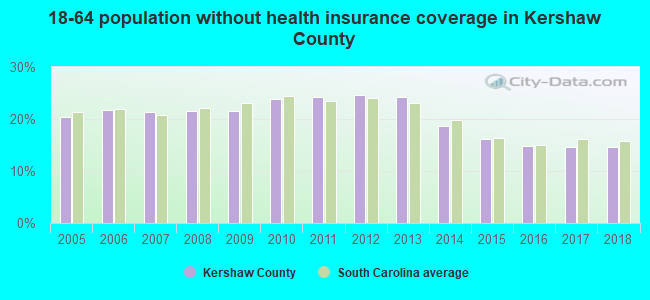
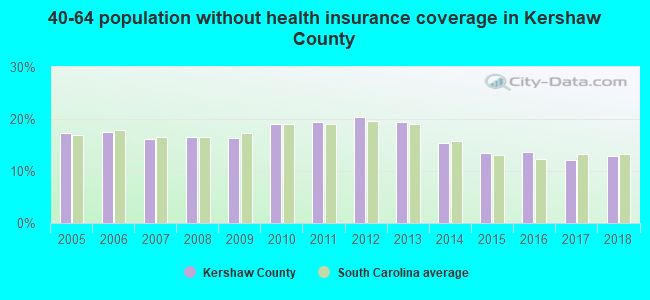
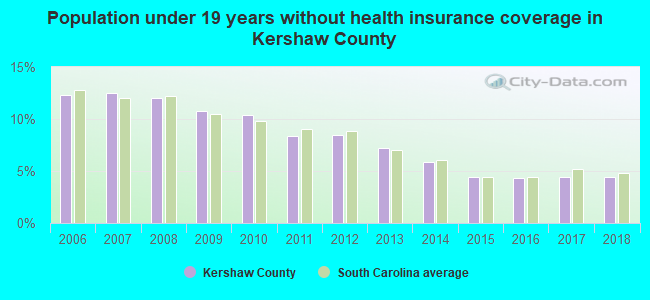
Persons under 19 years old without health insurance coverage in 2018: 4.4%
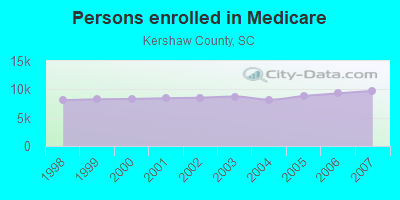
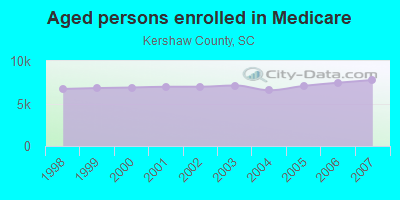
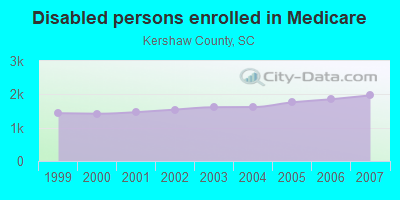
Persons enrolled in hospital insurance and/or supplemental medical insurance (Medicare) in July 1, 2007: 9,735 (7,766 aged, 1,969 disabled)
Children under 18 without health insurance coverage in 2007: 1,771 (12%)
Most common underlying causes of death in Kershaw County, South Carolina in 1999 - 2019:
- Bronchus or lung, unspecified - Malignant neoplasms (897)
- Acute myocardial infarction, unspecified (766)
- Atherosclerotic heart disease (642)
- Chronic obstructive pulmonary disease, unspecified (552)
- Unspecified dementia (445)
- Stroke, not specified as haemorrhage or infarction (388)
- Unspecified diabetes mellitus, without complications (263)
- Colon, unspecified - Malignant neoplasms (193)
- Pneumonia, unspecified (187)
- Congestive heart failure (157)
Population without health insurance coverage in 2000: 14%
Children under 18 without health insurance coverage in 2000: 11%
Short term general hospital admissions per 100,000 population in 2004: 9,499
Short term general hospital beds per 100,000 population in 2004: 351
Emergency room visits per 100,000 population in 2004: 39,913
General practice office based MDs per 100,000 population in 2005: 1,243
Medical specialist MDs per 100,000 population in 2005: 883
Dentists per 100,000 population in 1998: 16
Total births per 100,000 population, July 2005 - July 2006 : 31
Total deaths per 100,000 population, July 2005 - July 2006: 57
Limited-service eating places per 100,000 population in 2005 : 5
Suicides per 1,000,000 population from 2000 to 2006: 115.3. This is more than state average.
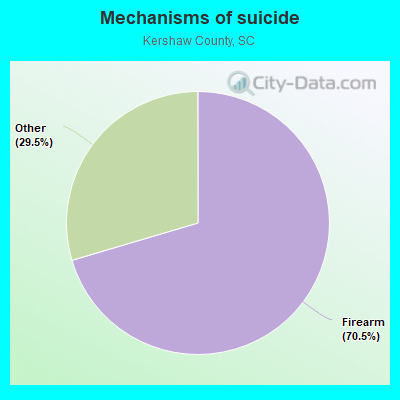
- Firearm - 81.2
- Other - 34.1
Household type by relationship:
Households: 67,751- Male householders: 12,504 (3,010 living alone), Female householders: 14,248 (4,126 living alone)
13,967 spouses (13,967 opposite-sex spouses), 1,674 unmarried partners, (1,635 opposite-sex unmarried partners), 18,782 children (16,706 natural, 1,002 adopted, 1,074 stepchildren), 1,222 grandchildren, 575 brothers or sisters, 1,607 parents, 0 foster children, 1,217 other relatives, 1,616 non-relatives
- In group quarters: 339
Size of family households: 7,906 2-persons, 3,900 3-persons, 3,022 4-persons, 1,482 5-persons, 961 6-persons, 186 7-or-more-persons.
Size of nonfamily households: 7,136 1-person, 2,003 2-persons, 156 3-persons.
10,351 married couples with children.
3,470 single-parent households (649 men, 2,821 women).
94.8% of residents of Kershaw speak English at home.
4.1% of residents speak Spanish at home (62% speak English very well, 25% speak English well, 9% speak English not well, 4% don't speak English at all).
0.6% of residents speak other Indo-European language at home (68% speak English very well, 22% speak English well, 10% speak English not well).
0.4% of residents speak Asian or Pacific Island language at home (83% speak English very well, 17% speak English well).
In fiscal year 2004:
Federal Government expenditure: $273,834,000 ($4,935 per capita)
Department of Defense expenditure: $16,620,000
Federal direct payments to individuals for retirement and disability: $150,390,000
Federal other direct payments to individuals: $52,067,000
Federal direct payments not to individuals: $582,000
Federal grants: $59,144,000
Federal procurement contracts: $1,853,000 ($262,000 Department of Defense)
Federal salaries and wages: $9,799,000 ($3,223,000 Department of Defense)
Federal Government direct loans: $1,721,000
Federal guaranteed/insured loans: $20,710,000
Federal Government insurance: $38,629,000
Population change from April 1, 2000 to July 1, 2005:
Births: 3,736| Here: | 66 per 1000 residents |
| State: | 69 per 1000 residents |
Deaths: 2,716
| Here: | 48 per 1000 residents |
| State: | 46 per 1000 residents |
Net international migration: +94
| Here: | +2 per 1000 residents |
| State: | +9 per 1000 residents |
Net internal migration: +2,808
| Here: | +50 per 1000 residents |
| State: | +27 per 1000 residents |
Total withdrawal of fresh water for public supply: 7.28 millions of gallons per day (31% from ground, 69% from surface)
| Here: | 6.4 |
| State: | 6.4 |
| Here: | 5.0 |
| State: | 4.5 |
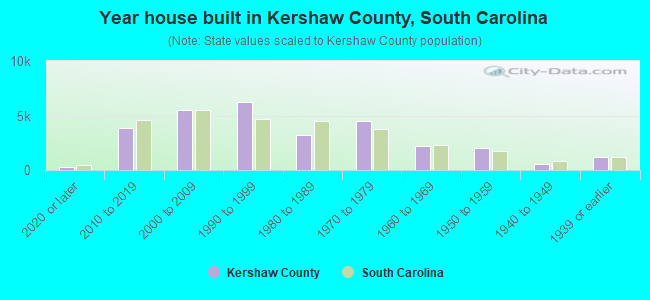
- Year house built in Kershaw County, South Carolina
- 3822020 or later
- 4,1162010 to 2019
- 6,1392000 to 2009
- 5,9411990 to 1999
- 4,7731980 to 1989
- 3,6851970 to 1979
- 2,3911960 to 1969
- 1,7541950 to 1959
- 6421940 to 1949
- 4461939 or earlier
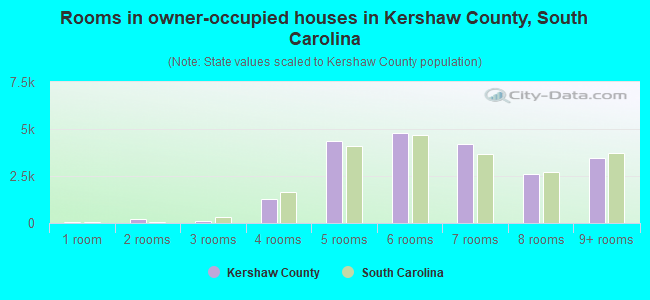
- Rooms in owner-occupied houses in Kershaw County, South Carolina
- 01 room
- 02 rooms
- 2773 rooms
- 8414 rooms
- 5,0645 rooms
- 4,6306 rooms
- 4,4047 rooms
- 2,6018 rooms
- 3,2889+ rooms
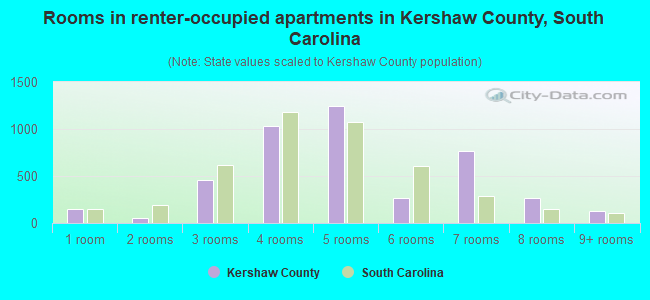
- Rooms in renter-occupied apartments in Kershaw County, South Carolina
- 1001 room
- 172 rooms
- 6813 rooms
- 1,0914 rooms
- 1,7935 rooms
- 6556 rooms
- 9017 rooms
- 2758 rooms
- 1349+ rooms
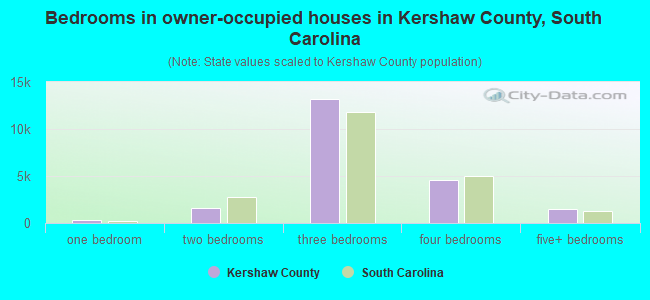
- Bedrooms in owner-occupied houses in Kershaw County, South Carolina
- 0no bedroom
- 1361 bedroom
- 2,2122 bedrooms
- 13,6653 bedrooms
- 3,9964 bedrooms
- 1,0965+ bedrooms
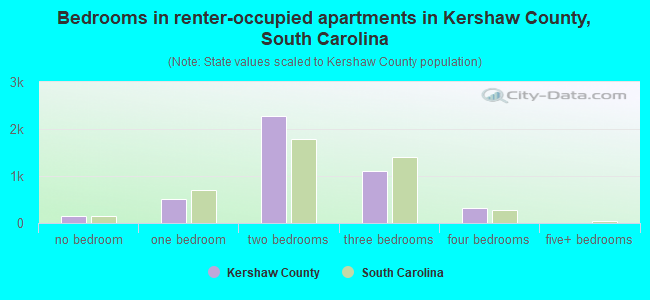
- Bedrooms in renter-occupied apartments in Kershaw County, South Carolina
- 117no bedroom
- 5211 bedroom
- 1,7382 bedrooms
- 2,5443 bedrooms
- 7274 bedrooms
- 05+ bedrooms
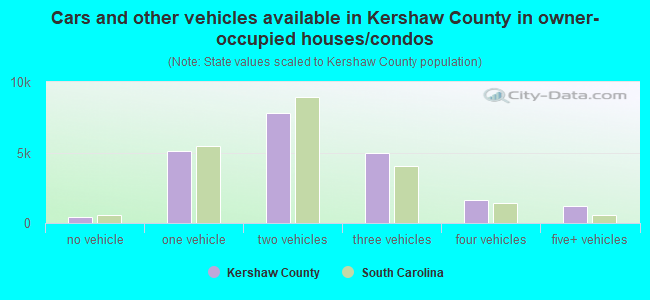
- Cars and other vehicles available in Kershaw County in owner-occupied houses/condos
- 195no vehicle
- 5,0661 vehicle
- 8,5622 vehicles
- 4,5633 vehicles
- 1,9904 vehicles
- 7295+ vehicles
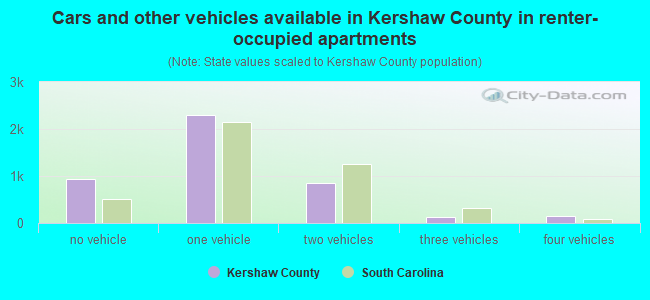
- Cars and other vehicles available in Kershaw County in renter-occupied apartments
- 471no vehicle
- 2,5301 vehicle
- 2,0722 vehicles
- 3303 vehicles
- 334 vehicles
- 2115+ vehicles
89.6% of Kershaw County residents lived in the same house 1 years ago.
Out of people who lived in different houses, 22% lived in this county.
Out of people who lived in different counties, 61% lived in South Carolina.
| Kershaw County: | 89.6% |
| State average: | 86.5% |
Place of birth for U.S.-born residents:
- This state: 41,314
- Other state: 23,545
- Northeast: 5,948
- Midwest: 4,255
- South: 9,800
- West: 3,542
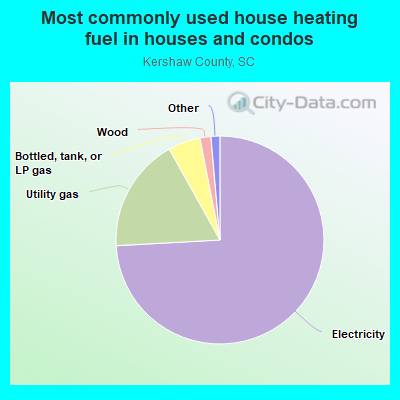
- 71.4%Electricity
- 20.1%Utility gas
- 5.1%Bottled, tank, or LP gas
- 1.6%Wood
- 0.9%Fuel oil, kerosene, etc.
- 0.5%No fuel used
- 0.2%Solar energy
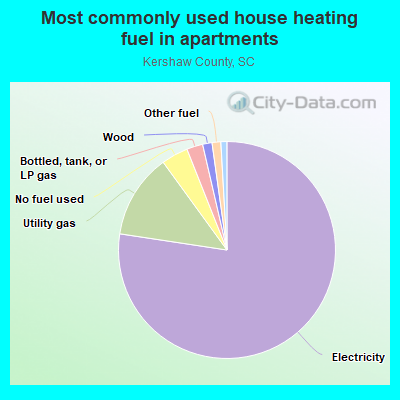
- 76.0%Electricity
- 12.6%Utility gas
- 3.9%No fuel used
- 3.5%Bottled, tank, or LP gas
- 2.0%Wood
- 1.5%Other fuel
- 0.4%Coal or coke
- 0.2%Fuel oil, kerosene, etc.
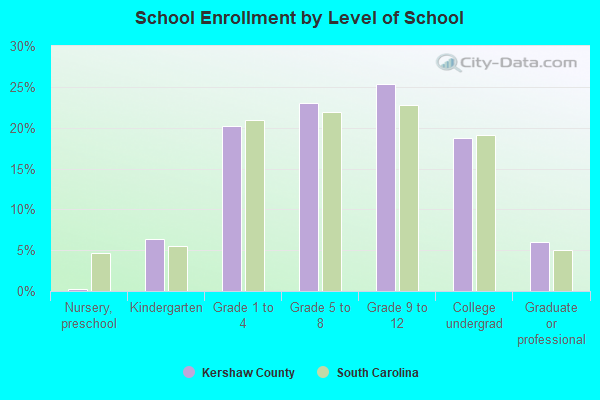
Private vs. public school enrollment:
| Here: | 9.3% |
| South Carolina: | 14.4% |
| Here: | 8.4% |
| South Carolina: | 11.1% |
| Here: | 26.6% |
| South Carolina: | 21.9% |
Kershaw County government finances - Expenditure in 2020:
- Bond Funds - Cash and Securities: $21,451,000
Cash and Securities: $16,982,000
- Charges - Solid Waste Management: $2,438,000
Solid Waste Management: $2,371,000
Regular Highways: $2,184,000
Regular Highways: $2,124,000
Sewerage: $1,682,000
Sewerage: $1,636,000
Other: $433,000
Other: $421,000
Parks and Recreation: $309,000
Parks and Recreation: $300,000
- Current Operations - Police Protection: $6,822,000
Police Protection: $6,133,000
Solid Waste Management: $2,966,000
Solid Waste Management: $2,666,000
Financial Administration: $2,659,000
Correctional Institutions: $2,463,000
Judicial and Legal Services: $2,393,000
Financial Administration: $2,391,000
Correctional Institutions: $2,215,000
Judicial and Legal Services: $2,151,000
General - Other: $1,884,000
General - Other: $1,694,000
Parks and Recreation: $1,642,000
Sewerage: $1,634,000
Parks and Recreation: $1,476,000
Sewerage: $1,469,000
Regular Highways: $1,403,000
Local Fire Protection: $1,265,000
Regular Highways: $1,262,000
Libraries: $1,161,000
Local Fire Protection: $1,137,000
Central Staff Services: $1,069,000
Libraries: $1,044,000
Central Staff Services: $961,000
General Public Buildings: $862,000
General Public Buildings: $775,000
Protective Inspection and Regulation - Other: $528,000
Protective Inspection and Regulation - Other: $475,000
Public Welfare Institutions: $284,000
Public Welfare Institutions: $255,000
Health - Other: $208,000
Health - Other: $187,000
Air Transportation: $170,000
Air Transportation: $153,000
- General - Interest on Debt: $1,329,000
Interest on Debt: $1,216,000
- Local Intergovernmental - Other: $2,437,000
Other: $2,437,000
- Long Term Debt - Beginning Outstanding - Unspecified Public Purpose: $33,224,000
Outstanding Unspecified Public Purpose: $31,403,000
Beginning Outstanding - Unspecified Public Purpose: $29,064,000
Outstanding Unspecified Public Purpose: $26,725,000
Retired Unspecified Public Purpose: $2,339,000
Retired Unspecified Public Purpose: $2,339,000
Issue, Unspecified Public Purpose: $518,000
- Miscellaneous - General Revenue - Other: $1,954,000
General Revenue - Other: $1,639,000
Fines and Forfeits: $859,000
Fines and Forfeits: $720,000
Interest Earnings: $199,000
Interest Earnings: $167,000
- Other Funds - Cash and Securities: $53,042,000
Cash and Securities: $41,992,000
- Sinking Funds - Cash and Securities: $615,000
Cash and Securities: $487,000
- State Intergovernmental - Other: $2,541,000
Other: $2,427,000
- Tax - Property: $14,803,000
Property: $13,696,000
Other License: $7,499,000
Other License: $6,938,000
General Sales and Gross Receipts: $4,731,000
General Sales and Gross Receipts: $4,377,000
Kershaw County government finances - Revenue in 2020:
- Bond Funds - Cash and Securities: $21,451,000
Cash and Securities: $16,982,000
- Charges - Solid Waste Management: $2,438,000
Solid Waste Management: $2,371,000
Regular Highways: $2,184,000
Regular Highways: $2,124,000
Sewerage: $1,682,000
Sewerage: $1,636,000
Other: $433,000
Other: $421,000
Parks and Recreation: $309,000
Parks and Recreation: $300,000
- Current Operations - Police Protection: $6,822,000
Police Protection: $6,133,000
Solid Waste Management: $2,966,000
Solid Waste Management: $2,666,000
Financial Administration: $2,659,000
Correctional Institutions: $2,463,000
Judicial and Legal Services: $2,393,000
Financial Administration: $2,391,000
Correctional Institutions: $2,215,000
Judicial and Legal Services: $2,151,000
General - Other: $1,884,000
General - Other: $1,694,000
Parks and Recreation: $1,642,000
Sewerage: $1,634,000
Parks and Recreation: $1,476,000
Sewerage: $1,469,000
Regular Highways: $1,403,000
Local Fire Protection: $1,265,000
Regular Highways: $1,262,000
Libraries: $1,161,000
Local Fire Protection: $1,137,000
Central Staff Services: $1,069,000
Libraries: $1,044,000
Central Staff Services: $961,000
General Public Buildings: $862,000
General Public Buildings: $775,000
Protective Inspection and Regulation - Other: $528,000
Protective Inspection and Regulation - Other: $475,000
Public Welfare Institutions: $284,000
Public Welfare Institutions: $255,000
Health - Other: $208,000
Health - Other: $187,000
Air Transportation: $170,000
Air Transportation: $153,000
- General - Interest on Debt: $1,329,000
Interest on Debt: $1,216,000
- Local Intergovernmental - Other: $2,437,000
Other: $2,437,000
- Long Term Debt - Beginning Outstanding - Unspecified Public Purpose: $33,224,000
Outstanding Unspecified Public Purpose: $31,403,000
Beginning Outstanding - Unspecified Public Purpose: $29,064,000
Outstanding Unspecified Public Purpose: $26,725,000
Retired Unspecified Public Purpose: $2,339,000
Retired Unspecified Public Purpose: $2,339,000
Issue, Unspecified Public Purpose: $518,000
- Miscellaneous - General Revenue - Other: $1,954,000
General Revenue - Other: $1,639,000
Fines and Forfeits: $859,000
Fines and Forfeits: $720,000
Interest Earnings: $199,000
Interest Earnings: $167,000
- Other Funds - Cash and Securities: $53,042,000
Cash and Securities: $41,992,000
- Sinking Funds - Cash and Securities: $615,000
Cash and Securities: $487,000
- State Intergovernmental - Other: $2,541,000
Other: $2,427,000
- Tax - Property: $14,803,000
Property: $13,696,000
Other License: $7,499,000
Other License: $6,938,000
General Sales and Gross Receipts: $4,731,000
General Sales and Gross Receipts: $4,377,000
Kershaw County government finances - Debt in 2020:
- Bond Funds - Cash and Securities: $21,451,000
Cash and Securities: $16,982,000
- Charges - Solid Waste Management: $2,438,000
Solid Waste Management: $2,371,000
Regular Highways: $2,184,000
Regular Highways: $2,124,000
Sewerage: $1,682,000
Sewerage: $1,636,000
Other: $433,000
Other: $421,000
Parks and Recreation: $309,000
Parks and Recreation: $300,000
- Current Operations - Police Protection: $6,822,000
Police Protection: $6,133,000
Solid Waste Management: $2,966,000
Solid Waste Management: $2,666,000
Financial Administration: $2,659,000
Correctional Institutions: $2,463,000
Judicial and Legal Services: $2,393,000
Financial Administration: $2,391,000
Correctional Institutions: $2,215,000
Judicial and Legal Services: $2,151,000
General - Other: $1,884,000
General - Other: $1,694,000
Parks and Recreation: $1,642,000
Sewerage: $1,634,000
Parks and Recreation: $1,476,000
Sewerage: $1,469,000
Regular Highways: $1,403,000
Local Fire Protection: $1,265,000
Regular Highways: $1,262,000
Libraries: $1,161,000
Local Fire Protection: $1,137,000
Central Staff Services: $1,069,000
Libraries: $1,044,000
Central Staff Services: $961,000
General Public Buildings: $862,000
General Public Buildings: $775,000
Protective Inspection and Regulation - Other: $528,000
Protective Inspection and Regulation - Other: $475,000
Public Welfare Institutions: $284,000
Public Welfare Institutions: $255,000
Health - Other: $208,000
Health - Other: $187,000
Air Transportation: $170,000
Air Transportation: $153,000
- General - Interest on Debt: $1,329,000
Interest on Debt: $1,216,000
- Local Intergovernmental - Other: $2,437,000
Other: $2,437,000
- Long Term Debt - Beginning Outstanding - Unspecified Public Purpose: $33,224,000
Outstanding Unspecified Public Purpose: $31,403,000
Beginning Outstanding - Unspecified Public Purpose: $29,064,000
Outstanding Unspecified Public Purpose: $26,725,000
Retired Unspecified Public Purpose: $2,339,000
Retired Unspecified Public Purpose: $2,339,000
Issue, Unspecified Public Purpose: $518,000
- Miscellaneous - General Revenue - Other: $1,954,000
General Revenue - Other: $1,639,000
Fines and Forfeits: $859,000
Fines and Forfeits: $720,000
Interest Earnings: $199,000
Interest Earnings: $167,000
- Other Funds - Cash and Securities: $53,042,000
Cash and Securities: $41,992,000
- Sinking Funds - Cash and Securities: $615,000
Cash and Securities: $487,000
- State Intergovernmental - Other: $2,541,000
Other: $2,427,000
- Tax - Property: $14,803,000
Property: $13,696,000
Other License: $7,499,000
Other License: $6,938,000
General Sales and Gross Receipts: $4,731,000
General Sales and Gross Receipts: $4,377,000
Kershaw County government finances - Cash and Securities in 2020:
- Bond Funds - Cash and Securities: $21,451,000
Cash and Securities: $16,982,000
- Charges - Solid Waste Management: $2,438,000
Solid Waste Management: $2,371,000
Regular Highways: $2,184,000
Regular Highways: $2,124,000
Sewerage: $1,682,000
Sewerage: $1,636,000
Other: $433,000
Other: $421,000
Parks and Recreation: $309,000
Parks and Recreation: $300,000
- Current Operations - Police Protection: $6,822,000
Police Protection: $6,133,000
Solid Waste Management: $2,966,000
Solid Waste Management: $2,666,000
Financial Administration: $2,659,000
Correctional Institutions: $2,463,000
Judicial and Legal Services: $2,393,000
Financial Administration: $2,391,000
Correctional Institutions: $2,215,000
Judicial and Legal Services: $2,151,000
General - Other: $1,884,000
General - Other: $1,694,000
Parks and Recreation: $1,642,000
Sewerage: $1,634,000
Parks and Recreation: $1,476,000
Sewerage: $1,469,000
Regular Highways: $1,403,000
Local Fire Protection: $1,265,000
Regular Highways: $1,262,000
Libraries: $1,161,000
Local Fire Protection: $1,137,000
Central Staff Services: $1,069,000
Libraries: $1,044,000
Central Staff Services: $961,000
General Public Buildings: $862,000
General Public Buildings: $775,000
Protective Inspection and Regulation - Other: $528,000
Protective Inspection and Regulation - Other: $475,000
Public Welfare Institutions: $284,000
Public Welfare Institutions: $255,000
Health - Other: $208,000
Health - Other: $187,000
Air Transportation: $170,000
Air Transportation: $153,000
- General - Interest on Debt: $1,329,000
Interest on Debt: $1,216,000
- Local Intergovernmental - Other: $2,437,000
Other: $2,437,000
- Long Term Debt - Beginning Outstanding - Unspecified Public Purpose: $33,224,000
Outstanding Unspecified Public Purpose: $31,403,000
Beginning Outstanding - Unspecified Public Purpose: $29,064,000
Outstanding Unspecified Public Purpose: $26,725,000
Retired Unspecified Public Purpose: $2,339,000
Retired Unspecified Public Purpose: $2,339,000
Issue, Unspecified Public Purpose: $518,000
- Miscellaneous - General Revenue - Other: $1,954,000
General Revenue - Other: $1,639,000
Fines and Forfeits: $859,000
Fines and Forfeits: $720,000
Interest Earnings: $199,000
Interest Earnings: $167,000
- Other Funds - Cash and Securities: $53,042,000
Cash and Securities: $41,992,000
- Sinking Funds - Cash and Securities: $615,000
Cash and Securities: $487,000
- State Intergovernmental - Other: $2,541,000
Other: $2,427,000
- Tax - Property: $14,803,000
Property: $13,696,000
Other License: $7,499,000
Other License: $6,938,000
General Sales and Gross Receipts: $4,731,000
General Sales and Gross Receipts: $4,377,000
Supplemental Security Income (SSI) in 2006:
- Total number of recipients: 1,352
- Number of aged recipients: 150
- Number of blind and disabled recipients: 1,202
- Number of recipients under 18: 273
- Number of recipients between 18 and 64: 787
- Number of recipients older than 64: 292
- Number of recipients also receiving OASDI: 514
- Amount of payments (thousands of dollars): 554
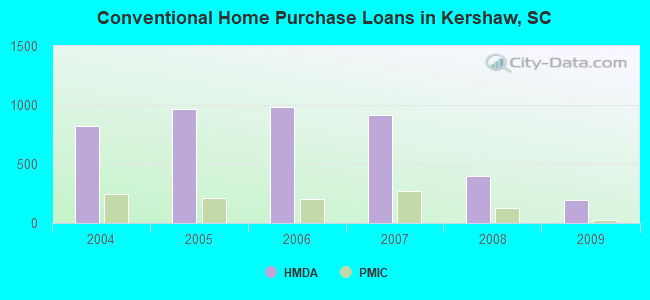
| Home Mortgage Disclosure Act Aggregated Statistics For Year 2009 (Based on 11 full tracts) | ||||||||||||||
| A) FHA, FSA/RHS & VA Home Purchase Loans | B) Conventional Home Purchase Loans | C) Refinancings | D) Home Improvement Loans | E) Loans on Dwellings For 5+ Families | F) Non-occupant Loans on < 5 Family Dwellings (A B C & D) | G) Loans On Manufactured Home Dwelling (A B C & D) | ||||||||
|---|---|---|---|---|---|---|---|---|---|---|---|---|---|---|
| Number | Average Value | Number | Average Value | Number | Average Value | Number | Average Value | Number | Average Value | Number | Average Value | Number | Average Value | |
| LOANS ORIGINATED | 376 | $144,098 | 199 | $130,151 | 1,164 | $160,481 | 33 | $54,576 | 1 | $609,000 | 129 | $169,333 | 65 | $61,831 |
| APPLICATIONS APPROVED, NOT ACCEPTED | 13 | $120,308 | 26 | $130,462 | 80 | $151,662 | 3 | $9,667 | 0 | $0 | 13 | $195,385 | 17 | $50,765 |
| APPLICATIONS DENIED | 49 | $129,612 | 71 | $82,451 | 475 | $136,573 | 32 | $37,000 | 0 | $0 | 21 | $154,381 | 80 | $67,300 |
| APPLICATIONS WITHDRAWN | 37 | $137,216 | 18 | $136,556 | 256 | $150,828 | 10 | $71,200 | 0 | $0 | 14 | $181,357 | 8 | $60,250 |
| FILES CLOSED FOR INCOMPLETENESS | 18 | $132,667 | 8 | $263,375 | 42 | $145,667 | 0 | $0 | 0 | $0 | 5 | $205,400 | 4 | $67,750 |
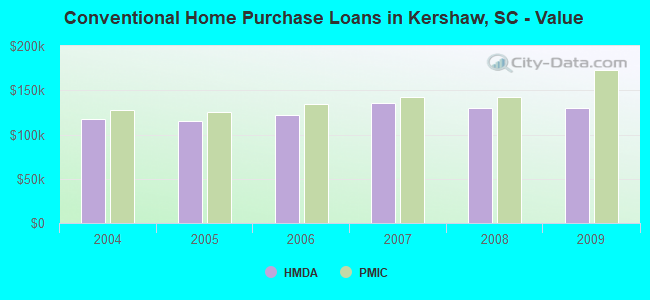
| Private Mortgage Insurance Companies Aggregated Statistics For Year 2009 (Based on 11 full tracts) | ||||||||
| A) Conventional Home Purchase Loans | B) Refinancings | C) Non-occupant Loans on < 5 Family Dwellings (A & B) | D) Loans On Manufactured Home Dwelling (A & B) | |||||
|---|---|---|---|---|---|---|---|---|
| Number | Average Value | Number | Average Value | Number | Average Value | Number | Average Value | |
| LOANS ORIGINATED | 29 | $172,897 | 38 | $163,000 | 1 | $243,000 | 1 | $243,000 |
| APPLICATIONS APPROVED, NOT ACCEPTED | 11 | $251,545 | 31 | $202,129 | 1 | $333,000 | 0 | $0 |
| APPLICATIONS DENIED | 5 | $231,800 | 5 | $190,200 | 0 | $0 | 0 | $0 |
| APPLICATIONS WITHDRAWN | 2 | $238,500 | 6 | $146,667 | 0 | $0 | 0 | $0 |
| FILES CLOSED FOR INCOMPLETENESS | 3 | $257,667 | 1 | $67,000 | 1 | $256,000 | 0 | $0 |
| Most common first names in Kershaw County, SC among deceased individuals | ||
| Name | Count | Lived (average) |
|---|---|---|
| James | 404 | 71.5 years |
| John | 311 | 72.1 years |
| William | 292 | 72.1 years |
| Mary | 284 | 76.8 years |
| Robert | 185 | 70.8 years |
| Willie | 151 | 71.2 years |
| George | 137 | 72.1 years |
| Charles | 128 | 68.3 years |
| Thomas | 127 | 70.2 years |
| Henry | 110 | 72.5 years |
| Most common last names in Kershaw County, SC among deceased individuals | ||
| Last name | Count | Lived (average) |
|---|---|---|
| Williams | 171 | 73.5 years |
| Brown | 163 | 69.3 years |
| Branham | 157 | 74.3 years |
| Jones | 133 | 74.0 years |
| Johnson | 118 | 69.0 years |
| Smith | 108 | 75.2 years |
| Davis | 107 | 74.3 years |
| Jackson | 98 | 72.9 years |
| Robinson | 74 | 71.5 years |
| Anderson | 74 | 74.9 years |
| Businesses in Kershaw County, SC | ||||
| Name | Count | Name | Count | |
|---|---|---|---|---|
| AT&T | 1 | Lowe's | 1 | |
| Ace Hardware | 1 | MasterBrand Cabinets | 2 | |
| Advance Auto Parts | 3 | McDonald's | 3 | |
| Arby's | 1 | Nike | 1 | |
| AutoZone | 2 | Papa John's Pizza | 1 | |
| Blockbuster | 1 | Payless | 1 | |
| Burger King | 2 | Pizza Hut | 1 | |
| CVS | 1 | Quality | 1 | |
| Chevrolet | 1 | RadioShack | 1 | |
| Comfort Inn | 1 | Ramada | 1 | |
| Curves | 1 | Rite Aid | 1 | |
| Dairy Queen | 1 | Rue21 | 1 | |
| Econo Lodge | 1 | SONIC Drive-In | 1 | |
| FedEx | 5 | Sears | 1 | |
| Ford | 1 | Subway | 2 | |
| GNC | 2 | T-Mobile | 1 | |
| Goodwill | 2 | Taco Bell | 1 | |
| H&R Block | 2 | Toyota | 1 | |
| Hardee's | 1 | U-Haul | 5 | |
| Holiday Inn | 1 | UPS | 6 | |
| KFC | 2 | Waffle House | 2 | |
| Kmart | 1 | Walgreens | 1 | |
| La-Z-Boy | 3 | Walmart | 1 | |
| Lane Furniture | 2 | Wendy's | 1 | |
| Little Caesars Pizza | 1 | |||