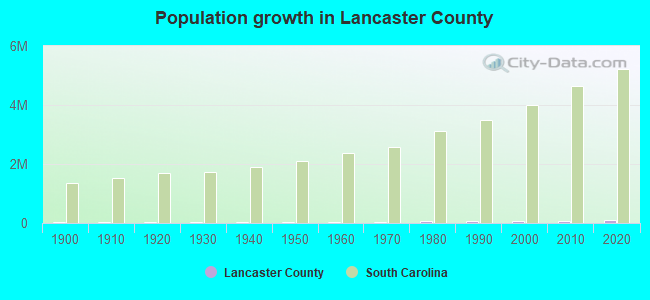
Lancaster County, South Carolina (SC)
County owner-occupied free and clear houses and condos in 2010: 7,648
County owner-occupied houses and condos in 2000: 17,435
Renter-occupied apartments: 7,257 (it was 5,743 in 2000)
| % of renters here: | 25% |
| State: | 31% |
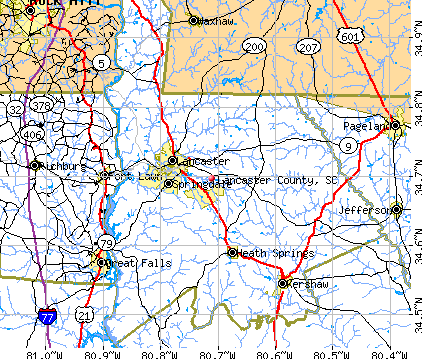
Land area: 549 sq. mi.
Water area: 6.3 sq. mi.
Population density: 190 people per square mile (high).
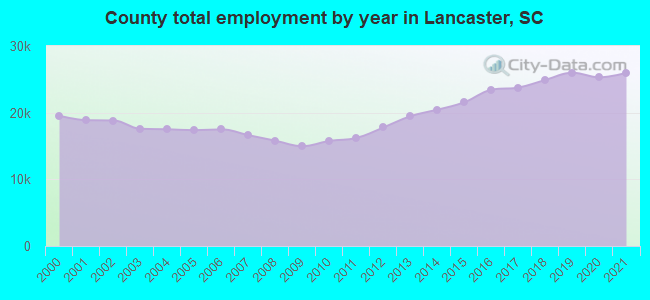
Industries providing employment: Educational, health and social services (19.2%), Manufacturing (16.5%), Professional, scientific, management, administrative, and waste management services (11.3%), Retail trade (10.8%), Finance, insurance, real estate, and rental and leasing (10.1%).
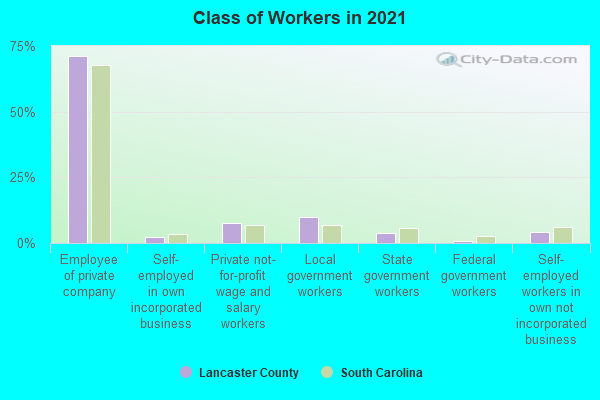
Type of workers:
- Private wage or salary: 81%
- Government: 14%
- Self-employed, not incorporated: 5%
- Unpaid family work: 0%
- OSM Map
- General Map
- Google Map
- MSN Map

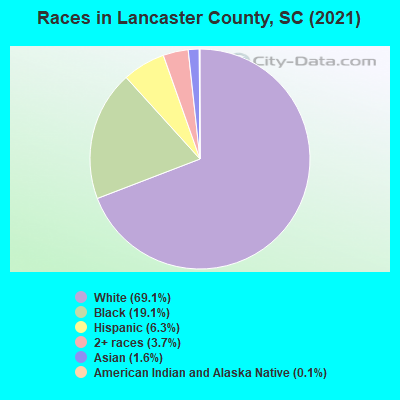
- 70,52267.4%White Non-Hispanic Alone
- 20,35619.5%Black Non-Hispanic Alone
- 7,2496.9%Hispanic or Latino
- 2,9672.8%Asian alone
- 2,8342.7%Two or more races
- 5300.5%Some other race alone
- 1190.1%American Indian and Alaska Native alone
| Median resident age: | 41.8 years |
| South Carolina median age: | 40.5 years |
| Males: 50,252 | |
| Females: 54,325 |


| Lancaster County: | 2.0 people |
| South Carolina: | 2 people |
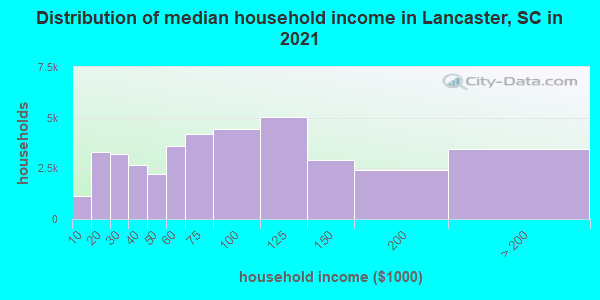
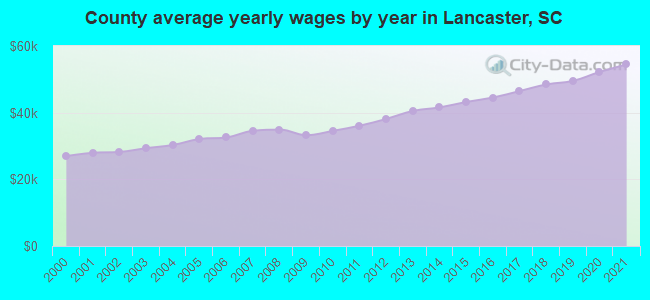
Estimated median household income in 2022: $68,108 ($34,688 in 1999)
| This county: | $68,108 |
| South Carolina: | $64,115 |
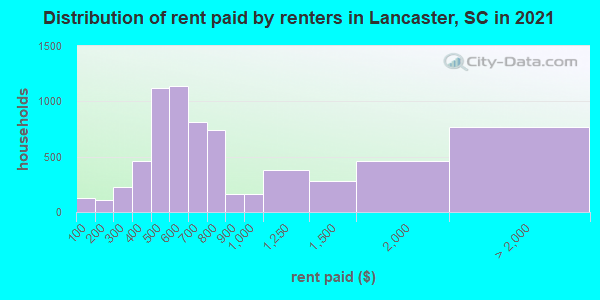
Median contract rent in 2022 for apartments: $534 (lower quartile is $457, upper quartile is $820)
| This county: | $534 |
| State: | $893 |
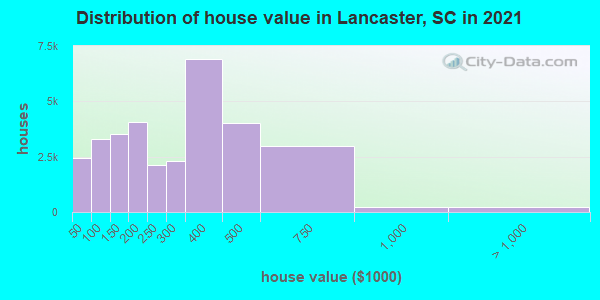
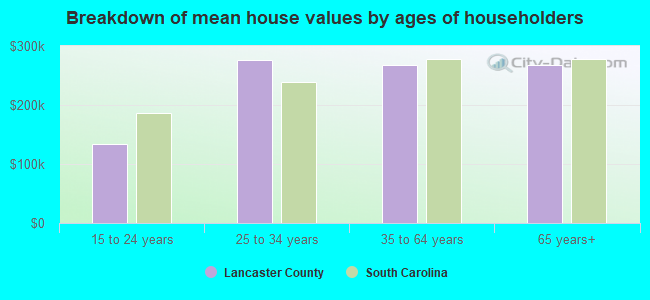
Estimated median house or condo value in 2022: $324,500 (it was $71,100 in 2000)
| Lancaster: | $324,500 |
| South Carolina: | $254,600 |
Median monthly housing costs for homes and condos with a mortgage: $1,422
Median monthly housing costs for units without a mortgage: $346
Institutionalized population: 2,013
Crime in 2021 (reported by the sheriff's office or county police, not the county total):
- Murders: 4
- Rapes: 63
- Robberies: 14
- Assaults: 287
- Burglaries: 233
- Thefts: 985
- Auto thefts: 111
Crime in 2020 (reported by the sheriff's office or county police, not the county total):
- Murders: 3
- Rapes: 37
- Robberies: 27
- Assaults: 253
- Burglaries: 331
- Thefts: 1244
- Auto thefts: 111
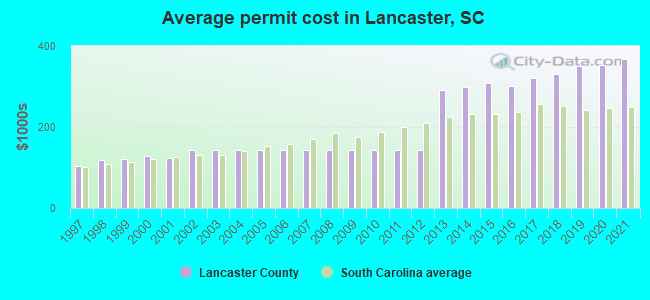
Single-family new house construction building permits:
- 2022: 1072 buildings, average cost: $432,800
- 2021: 1395 buildings, average cost: $368,800
- 2020: 1458 buildings, average cost: $352,400
- 2019: 1238 buildings, average cost: $351,400
- 2018: 1032 buildings, average cost: $329,700
- 2017: 976 buildings, average cost: $320,100
- 2016: 928 buildings, average cost: $299,900
- 2015: 1109 buildings, average cost: $307,500
- 2014: 1063 buildings, average cost: $298,600
- 2013: 1186 buildings, average cost: $292,400
- 2012: 124 buildings, average cost: $144,400
- 2011: 105 buildings, average cost: $142,200
- 2010: 120 buildings, average cost: $142,200
- 2009: 125 buildings, average cost: $143,500
- 2008: 188 buildings, average cost: $143,300
- 2007: 277 buildings, average cost: $144,400
- 2006: 359 buildings, average cost: $144,200
- 2005: 405 buildings, average cost: $144,400
- 2004: 373 buildings, average cost: $142,700
- 2003: 322 buildings, average cost: $141,700
- 2002: 307 buildings, average cost: $142,500
- 2001: 354 buildings, average cost: $123,000
- 2000: 362 buildings, average cost: $128,200
- 1999: 234 buildings, average cost: $120,200
- 1998: 227 buildings, average cost: $119,400
- 1997: 198 buildings, average cost: $102,800

Median real estate property taxes paid for housing units with mortgages in 2022: $1,816 (0.5%)
Median real estate property taxes paid for housing units with no mortgage in 2022: $1,006 (0.5%)
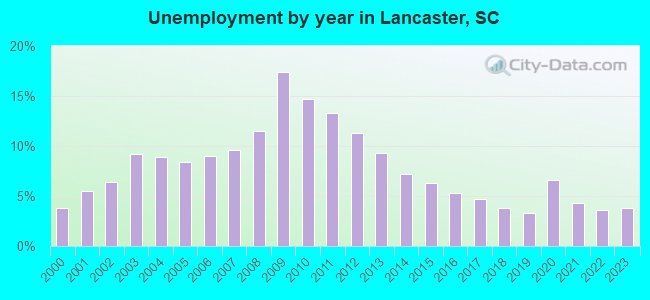
| Lancaster County: | 10.2% |
| South Carolina: | 14.0% |
Median age of residents in 2022: 41.8 years old
(Males: 41.4 years old, Females: 42.7 years old)
(Median age for: White residents: 46.7 years old, Black residents: 40.5 years old, American Indian residents: 47.8 years old, Asian residents: 39.4 years old, Hispanic or Latino residents: 28.7 years old, Other race residents: 28.1 years old)
Fair market rent in 2006 for a 1-bedroom apartment in Lancaster County is $411 a month.
Fair market rent for a 2-bedroom apartment is $481 a month.
Fair market rent for a 3-bedroom apartment is $661 a month.
Cities in this county include: Lancaster, Van Wyck, Tradesville, Lancaster Mill, Kershaw, Irwin, Heath Springs.
Neighboring counties: Caddo County, Oklahoma  , Fairfield County
  , Grant County, Arkansas , Harmon County, Oklahoma , Lincoln County, Tennessee , Scott County, Arkansas .
| Here: | 3.5% |
| South Carolina: | 3.1% |
Current college students: 1,936
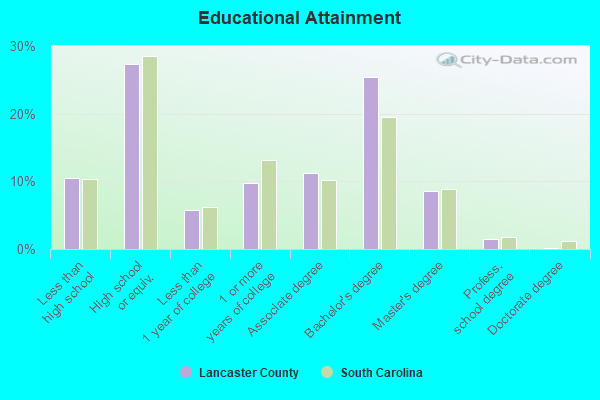
People 25 years of age or older with a high school degree or higher: 92.2%
People 25 years of age or older with a bachelor's degree or higher: 31.6%
Number of foreign born residents: 8,808 (50.1% naturalized citizens)
| Lancaster County: | 8.4% |
| Whole state: | 5.2% |
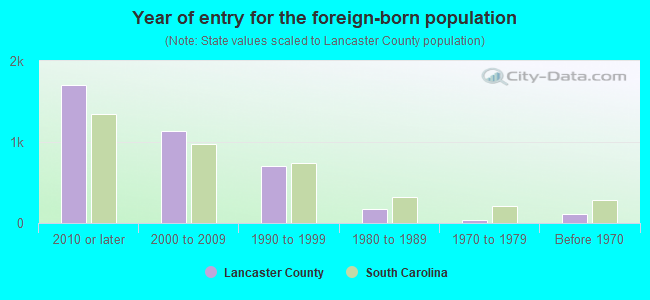
- Year of entry for the foreign-born population
- 2,5832010 or later
- 1,3002000 to 2009
- 7201990 to 1999
- 1741980 to 1989
- 381970 to 1979
- 112Before 1970
Mean travel time to work (commute): minutes
Percentage of county residents living and working in this county: 70.9%
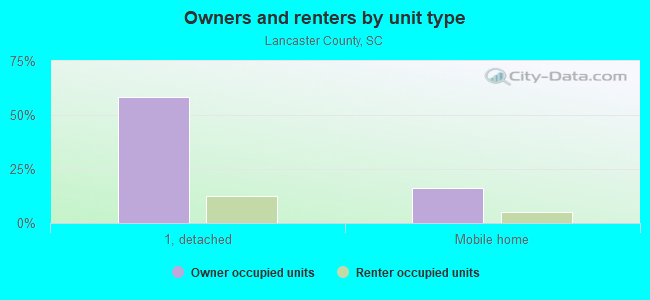
Housing units in structures:
- One, detached: 33,121
- One, attached: 1,992
- Two: 253
- 3 or 4: 1,199
- 5 to 9: 596
- 10 to 19: 307
- 20 or more: 303
- Mobile homes: 6,399
Housing units in Lancaster County with a mortgage: 21,751 (1,203 second mortgage, 42 home equity loan, 1,076 both second mortgage and home equity loan)
Houses without a mortgage: 888
| Here: | 2.3% with mortgage |
| State: | 97.3% with mortgage |
Religion statistics for Lancaster County
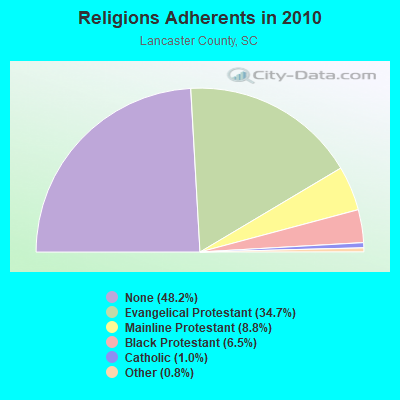
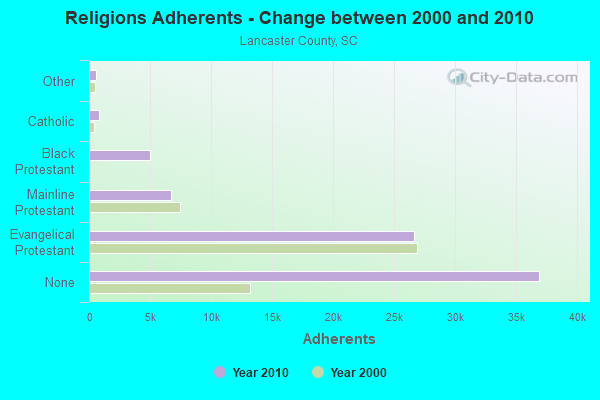
| Religion | Adherents | Congregations |
|---|---|---|
| Evangelical Protestant | 26,632 | 102 |
| Mainline Protestant | 6,741 | 33 |
| Black Protestant | 4,964 | 27 |
| Catholic | 780 | 2 |
| Other | 587 | 2 |
| None | 36,948 | - |
Source: Clifford Grammich, Kirk Hadaway, Richard Houseal, Dale E.Jones, Alexei Krindatch, Richie Stanley and Richard H.Taylor. 2012. 2010 U.S.Religion Census: Religious Congregations & Membership Study. Association of Statisticians of American Religious Bodies. Jones, Dale E., et al. 2002. Congregations and Membership in the United States 2000. Nashville, TN: Glenmary Research Center.
Food Environment Statistics:
| Lancaster County: | 1.90 / 10,000 pop. |
| State: | 1.99 / 10,000 pop. |
| Here: | 0.14 / 10,000 pop. |
| South Carolina: | 0.15 / 10,000 pop. |
| This county: | 2.45 / 10,000 pop. |
| South Carolina: | 0.85 / 10,000 pop. |
| Lancaster County: | 4.90 / 10,000 pop. |
| South Carolina: | 5.38 / 10,000 pop. |
| This county: | 4.76 / 10,000 pop. |
| State: | 7.75 / 10,000 pop. |
| Lancaster County: | 13.0% |
| South Carolina: | 10.6% |
| Lancaster County: | 32.1% |
| State: | 29.4% |
| Here: | 9.8% |
| State: | 13.4% |
Agriculture in Lancaster County:
Average size of farms: 128 acresAverage value of agricultural products sold per farm: $71,759
Average value of crops sold per acre for harvested cropland: $114.37
The value of livestock, poultry, and their products as a percentage of the total market value of agricultural products sold: 96.37%
Average total farm production expenses per farm: $44,353
Harvested cropland as a percentage of land in farms: 17.82%
Average market value of all machinery and equipment per farm: $26,090
The percentage of farms operated by a family or individual: 94.82%
Average age of principal farm operators: 58 years
Average number of cattle and calves per 100 acres of all land in farms: 15.37
Milk cows as a percentage of all cattle and calves: 1.03%
Corn for grain: 299 harvested acres
All wheat for grain: 676 harvested acres
Soybeans for beans: 462 harvested acres
Vegetables: 42 harvested acres
Land in orchards: 37 acres
Earthquake activity:
Lancaster County-area historical earthquake activity is significantly above South Carolina state average. It is 26% smaller than the overall U.S. average.On 8/9/2020 at 12:07:37, a magnitude 5.1 (5.1 MW, Depth: 4.7 mi, Class: Moderate, Intensity: VI - VII) earthquake occurred 125.0 miles away from Lancaster County center
On 8/23/2011 at 17:51:04, a magnitude 5.8 (5.8 MW, Depth: 3.7 mi) earthquake occurred 270.8 miles away from the county center
On 8/2/1974 at 08:52:09, a magnitude 4.9 (4.3 MB, 4.9 LG, Class: Light, Intensity: IV - V) earthquake occurred 116.4 miles away from the county center
On 11/22/1974 at 05:25:55, a magnitude 4.7 (4.7 MB) earthquake occurred 128.4 miles away from the county center
On 8/21/1992 at 16:31:55, a magnitude 4.4 (4.1 MB, 4.1 LG, 4.4 LG, Depth: 6.2 mi) earthquake occurred 118.8 miles away from Lancaster County center
On 4/13/1998 at 09:56:11, a magnitude 3.9 (3.5 MB, 3.9 LG, Depth: 3.1 mi, Class: Light, Intensity: II - III) earthquake occurred 15.2 miles away from the county center
Magnitude types: regional Lg-wave magnitude (LG), body-wave magnitude (MB), moment magnitude (MW)
Most recent natural disasters:
- South Carolina Covid-19 Pandemic, Incident Period: January 20, 2020, FEMA Id: 4492, Natural disaster type: Other
- South Carolina Hurricane Florence, Incident Period: September 8, 2018 - October 8, 2018, FEMA Id: 4394, Natural disaster type: Hurricane
- South Carolina Hurricane Irma, Incident Period: September 6, 2017 - September 13, 2017, FEMA Id: 4346, Natural disaster type: Hurricane
- South Carolina Hurricane Matthew, Incident Period: October 04, 2016 to October 30, 2016, Emergency Declared EM-3378: October 06, 2016, FEMA Id: 3378, Natural disaster type: Hurricane
- South Carolina Severe Storms and Flooding, Incident Period: October 01, 2015 to October 23, 2015, Emergency Declared EM-3373: October 03, 2015, FEMA Id: 3373, Natural disaster type: Storm, Flood
- South Carolina Severe Storms and Flooding, Incident Period: October 01, 2015 to October 23, 2015, Major Disaster (Presidential) Declared DR-4241: October 05, 2015, FEMA Id: 4241, Natural disaster type: Storm, Flood
- South Carolina Severe Winter Storm, Incident Period: February 10, 2014 to February 19, 2014, Emergency Declared EM-3369: February 12, 2014, FEMA Id: 3369, Natural disaster type: Winter Storm
- South Carolina Hurricane Katrina Evacuation, Incident Period: August 29, 2005 to October 01, 2005, Emergency Declared EM-3233: September 10, 2005, FEMA Id: 3233, Natural disaster type: Hurricane
- South Carolina Tropical Storm Frances, Incident Period: September 06, 2004 to October 11, 2004, Major Disaster (Presidential) Declared DR-1566: October 07, 2004, FEMA Id: 1566, Natural disaster type: Tropical Storm
- South Carolina Winter Storms, Incident Period: January 22, 2000 to February 01, 2000, Major Disaster (Presidential) Declared DR-1313: January 31, 2000, FEMA Id: 1313, Natural disaster type: Winter Storm
- 3 other natural disasters have been reported since 1953.
The number of natural disasters in Lancaster County (13) is near the US average (15).
Major Disasters (Presidential) Declared: 5
Emergencies Declared: 5
Causes of natural disasters: Hurricanes: 5, Floods: 3, Storms: 3, Winter Storms: 2, Drought: 1, Tropical Storm: 1, Other: 1 (Note: some incidents may be assigned to more than one category).
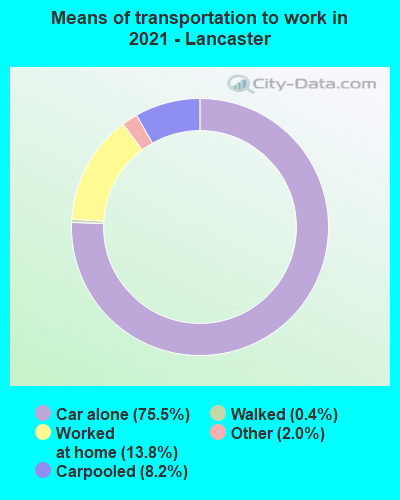
Means of transportation to work:
- Drove a car alone: 25,435 (70.2%)
- Carpooled: 3,096 (8.5%)
- Bus: 7 (0.0%)
- Ferryboat: 4 (0.0%)
- Taxicab, motorcycle, or other means: 952 (2.6%)
- Bicycle: 14 (0.0%)
- Walked: 180 (0.5%)
- Worked at home: 7,581 (20.9%)
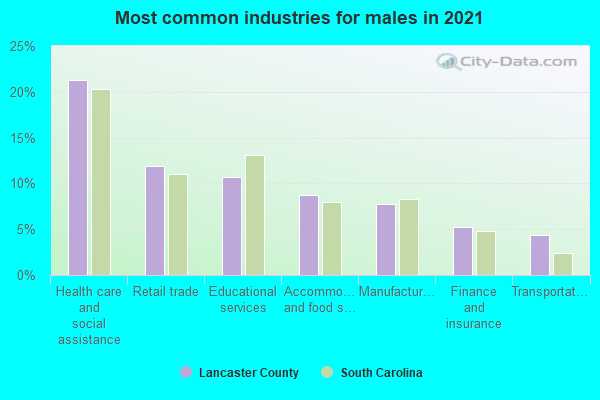
- Health care and social assistance (16%)
- Retail trade (14%)
- Educational services (14%)
- Finance and insurance (11%)
- Professional, scientific, and technical services (7%)
- Manufacturing (7%)
- Accommodation and food services (4%)

- Health care and social assistance (17%)
- Retail trade (15%)
- Educational services (15%)
- Finance and insurance (12%)
- Professional, scientific, and technical services (8%)
- Manufacturing (7%)
- Accommodation and food services (5%)
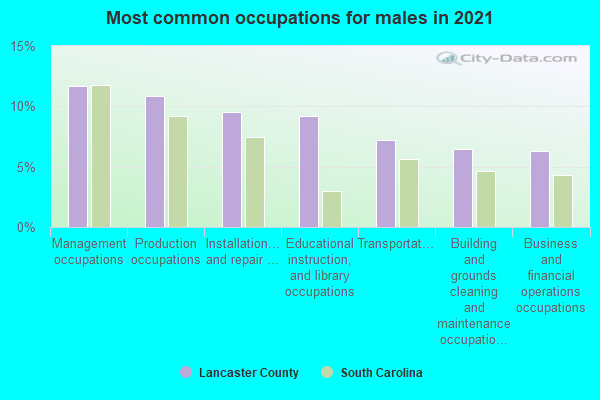
- Production occupations (14%)
- Management occupations (12%)
- Sales and related occupations (10%)
- Construction and extraction occupations (9%)
- Installation, maintenance, and repair occupations (9%)
- Computer and mathematical occupations (5%)
- Building and grounds cleaning and maintenance occupations (5%)
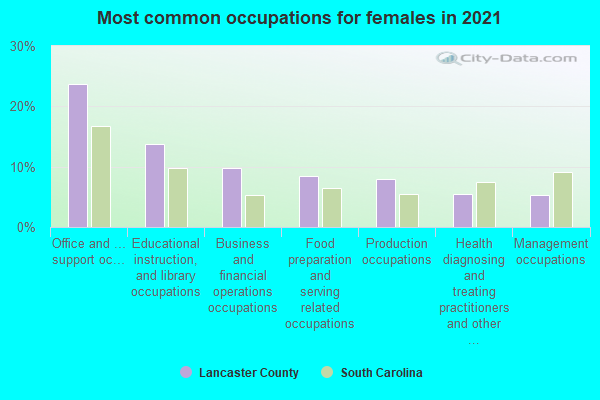
- Office and administrative support occupations (24%)
- Management occupations (13%)
- Sales and related occupations (10%)
- Educational instruction, and library occupations (9%)
- Business and financial operations occupations (6%)
- Production occupations (5%)
- Material moving occupations (4%)
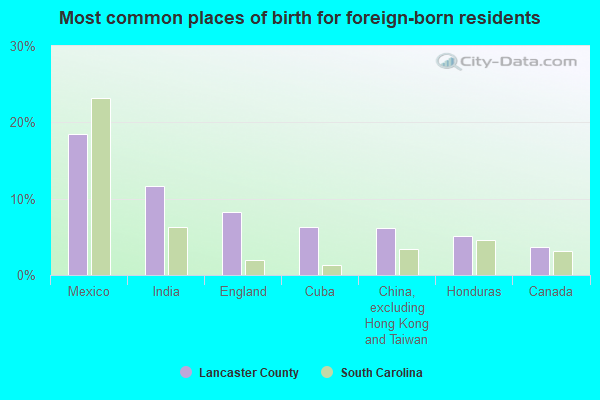
- India (21%)
- Mexico (20%)
- Cuba (7%)
- Colombia (5%)
- China, excluding Hong Kong and Taiwan (4%)
- Canada (4%)
- Germany (4%)
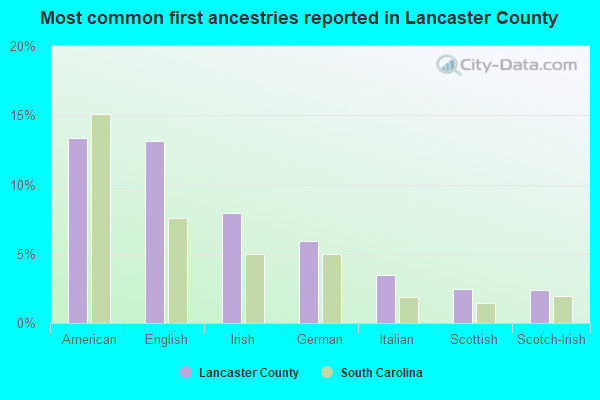
- American (15%)
- English (13%)
- Irish (8%)
- German (6%)
- Italian (3%)
- Scotch-Irish (3%)
- Scottish (2%)
People in group quarters in Lancaster County, South Carolina in 2010:
- 1,548 people in state prisons
- 307 people in nursing facilities/skilled-nursing facilities
- 136 people in local jails and other municipal confinement facilities
- 51 people in group homes intended for adults
- 42 people in other noninstitutional facilities
- 22 people in group homes for juveniles (non-correctional)
- 4 people in emergency and transitional shelters (with sleeping facilities) for people experiencing homelessness
- 4 people in residential treatment centers for adults
People in group quarters in Lancaster County, South Carolina in 2000:
- 1,389 people in state prisons
- 264 people in nursing homes
- 111 people in local jails and other confinement facilities (including police lockups)
- 96 people in other noninstitutional group quarters
- 47 people in homes for the mentally retarded
- 26 people in other group homes
- 22 people in homes for the mentally ill
- 19 people in orthopedic wards and institutions for the physically handicapped
- 10 people in college dormitories (includes college quarters off campus)
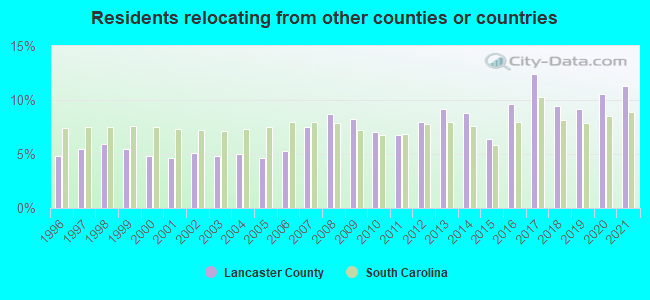
11.29% of this county's 2021 resident taxpayers lived in other counties in 2020 ($91,165 average adjusted gross income)
| Here: | 11.29% |
| South Carolina average: | 8.89% |
10 or fewer of this county's residents moved from foreign countries.
3.15% relocated from other counties in South Carolina ($15,499 average AGI)
8.13% relocated from other states ($75,666 average AGI)
Lancaster County: 8.13% South Carolina average: 4.96%
Top counties from which taxpayers relocated into this county between 2020 and 2021:
| from Mecklenburg County, NC | |
| from York County, SC | |
| from Union County, NC | |
| from Chester County, SC | |
| from Kershaw County, SC | |
| from Nassau County, NY | |
| from Cabarrus County, NC |
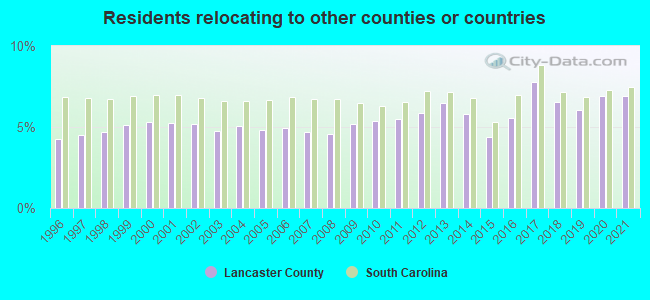
6.91% of this county's 2020 resident taxpayers moved to other counties in 2021 ($71,882 average adjusted gross income)
| Here: | 6.91% |
| South Carolina average: | 7.46% |
10 or fewer of this county's residents moved to foreign countries.
2.94% relocated to other counties in South Carolina ($25,162 average AGI)
3.96% relocated to other states ($46,721 average AGI)
Lancaster County: 3.96% South Carolina average: 3.47%
Top counties to which taxpayers relocated from this county between 2020 and 2021:
| to York County, SC | |
| to Mecklenburg County, NC | |
| to Union County, NC | |
| to Kershaw County, SC | |
| to Chester County, SC | |
| to Richland County, SC | |
| to Horry County, SC |
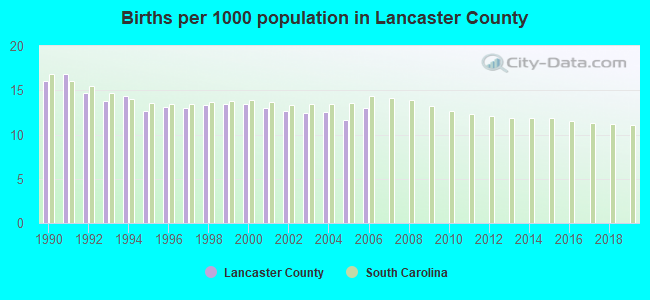
Births per 1000 population from 1990 to 1999: 14.1
Births per 1000 population from 2000 to 2006: 12.7
Deaths per 1000 population from 1990 to 1999: 9.4
Deaths per 1000 population from 2000 to 2009: 9.1
Deaths per 1000 population from 2010 to 2020: 10.0

Infant deaths per 1000 live births from 1990 to 1999: 11.3
Infant deaths per 1000 live births from 2000 to 2006: 9.6

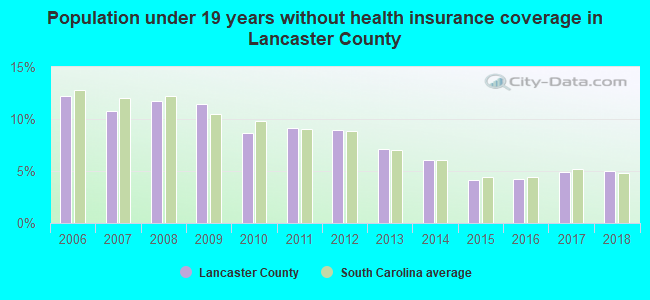
Persons under 19 years old without health insurance coverage in 2018: 5.0%
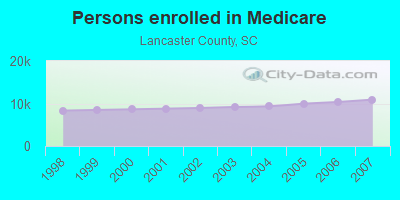
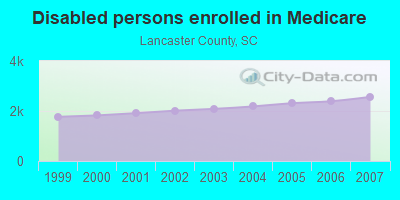
Persons enrolled in hospital insurance and/or supplemental medical insurance (Medicare) in July 1, 2007: 10,914 (8,349 aged, 2,565 disabled)
Children under 18 without health insurance coverage in 2007: 1,886 (10%)

Most common underlying causes of death in Lancaster County, South Carolina in 1999 - 2019:
- Acute myocardial infarction, unspecified (1,181)
- Bronchus or lung, unspecified - Malignant neoplasms (1,036)
- Atherosclerotic heart disease (768)
- Chronic obstructive pulmonary disease, unspecified (627)
- Congestive heart failure (476)
- Alzheimer disease, unspecified (463)
- Stroke, not specified as haemorrhage or infarction (395)
- Unspecified dementia (340)
- Cardiac arrest, unspecified (272)
- Septicaemia, unspecified (263)
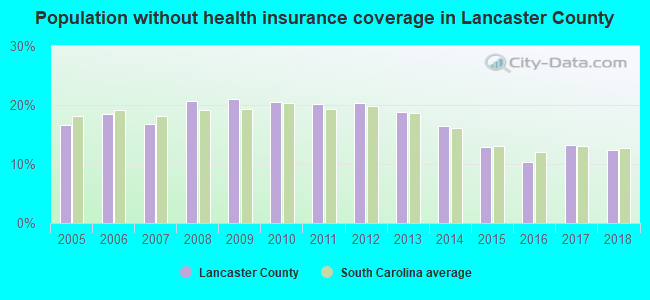
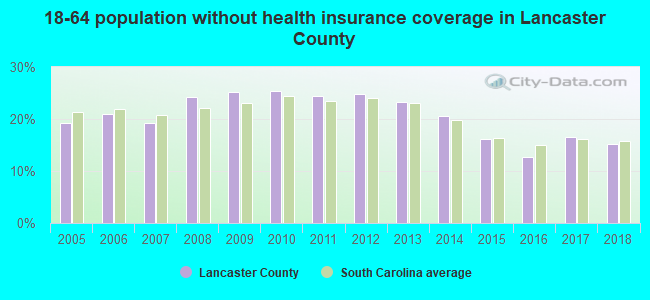
Population without health insurance coverage in 2000: 14%
Children under 18 without health insurance coverage in 2000: 11%
Short term general hospital admissions per 100,000 population in 2004: 12,592
Short term general hospital beds per 100,000 population in 2004: 307
Emergency room visits per 100,000 population in 2004: 40,995
General practice office based MDs per 100,000 population in 2005: 1,310
Medical specialist MDs per 100,000 population in 2005: 857
Dentists per 100,000 population in 1998: 3
Total births per 100,000 population, July 2005 - July 2006 : 25
Total deaths per 100,000 population, July 2005 - July 2006: 52
Limited-service eating places per 100,000 population in 2005 : 3
Homicides per 1,000,000 population from 2000 to 2006: 77.3. This is less than state average.

- Firearm - 53.7
- Other - 23.6
Suicides per 1,000,000 population from 2000 to 2006: 113.9. This is less than state average.
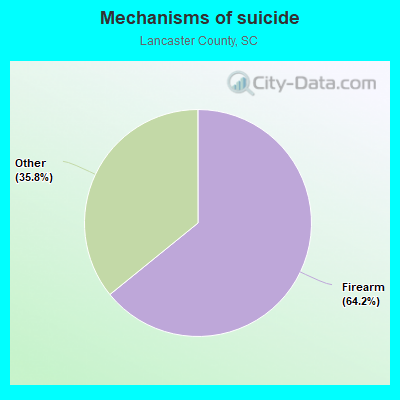
- Firearm - 73.0
- Other - 40.8
Household type by relationship:
Households: 104,577- Male householders: 20,106 (4,017 living alone), Female householders: 20,804 (6,592 living alone)
22,706 spouses (22,630 opposite-sex spouses), 1,813 unmarried partners, (1,813 opposite-sex unmarried partners), 28,390 children (26,758 natural, 549 adopted, 1,083 stepchildren), 3,287 grandchildren, 906 brothers or sisters, 1,667 parents, 0 foster children, 990 other relatives, 2,257 non-relatives
- In group quarters: 1,651
Size of family households: 15,135 2-persons, 6,455 3-persons, 4,015 4-persons, 2,175 5-persons, 1,043 6-persons, 554 7-or-more-persons.
Size of nonfamily households: 10,609 1-person, 813 2-persons, 41 3-persons, 70 4-persons.
15,017 married couples with children.
4,602 single-parent households (1,115 men, 3,487 women).
92.1% of residents of Lancaster speak English at home.
5.4% of residents speak Spanish at home (61% speak English very well, 18% speak English well, 12% speak English not well, 9% don't speak English at all).
1.8% of residents speak other Indo-European language at home (81% speak English very well, 7% speak English well, 9% speak English not well, 2% don't speak English at all).
0.8% of residents speak Asian or Pacific Island language at home (78% speak English very well, 19% speak English well, 4% speak English not well).
0.1% of residents speak other language at home (100% speak English very well).
In fiscal year 2004:
Federal Government expenditure: $298,643,000 ($4,730 per capita)
Department of Defense expenditure: $19,503,000
Federal direct payments to individuals for retirement and disability: $152,322,000
Federal other direct payments to individuals: $66,085,000
Federal direct payments not to individuals: $502,000
Federal grants: $62,515,000
Federal procurement contracts: $6,108,000 ($262,000 Department of Defense)
Federal salaries and wages: $11,111,000 ($4,693,000 Department of Defense)
Federal Government direct loans: $1,016,000
Federal guaranteed/insured loans: $13,728,000
Federal Government insurance: $5,345,000
Population change from April 1, 2000 to July 1, 2005:
Births: 4,189| Here: | 66 per 1000 residents |
| State: | 69 per 1000 residents |
Deaths: 3,037
| Here: | 48 per 1000 residents |
| State: | 46 per 1000 residents |
Net international migration: +350
| Here: | +6 per 1000 residents |
| State: | +9 per 1000 residents |
Net internal migration: +336
| Here: | +5 per 1000 residents |
| State: | +27 per 1000 residents |
Total withdrawal of fresh water for public supply: 11.84 millions of gallons per day (0% from ground, 100% from surface)
| Here: | 6.4 |
| State: | 6.4 |
| Here: | 3.9 |
| State: | 4.5 |
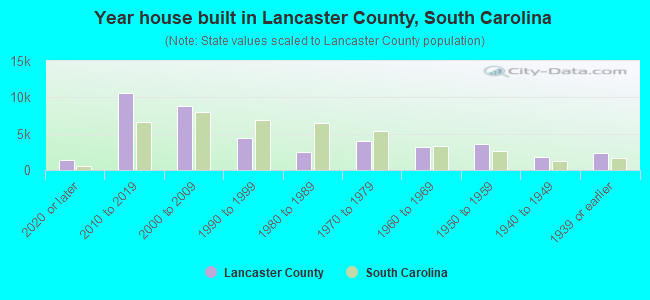
- Year house built in Lancaster County, South Carolina
- 2,4812020 or later
- 11,4132010 to 2019
- 7,9232000 to 2009
- 5,2481990 to 1999
- 3,8041980 to 1989
- 4,2881970 to 1979
- 2,9471960 to 1969
- 2,8661950 to 1959
- 1,0041940 to 1949
- 2,1961939 or earlier
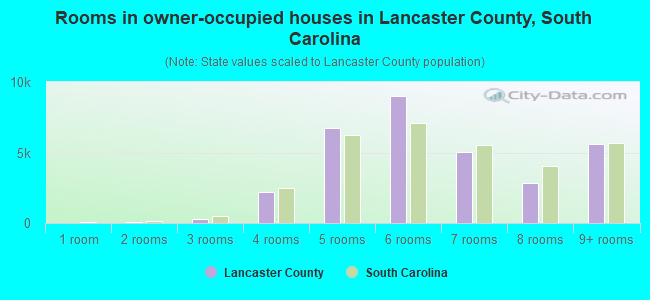
- Rooms in owner-occupied houses in Lancaster County, South Carolina
- 1911 room
- 02 rooms
- 9543 rooms
- 3,6834 rooms
- 5,5175 rooms
- 8,1376 rooms
- 5,0747 rooms
- 5,3148 rooms
- 6,5369+ rooms
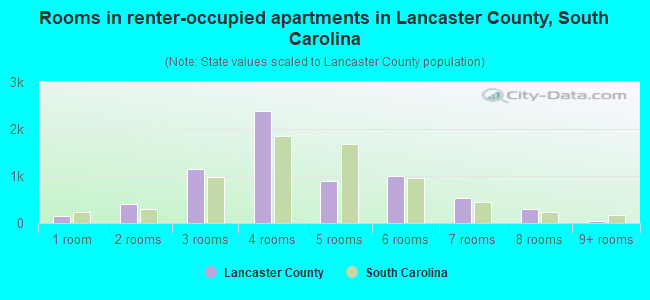
- Rooms in renter-occupied apartments in Lancaster County, South Carolina
- 1741 room
- 4072 rooms
- 1,7013 rooms
- 1,2074 rooms
- 1,4035 rooms
- 3576 rooms
- 157 rooms
- 1938 rooms
- 479+ rooms
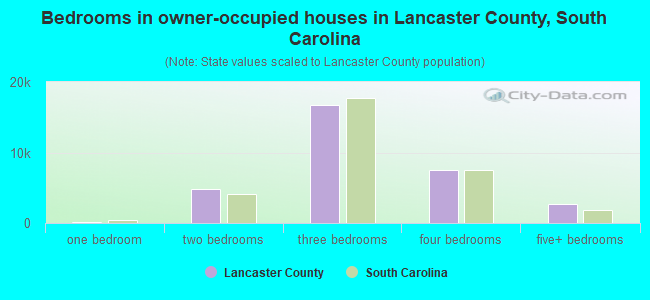
- Bedrooms in owner-occupied houses in Lancaster County, South Carolina
- 191no bedroom
- 3091 bedroom
- 5,4712 bedrooms
- 18,6193 bedrooms
- 8,2824 bedrooms
- 2,5345+ bedrooms
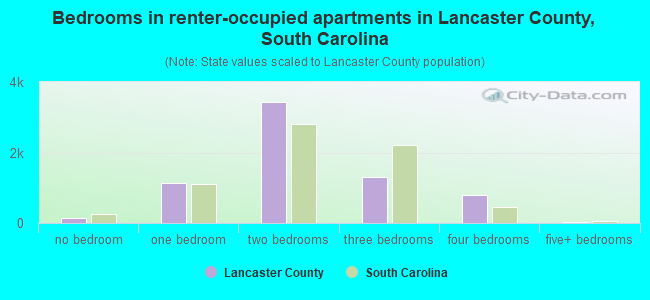
- Bedrooms in renter-occupied apartments in Lancaster County, South Carolina
- 174no bedroom
- 7751 bedroom
- 3,3142 bedrooms
- 1,2413 bedrooms
- 04 bedrooms
- 05+ bedrooms
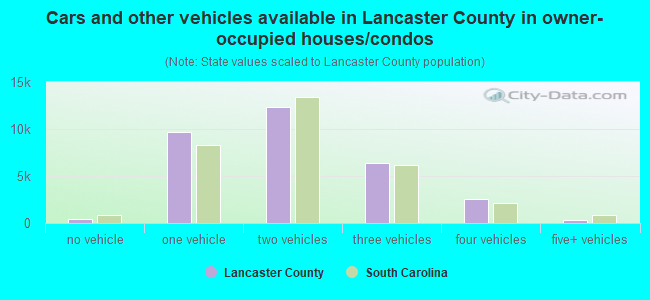
- Cars and other vehicles available in Lancaster County in owner-occupied houses/condos
- 896no vehicle
- 8,4821 vehicle
- 16,0442 vehicles
- 6,9983 vehicles
- 2,3044 vehicles
- 6825+ vehicles
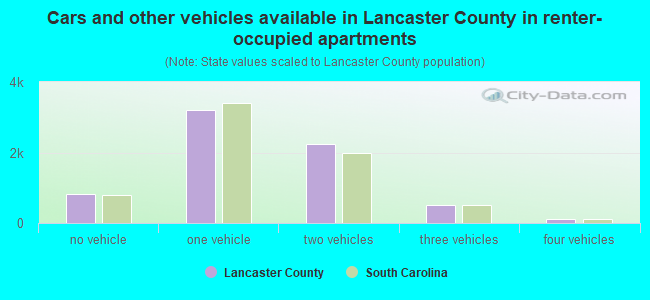
- Cars and other vehicles available in Lancaster County in renter-occupied apartments
- 1,155no vehicle
- 2,4281 vehicle
- 1,4242 vehicles
- 2353 vehicles
- 2624 vehicles
- 05+ vehicles
88.5% of Lancaster County residents lived in the same house 1 years ago.
Out of people who lived in different houses, 21% lived in this county.
Out of people who lived in different counties, 36% lived in South Carolina.
| Lancaster County: | 88.5% |
| State average: | 86.5% |
Place of birth for U.S.-born residents:
- This state: 36,903
- Other state: 57,924
- Northeast: 15,820
- Midwest: 8,389
- South: 29,404
- West: 4,311

- 57.8%Utility gas
- 37.9%Electricity
- 3.2%Bottled, tank, or LP gas
- 0.7%Wood
- 0.2%Fuel oil, kerosene, etc.
- 0.1%Solar energy
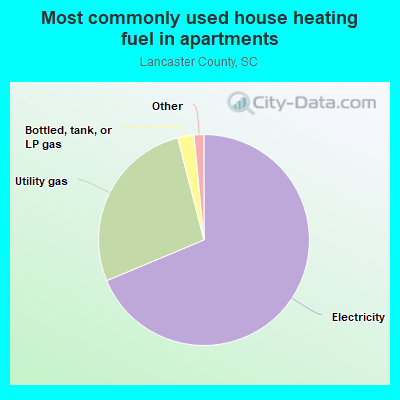
- 70.4%Electricity
- 24.9%Utility gas
- 2.6%Bottled, tank, or LP gas
- 1.6%Fuel oil, kerosene, etc.
- 0.3%No fuel used
- 0.2%Other fuel
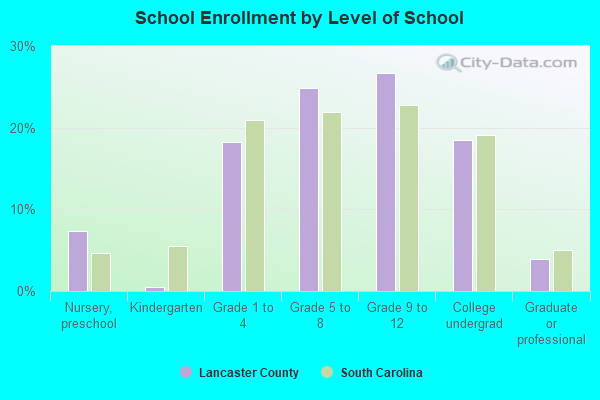
Private vs. public school enrollment:
| Here: | 8.4% |
| South Carolina: | 14.4% |
| Here: | 8.5% |
| South Carolina: | 11.1% |
| Here: | 8.5% |
| South Carolina: | 21.9% |

Lancaster County government finances - Expenditure in 2020:
- Bond Funds - Cash and Securities: $13,008,000
- Charges - Other: $13,895,000
Other: $12,399,000
Parks and Recreation: $1,101,000
Parks and Recreation: $818,000
Air Transportation: $200,000
Air Transportation: $164,000
Solid Waste Management: $102,000
Solid Waste Management: $96,000
Regular Highways: $3,000
Regular Highways: $1,000
- Construction - Health - Other: $4,814,000
Central Staff Services: $738,000
Central Staff Services: $639,000
Police Protection: $364,000
Parks and Recreation: $348,000
General Public Buildings: $149,000
Health - Other: $63,000
Libraries: $20,000
General - Other: $7,000
- Current Operations - Police Protection: $16,890,000
Police Protection: $14,344,000
Central Staff Services: $9,642,000
Central Staff Services: $9,333,000
Health - Other: $7,634,000
Regular Highways: $6,899,000
Regular Highways: $6,806,000
General Public Buildings: $5,178,000
Local Fire Protection: $4,908,000
Health - Other: $3,934,000
Parks and Recreation: $3,836,000
Local Fire Protection: $3,804,000
Solid Waste Management: $2,739,000
General Public Buildings: $2,663,000
Financial Administration: $2,625,000
Correctional Institutions: $2,604,000
Solid Waste Management: $2,567,000
Parks and Recreation: $2,511,000
Financial Administration: $2,422,000
Judicial and Legal Services: $2,313,000
Correctional Institutions: $2,261,000
Judicial and Legal Services: $2,113,000
General - Other: $2,021,000
Protective Inspection and Regulation - Other: $1,448,000
Libraries: $1,209,000
Libraries: $1,184,000
Protective Inspection and Regulation - Other: $1,123,000
General - Other: $1,094,000
Air Transportation: $253,000
Air Transportation: $244,000
- Federal Intergovernmental - Other: $2,021,000
Air Transportation: $1,456,000
Other: $1,259,000
Air Transportation: $16,000
- General - Interest on Debt: $2,777,000
Interest on Debt: $2,131,000
- Local Intergovernmental - Other: $1,305,000
Other: $1,269,000
General Local Government Support: $214,000
- Long Term Debt - Beginning Outstanding - Unspecified Public Purpose: $48,832,000
Beginning Outstanding - Unspecified Public Purpose: $41,744,000
Outstanding Unspecified Public Purpose: $40,234,000
Outstanding Unspecified Public Purpose: $36,154,000
Retired Unspecified Public Purpose: $8,598,000
Retired Unspecified Public Purpose: $5,589,000
- Miscellaneous - Interest Earnings: $1,343,000
Fines and Forfeits: $1,139,000
Fines and Forfeits: $817,000
General Revenue - Other: $658,000
Interest Earnings: $553,000
General Revenue - Other: $459,000
Donations From Private Sources: $450,000
Donations From Private Sources: $259,000
Sale of Property: $155,000
Rents: $34,000
Rents: $23,000
- Other Capital Outlay - Local Fire Protection: $2,880,000
Libraries: $2,516,000
Health - Other: $1,222,000
Police Protection: $998,000
Central Staff Services: $788,000
Health - Other: $699,000
Central Staff Services: $697,000
Regular Highways: $693,000
Regular Highways: $512,000
General Public Building: $473,000
Solid Waste Management: $215,000
Solid Waste Management: $208,000
Correctional Institutions: $204,000
Police Protection: $135,000
Local Fire Protection: $108,000
General Public Building: $101,000
Parks and Recreation: $46,000
Judicial and Legal Services: $39,000
Parks and Recreation: $10,000
Correctional Institutions: $3,000
- Other Funds - Cash and Securities: $81,471,000
Cash and Securities: $59,413,000
- Sinking Funds - Cash and Securities: $2,313,000
Cash and Securities: $839,000
- State Intergovernmental - General Local Government Support: $3,800,000
General Local Government Support: $3,608,000
Highways: $1,747,000
Other: $1,692,000
Highways: $1,625,000
Other: $1,142,000
Public Welfare: $47,000
Public Welfare: $39,000
Health and Hospitals: $10,000
Health and Hospitals: $10,000
- Tax - Property: $41,904,000
Property: $32,201,000
General Sales and Gross Receipts: $19,818,000
General Sales and Gross Receipts: $15,231,000
Other Selective Sales: $4,935,000
Other: $3,939,000
- Total Salaries and Wages: $27,619,000
: $24,331,000
Lancaster County government finances - Revenue in 2020:
- Bond Funds - Cash and Securities: $13,008,000
- Charges - Other: $13,895,000
Other: $12,399,000
Parks and Recreation: $1,101,000
Parks and Recreation: $818,000
Air Transportation: $200,000
Air Transportation: $164,000
Solid Waste Management: $102,000
Solid Waste Management: $96,000
Regular Highways: $3,000
Regular Highways: $1,000
- Construction - Health - Other: $4,814,000
Central Staff Services: $738,000
Central Staff Services: $639,000
Police Protection: $364,000
Parks and Recreation: $348,000
General Public Buildings: $149,000
Health - Other: $63,000
Libraries: $20,000
General - Other: $7,000
- Current Operations - Police Protection: $16,890,000
Police Protection: $14,344,000
Central Staff Services: $9,642,000
Central Staff Services: $9,333,000
Health - Other: $7,634,000
Regular Highways: $6,899,000
Regular Highways: $6,806,000
General Public Buildings: $5,178,000
Local Fire Protection: $4,908,000
Health - Other: $3,934,000
Parks and Recreation: $3,836,000
Local Fire Protection: $3,804,000
Solid Waste Management: $2,739,000
General Public Buildings: $2,663,000
Financial Administration: $2,625,000
Correctional Institutions: $2,604,000
Solid Waste Management: $2,567,000
Parks and Recreation: $2,511,000
Financial Administration: $2,422,000
Judicial and Legal Services: $2,313,000
Correctional Institutions: $2,261,000
Judicial and Legal Services: $2,113,000
General - Other: $2,021,000
Protective Inspection and Regulation - Other: $1,448,000
Libraries: $1,209,000
Libraries: $1,184,000
Protective Inspection and Regulation - Other: $1,123,000
General - Other: $1,094,000
Air Transportation: $253,000
Air Transportation: $244,000
- Federal Intergovernmental - Other: $2,021,000
Air Transportation: $1,456,000
Other: $1,259,000
Air Transportation: $16,000
- General - Interest on Debt: $2,777,000
Interest on Debt: $2,131,000
- Local Intergovernmental - Other: $1,305,000
Other: $1,269,000
General Local Government Support: $214,000
- Long Term Debt - Beginning Outstanding - Unspecified Public Purpose: $48,832,000
Beginning Outstanding - Unspecified Public Purpose: $41,744,000
Outstanding Unspecified Public Purpose: $40,234,000
Outstanding Unspecified Public Purpose: $36,154,000
Retired Unspecified Public Purpose: $8,598,000
Retired Unspecified Public Purpose: $5,589,000
- Miscellaneous - Interest Earnings: $1,343,000
Fines and Forfeits: $1,139,000
Fines and Forfeits: $817,000
General Revenue - Other: $658,000
Interest Earnings: $553,000
General Revenue - Other: $459,000
Donations From Private Sources: $450,000
Donations From Private Sources: $259,000
Sale of Property: $155,000
Rents: $34,000
Rents: $23,000
- Other Capital Outlay - Local Fire Protection: $2,880,000
Libraries: $2,516,000
Health - Other: $1,222,000
Police Protection: $998,000
Central Staff Services: $788,000
Health - Other: $699,000
Central Staff Services: $697,000
Regular Highways: $693,000
Regular Highways: $512,000
General Public Building: $473,000
Solid Waste Management: $215,000
Solid Waste Management: $208,000
Correctional Institutions: $204,000
Police Protection: $135,000
Local Fire Protection: $108,000
General Public Building: $101,000
Parks and Recreation: $46,000
Judicial and Legal Services: $39,000
Parks and Recreation: $10,000
Correctional Institutions: $3,000
- Other Funds - Cash and Securities: $81,471,000
Cash and Securities: $59,413,000
- Sinking Funds - Cash and Securities: $2,313,000
Cash and Securities: $839,000
- State Intergovernmental - General Local Government Support: $3,800,000
General Local Government Support: $3,608,000
Highways: $1,747,000
Other: $1,692,000
Highways: $1,625,000
Other: $1,142,000
Public Welfare: $47,000
Public Welfare: $39,000
Health and Hospitals: $10,000
Health and Hospitals: $10,000
- Tax - Property: $41,904,000
Property: $32,201,000
General Sales and Gross Receipts: $19,818,000
General Sales and Gross Receipts: $15,231,000
Other Selective Sales: $4,935,000
Other: $3,939,000
- Total Salaries and Wages: $27,619,000
: $24,331,000
Lancaster County government finances - Debt in 2020:
- Bond Funds - Cash and Securities: $13,008,000
- Charges - Other: $13,895,000
Other: $12,399,000
Parks and Recreation: $1,101,000
Parks and Recreation: $818,000
Air Transportation: $200,000
Air Transportation: $164,000
Solid Waste Management: $102,000
Solid Waste Management: $96,000
Regular Highways: $3,000
Regular Highways: $1,000
- Construction - Health - Other: $4,814,000
Central Staff Services: $738,000
Central Staff Services: $639,000
Police Protection: $364,000
Parks and Recreation: $348,000
General Public Buildings: $149,000
Health - Other: $63,000
Libraries: $20,000
General - Other: $7,000
- Current Operations - Police Protection: $16,890,000
Police Protection: $14,344,000
Central Staff Services: $9,642,000
Central Staff Services: $9,333,000
Health - Other: $7,634,000
Regular Highways: $6,899,000
Regular Highways: $6,806,000
General Public Buildings: $5,178,000
Local Fire Protection: $4,908,000
Health - Other: $3,934,000
Parks and Recreation: $3,836,000
Local Fire Protection: $3,804,000
Solid Waste Management: $2,739,000
General Public Buildings: $2,663,000
Financial Administration: $2,625,000
Correctional Institutions: $2,604,000
Solid Waste Management: $2,567,000
Parks and Recreation: $2,511,000
Financial Administration: $2,422,000
Judicial and Legal Services: $2,313,000
Correctional Institutions: $2,261,000
Judicial and Legal Services: $2,113,000
General - Other: $2,021,000
Protective Inspection and Regulation - Other: $1,448,000
Libraries: $1,209,000
Libraries: $1,184,000
Protective Inspection and Regulation - Other: $1,123,000
General - Other: $1,094,000
Air Transportation: $253,000
Air Transportation: $244,000
- Federal Intergovernmental - Other: $2,021,000
Air Transportation: $1,456,000
Other: $1,259,000
Air Transportation: $16,000
- General - Interest on Debt: $2,777,000
Interest on Debt: $2,131,000
- Local Intergovernmental - Other: $1,305,000
Other: $1,269,000
General Local Government Support: $214,000
- Long Term Debt - Beginning Outstanding - Unspecified Public Purpose: $48,832,000
Beginning Outstanding - Unspecified Public Purpose: $41,744,000
Outstanding Unspecified Public Purpose: $40,234,000
Outstanding Unspecified Public Purpose: $36,154,000
Retired Unspecified Public Purpose: $8,598,000
Retired Unspecified Public Purpose: $5,589,000
- Miscellaneous - Interest Earnings: $1,343,000
Fines and Forfeits: $1,139,000
Fines and Forfeits: $817,000
General Revenue - Other: $658,000
Interest Earnings: $553,000
General Revenue - Other: $459,000
Donations From Private Sources: $450,000
Donations From Private Sources: $259,000
Sale of Property: $155,000
Rents: $34,000
Rents: $23,000
- Other Capital Outlay - Local Fire Protection: $2,880,000
Libraries: $2,516,000
Health - Other: $1,222,000
Police Protection: $998,000
Central Staff Services: $788,000
Health - Other: $699,000
Central Staff Services: $697,000
Regular Highways: $693,000
Regular Highways: $512,000
General Public Building: $473,000
Solid Waste Management: $215,000
Solid Waste Management: $208,000
Correctional Institutions: $204,000
Police Protection: $135,000
Local Fire Protection: $108,000
General Public Building: $101,000
Parks and Recreation: $46,000
Judicial and Legal Services: $39,000
Parks and Recreation: $10,000
Correctional Institutions: $3,000
- Other Funds - Cash and Securities: $81,471,000
Cash and Securities: $59,413,000
- Sinking Funds - Cash and Securities: $2,313,000
Cash and Securities: $839,000
- State Intergovernmental - General Local Government Support: $3,800,000
General Local Government Support: $3,608,000
Highways: $1,747,000
Other: $1,692,000
Highways: $1,625,000
Other: $1,142,000
Public Welfare: $47,000
Public Welfare: $39,000
Health and Hospitals: $10,000
Health and Hospitals: $10,000
- Tax - Property: $41,904,000
Property: $32,201,000
General Sales and Gross Receipts: $19,818,000
General Sales and Gross Receipts: $15,231,000
Other Selective Sales: $4,935,000
Other: $3,939,000
- Total Salaries and Wages: $27,619,000
: $24,331,000
Lancaster County government finances - Cash and Securities in 2020:
- Bond Funds - Cash and Securities: $13,008,000
- Charges - Other: $13,895,000
Other: $12,399,000
Parks and Recreation: $1,101,000
Parks and Recreation: $818,000
Air Transportation: $200,000
Air Transportation: $164,000
Solid Waste Management: $102,000
Solid Waste Management: $96,000
Regular Highways: $3,000
Regular Highways: $1,000
- Construction - Health - Other: $4,814,000
Central Staff Services: $738,000
Central Staff Services: $639,000
Police Protection: $364,000
Parks and Recreation: $348,000
General Public Buildings: $149,000
Health - Other: $63,000
Libraries: $20,000
General - Other: $7,000
- Current Operations - Police Protection: $16,890,000
Police Protection: $14,344,000
Central Staff Services: $9,642,000
Central Staff Services: $9,333,000
Health - Other: $7,634,000
Regular Highways: $6,899,000
Regular Highways: $6,806,000
General Public Buildings: $5,178,000
Local Fire Protection: $4,908,000
Health - Other: $3,934,000
Parks and Recreation: $3,836,000
Local Fire Protection: $3,804,000
Solid Waste Management: $2,739,000
General Public Buildings: $2,663,000
Financial Administration: $2,625,000
Correctional Institutions: $2,604,000
Solid Waste Management: $2,567,000
Parks and Recreation: $2,511,000
Financial Administration: $2,422,000
Judicial and Legal Services: $2,313,000
Correctional Institutions: $2,261,000
Judicial and Legal Services: $2,113,000
General - Other: $2,021,000
Protective Inspection and Regulation - Other: $1,448,000
Libraries: $1,209,000
Libraries: $1,184,000
Protective Inspection and Regulation - Other: $1,123,000
General - Other: $1,094,000
Air Transportation: $253,000
Air Transportation: $244,000
- Federal Intergovernmental - Other: $2,021,000
Air Transportation: $1,456,000
Other: $1,259,000
Air Transportation: $16,000
- General - Interest on Debt: $2,777,000
Interest on Debt: $2,131,000
- Local Intergovernmental - Other: $1,305,000
Other: $1,269,000
General Local Government Support: $214,000
- Long Term Debt - Beginning Outstanding - Unspecified Public Purpose: $48,832,000
Beginning Outstanding - Unspecified Public Purpose: $41,744,000
Outstanding Unspecified Public Purpose: $40,234,000
Outstanding Unspecified Public Purpose: $36,154,000
Retired Unspecified Public Purpose: $8,598,000
Retired Unspecified Public Purpose: $5,589,000
- Miscellaneous - Interest Earnings: $1,343,000
Fines and Forfeits: $1,139,000
Fines and Forfeits: $817,000
General Revenue - Other: $658,000
Interest Earnings: $553,000
General Revenue - Other: $459,000
Donations From Private Sources: $450,000
Donations From Private Sources: $259,000
Sale of Property: $155,000
Rents: $34,000
Rents: $23,000
- Other Capital Outlay - Local Fire Protection: $2,880,000
Libraries: $2,516,000
Health - Other: $1,222,000
Police Protection: $998,000
Central Staff Services: $788,000
Health - Other: $699,000
Central Staff Services: $697,000
Regular Highways: $693,000
Regular Highways: $512,000
General Public Building: $473,000
Solid Waste Management: $215,000
Solid Waste Management: $208,000
Correctional Institutions: $204,000
Police Protection: $135,000
Local Fire Protection: $108,000
General Public Building: $101,000
Parks and Recreation: $46,000
Judicial and Legal Services: $39,000
Parks and Recreation: $10,000
Correctional Institutions: $3,000
- Other Funds - Cash and Securities: $81,471,000
Cash and Securities: $59,413,000
- Sinking Funds - Cash and Securities: $2,313,000
Cash and Securities: $839,000
- State Intergovernmental - General Local Government Support: $3,800,000
General Local Government Support: $3,608,000
Highways: $1,747,000
Other: $1,692,000
Highways: $1,625,000
Other: $1,142,000
Public Welfare: $47,000
Public Welfare: $39,000
Health and Hospitals: $10,000
Health and Hospitals: $10,000
- Tax - Property: $41,904,000
Property: $32,201,000
General Sales and Gross Receipts: $19,818,000
General Sales and Gross Receipts: $15,231,000
Other Selective Sales: $4,935,000
Other: $3,939,000
- Total Salaries and Wages: $27,619,000
: $24,331,000
Supplemental Security Income (SSI) in 2006:
- Total number of recipients: 1,350
- Number of aged recipients: 124
- Number of blind and disabled recipients: 1,226
- Number of recipients under 18: 280
- Number of recipients between 18 and 64: 808
- Number of recipients older than 64: 262
- Number of recipients also receiving OASDI: 505
- Amount of payments (thousands of dollars): 602
| Most common first names in Lancaster County, SC among deceased individuals | ||
| Name | Count | Lived (average) |
|---|---|---|
| James | 666 | 69.9 years |
| John | 507 | 72.4 years |
| William | 503 | 71.6 years |
| Mary | 490 | 76.9 years |
| Robert | 346 | 70.8 years |
| Willie | 243 | 71.5 years |
| Annie | 191 | 80.2 years |
| George | 188 | 73.0 years |
| Thomas | 165 | 69.2 years |
| Charles | 162 | 67.4 years |
| Most common last names in Lancaster County, SC among deceased individuals | ||
| Last name | Count | Lived (average) |
|---|---|---|
| Williams | 266 | 75.2 years |
| Robinson | 224 | 73.8 years |
| Hinson | 216 | 74.3 years |
| Adams | 188 | 74.4 years |
| Blackmon | 170 | 75.0 years |
| Catoe | 164 | 74.1 years |
| Baker | 155 | 75.7 years |
| Knight | 155 | 72.8 years |
| Cauthen | 153 | 75.8 years |
| Taylor | 151 | 73.6 years |
| Businesses in Lancaster County, SC | ||||
| Name | Count | Name | Count | |
|---|---|---|---|---|
| ALDI | 1 | Kincaid | 1 | |
| Ace Hardware | 1 | Kmart | 1 | |
| Advance Auto Parts | 1 | La-Z-Boy | 1 | |
| Applebee's | 1 | Lane Furniture | 1 | |
| Arby's | 1 | Little Caesars Pizza | 1 | |
| AutoZone | 1 | MasterBrand Cabinets | 2 | |
| Blockbuster | 1 | Nike | 1 | |
| Burger King | 1 | Papa John's Pizza | 1 | |
| CVS | 2 | Pizza Hut | 1 | |
| Chevrolet | 2 | RadioShack | 1 | |
| Chick-Fil-A | 1 | Rite Aid | 2 | |
| Cricket Wireless | 1 | SONIC Drive-In | 1 | |
| Curves | 1 | Sears | 1 | |
| Dunkin Donuts | 1 | Subway | 3 | |
| FedEx | 2 | Super 8 | 1 | |
| Ford | 1 | T-Mobile | 1 | |
| GNC | 1 | Taco Bell | 1 | |
| GameStop | 1 | U-Haul | 9 | |
| H&R Block | 2 | UPS | 5 | |
| Hardee's | 1 | Verizon Wireless | 1 | |
| Home Depot | 1 | Walmart | 1 | |
| Jones New York | 2 | Wendy's | 1 | |
| KFC | 2 | |||
Lancaster County on our top lists:
- #12 on the list of "Top 101 counties with the largest number of people moving in compared to moving out (pop. 50,000+)"
- #16 on the list of "Top 101 counties with the lowest ground withdrawal of fresh water for public supply (pop. 50,000+)"
- #58 on the list of "Top 101 counties with the smallest number of people without health insurance coverage in 2000 (pop. 50,000+)"
- #99 on the list of "Top 101 counties with the smallest number of children under 18 without health insurance coverage in 2000 (pop. 50,000+)"