Lee County, South Carolina (SC)
County owner-occupied free and clear houses and condos in 2010: 2,459
County owner-occupied houses and condos in 2000: 5,462
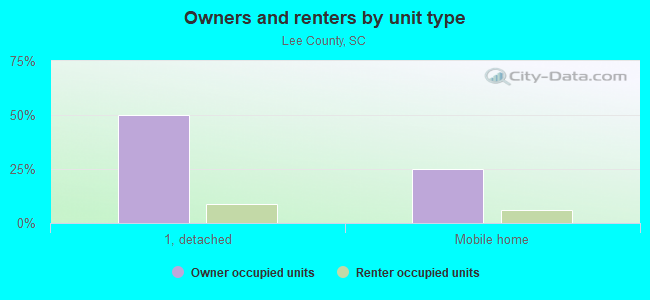
Renter-occupied apartments: 1,910 (it was 1,424 in 2000)
| % of renters here: | 21% |
| State: | 31% |
Land area: 410 sq. mi.
Water area: 1.0 sq. mi.
Population density: 41 people per square mile (average).
Industries providing employment: Educational, health and social services (19.2%), Manufacturing (17.0%), Retail trade (15.0%).
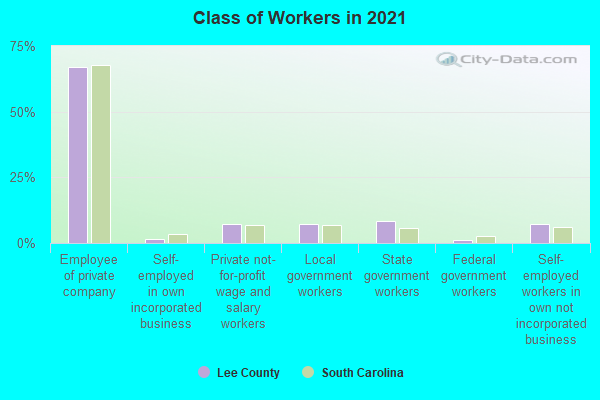
Type of workers:
- Private wage or salary: 71%
- Government: 21%
- Self-employed, not incorporated: 8%
- Unpaid family work: 0%
- OSM Map
- General Map
- Google Map
- MSN Map

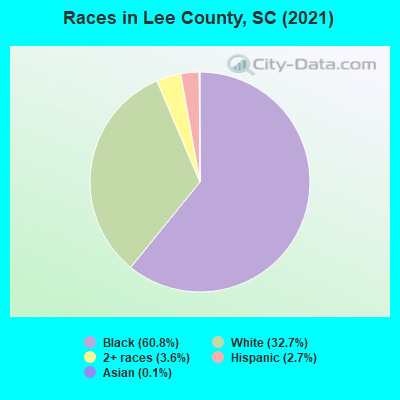
- 10,31161.5%Black Non-Hispanic Alone
- 5,54633.1%White Non-Hispanic Alone
- 4612.8%Hispanic or Latino
- 4272.5%Two or more races
- 140.08%Asian alone
- 10.01%Some other race alone
| Median resident age: | 42.0 years |
| South Carolina median age: | 40.5 years |
| Males: 8,656 | |
| Females: 8,351 |

 | South Carolina fears non-native tegu lizards could take root and wreak ecological havoc (2 replies) |
| SC Is An Abysmal Failure (35 replies) |
| South Carolina 2018 census estimate (56 replies) |
| Most Rural Locations? (19 replies) |
| LOST Female Older Dog around Lynchburg/Lee county/Shiloh Area! (3 replies) |
| is Greenville ok for non religious? (97 replies) |
| Lee County: | 2.0 people |
| South Carolina: | 2 people |
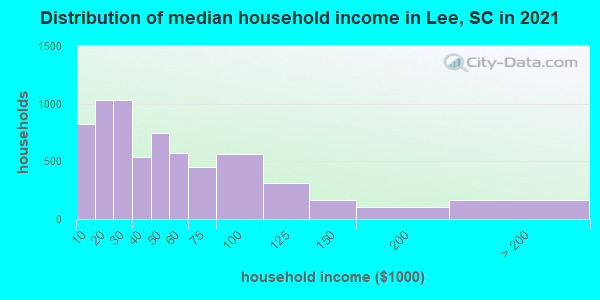
Estimated median household income in 2022: $39,401 ($26,907 in 1999)
| This county: | $39,401 |
| South Carolina: | $64,115 |
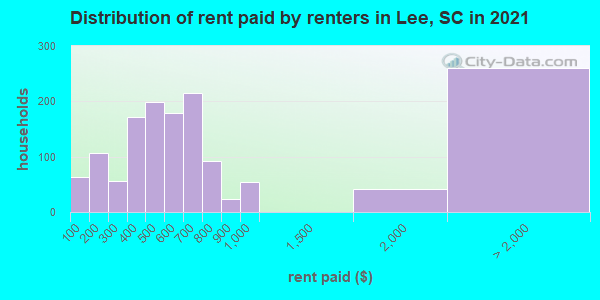
Median contract rent in 2022 for apartments: $528 (lower quartile is $384, upper quartile is $662)
| This county: | $528 |
| State: | $893 |
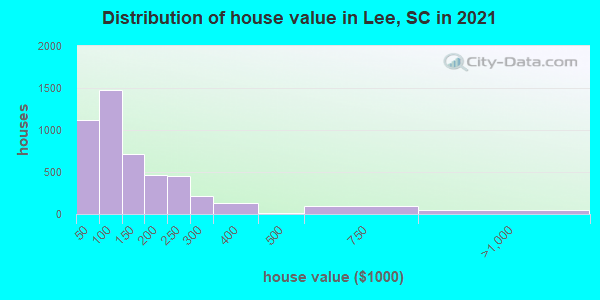
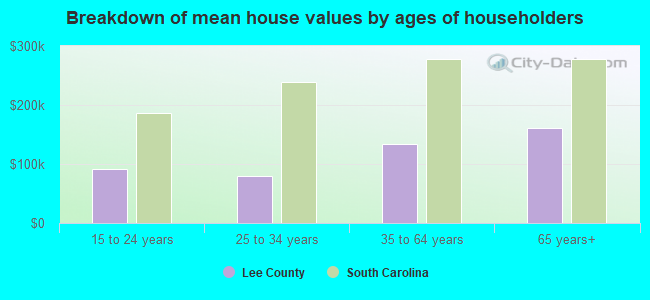
Estimated median house or condo value in 2022: $109,989 (it was $47,600 in 2000)
| Lee: | $109,989 |
| South Carolina: | $254,600 |
Median monthly housing costs for homes and condos with a mortgage: $969
Median monthly housing costs for units without a mortgage: $329
Institutionalized population: 1,920
Crime in 2021 (reported by the sheriff's office or county police, not the county total):
- Murders: 3
- Rapes: 2
- Robberies: 3
- Assaults: 38
- Burglaries: 33
- Thefts: 104
- Auto thefts: 30
Crime in 2020 (reported by the sheriff's office or county police, not the county total):
- Murders: 4
- Rapes: 0
- Robberies: 6
- Assaults: 54
- Burglaries: 89
- Thefts: 194
- Auto thefts: 52
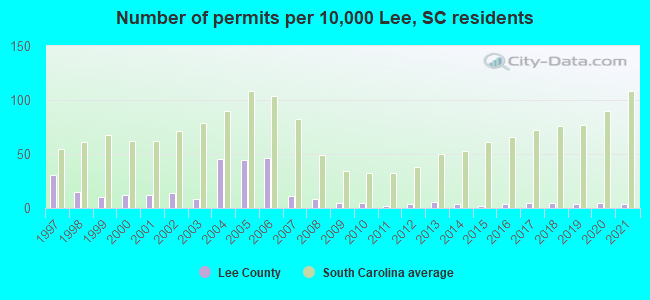
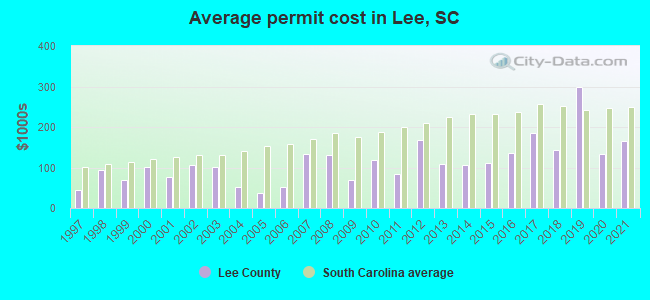
Single-family new house construction building permits:
- 2022: 17 buildings, average cost: $206,200
- 2021: 8 buildings, average cost: $165,300
- 2020: 11 buildings, average cost: $134,100
- 2019: 8 buildings, average cost: $297,500
- 2018: 11 buildings, average cost: $143,800
- 2017: 10 buildings, average cost: $185,000
- 2016: 8 buildings, average cost: $136,600
- 2015: 5 buildings, average cost: $109,800
- 2014: 9 buildings, average cost: $107,300
- 2013: 12 buildings, average cost: $108,300
- 2012: 8 buildings, average cost: $166,800
- 2011: 4 buildings, average cost: $83,000
- 2010: 11 buildings, average cost: $118,600
- 2009: 11 buildings, average cost: $67,900
- 2008: 16 buildings, average cost: $129,500
- 2007: 22 buildings, average cost: $132,600
- 2006: 92 buildings, average cost: $51,300
- 2005: 89 buildings, average cost: $38,100
- 2004: 91 buildings, average cost: $52,500
- 2003: 17 buildings, average cost: $101,100
- 2002: 29 buildings, average cost: $107,200
- 2001: 25 buildings, average cost: $76,500
- 2000: 24 buildings, average cost: $101,900
- 1999: 21 buildings, average cost: $68,100
- 1998: 31 buildings, average cost: $93,800
- 1997: 62 buildings, average cost: $44,600
Median real estate property taxes paid for housing units with mortgages in 2022: $844 (0.6%)
Median real estate property taxes paid for housing units with no mortgage in 2022: $502 (0.5%)
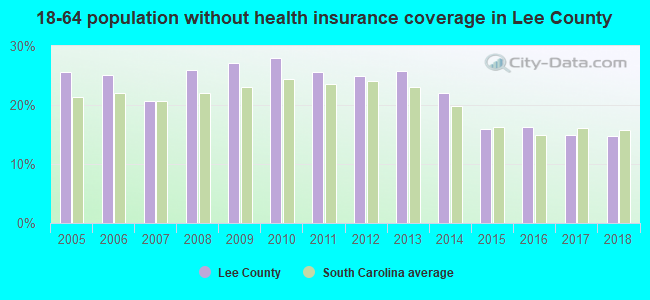
| Lee County: | 27.0% |
| South Carolina: | 14.0% |
Median age of residents in 2022: 42.0 years old
(Males: 39.4 years old, Females: 47.5 years old)
(Median age for: White residents: 50.4 years old, Black residents: 39.5 years old, Asian residents: 57.4 years old, Hispanic or Latino residents: 27.8 years old, Other race residents: 26.7 years old)
Fair market rent in 2006 for a 1-bedroom apartment in Lee County is $403 a month.
Fair market rent for a 2-bedroom apartment is $481 a month.
Fair market rent for a 3-bedroom apartment is $592 a month.
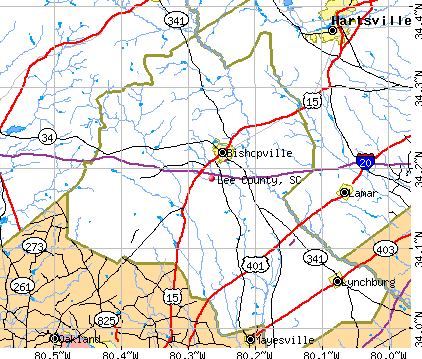
Cities in this county include: Ashwood, Bishopville, St. Charles, Stokes Bridge-Cypress, Lynchburg.
Neighboring counties: Clarendon County  , Howard County, Arkansas
  , Lexington County
  , Childress County, Texas , Ventura County, California , Pender County, North Carolina
  .
.
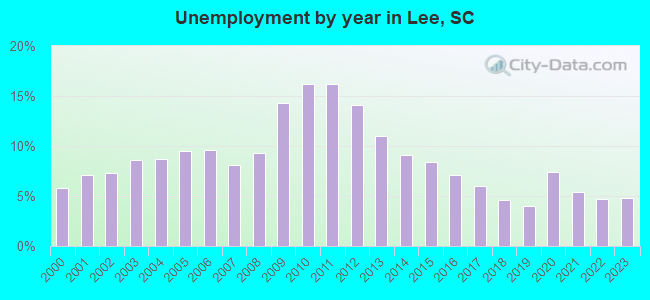
| Here: | 4.1% |
| South Carolina: | 3.1% |
Current college students: 465
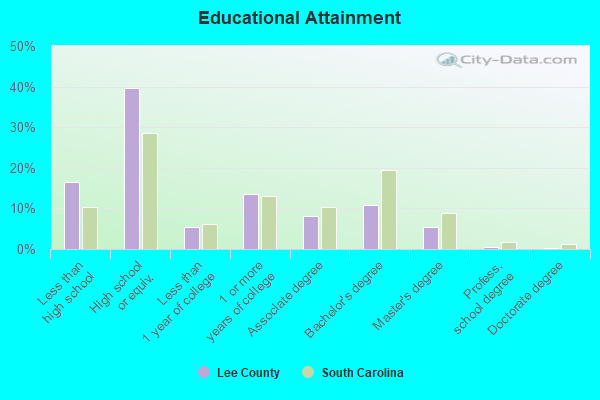
People 25 years of age or older with a high school degree or higher: 81.2%
People 25 years of age or older with a bachelor's degree or higher: 14.4%
Number of foreign born residents: 365 (3.6% naturalized citizens)
| Lee County: | 2.1% |
| Whole state: | 5.2% |
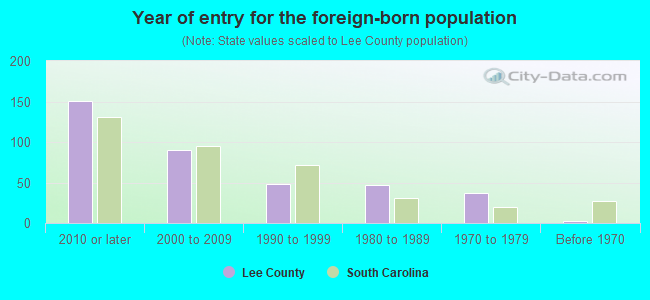
- Year of entry for the foreign-born population
- 2152010 or later
- 992000 to 2009
- 611990 to 1999
- 471980 to 1989
- 371970 to 1979
- 2Before 1970
Mean travel time to work (commute): minutes
Percentage of county residents living and working in this county: 99.3%
Housing units in structures:
- One, detached: 4,844
- One, attached: 21
- Two: 90
- 3 or 4: 275
- 5 to 9: 108
- 10 to 19: 18
- 20 to 49: 70
- 50 or more: 27
- Mobile homes: 2,300
Housing units in Lee County with a mortgage: 1,663 (38 second mortgage, 0 home equity loan, 10 both second mortgage and home equity loan)
Houses without a mortgage: 19
| Here: | 5.0% with mortgage |
| State: | 97.3% with mortgage |
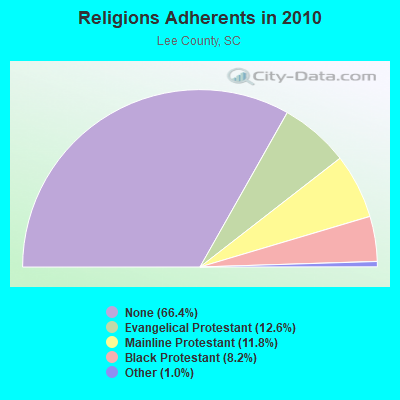
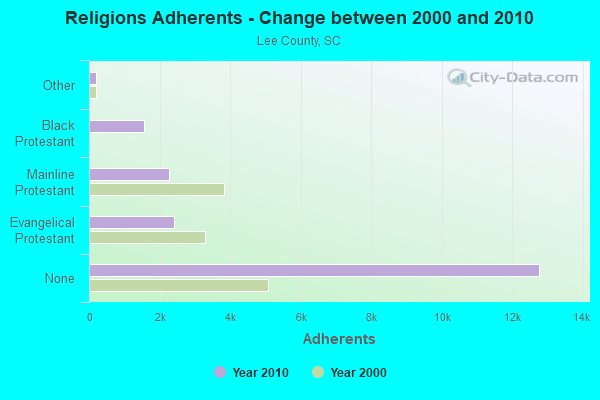
Religion statistics for Lee County
| Religion | Adherents | Congregations |
|---|---|---|
| Evangelical Protestant | 2,421 | 20 |
| Mainline Protestant | 2,261 | 16 |
| Black Protestant | 1,567 | 9 |
| Other | 201 | 1 |
| Catholic | - | - |
| None | 12,770 | - |
Source: Clifford Grammich, Kirk Hadaway, Richard Houseal, Dale E.Jones, Alexei Krindatch, Richie Stanley and Richard H.Taylor. 2012. 2010 U.S.Religion Census: Religious Congregations & Membership Study. Association of Statisticians of American Religious Bodies. Jones, Dale E., et al. 2002. Congregations and Membership in the United States 2000. Nashville, TN: Glenmary Research Center.
Food Environment Statistics:
| Lee County: | 1.50 / 10,000 pop. |
| State: | 1.99 / 10,000 pop. |
| This county: | 0.50 / 10,000 pop. |
| South Carolina: | 0.85 / 10,000 pop. |
| Lee County: | 5.50 / 10,000 pop. |
| South Carolina: | 5.38 / 10,000 pop. |
| This county: | 4.00 / 10,000 pop. |
| State: | 7.75 / 10,000 pop. |
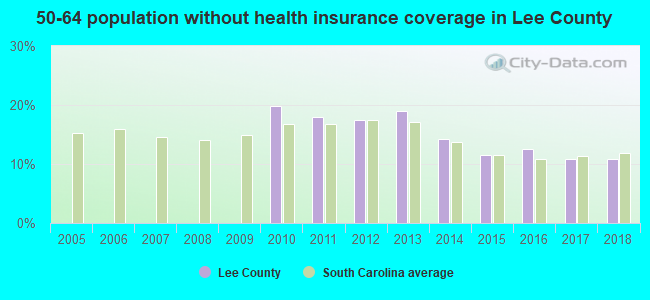
| Lee County: | 14.6% |
| South Carolina: | 10.6% |
| Lee County: | 36.7% |
| State: | 29.4% |
| Here: | 10.6% |
| State: | 13.4% |
Agriculture in Lee County:
Average size of farms: 378 acresAverage value of agricultural products sold per farm: $103,934
Average value of crops sold per acre for harvested cropland: $163.41
The value of nursery, greenhouse, floriculture, and sod as a percentage of the total market value of agricultural products sold: 0.87%
The value of livestock, poultry, and their products as a percentage of the total market value of agricultural products sold: 69.08%
Average total farm production expenses per farm: $94,101
Harvested cropland as a percentage of land in farms: 52.01%
Irrigated harvested cropland as a percentage of land in farms: 1.67%
Average market value of all machinery and equipment per farm: $92,994
The percentage of farms operated by a family or individual: 87.35%
Average age of principal farm operators: 56 years
Average number of cattle and calves per 100 acres of all land in farms: 2.66
Corn for grain: 14442 harvested acres
All wheat for grain: 14342 harvested acres
Upland cotton: 18065 harvested acres
Soybeans for beans: 22200 harvested acres
Vegetables: 76 harvested acres
Land in orchards: 25 acres
Earthquake activity:
Lee County-area historical earthquake activity is significantly above South Carolina state average. It is 38% smaller than the overall U.S. average.On 8/23/2011 at 17:51:04, a magnitude 5.8 (5.8 MW, Depth: 3.7 mi, Class: Moderate, Intensity: VI - VII) earthquake occurred 288.6 miles away from Lee County center
On 8/9/2020 at 12:07:37, a magnitude 5.1 (5.1 MW, Depth: 4.7 mi) earthquake occurred 165.1 miles away from the county center
On 8/2/1974 at 08:52:09, a magnitude 4.9 (4.3 MB, 4.9 LG, Class: Light, Intensity: IV - V) earthquake occurred 129.2 miles away from the county center
On 11/22/1974 at 05:25:55, a magnitude 4.7 (4.7 MB) earthquake occurred 89.2 miles away from the county center
On 8/21/1992 at 16:31:55, a magnitude 4.4 (4.1 MB, 4.1 LG, 4.4 LG, Depth: 6.2 mi) earthquake occurred 79.0 miles away from Lee County center
On 4/13/1998 at 09:56:11, a magnitude 3.9 (3.5 MB, 3.9 LG, Depth: 3.1 mi, Class: Light, Intensity: II - III) earthquake occurred 31.5 miles away from the county center
Magnitude types: regional Lg-wave magnitude (LG), body-wave magnitude (MB), moment magnitude (MW)
Most recent natural disasters:
- South Carolina Covid-19 Pandemic, Incident Period: January 20, 2020, FEMA Id: 4492, Natural disaster type: Other
- South Carolina Hurricane Irma, Incident Period: September 6, 2017 - September 13, 2017, FEMA Id: 4346, Natural disaster type: Hurricane
- South Carolina Hurricane Matthew, Incident Period: October 04, 2016 to October 30, 2016, Emergency Declared EM-3378: October 06, 2016, FEMA Id: 3378, Natural disaster type: Hurricane
- South Carolina Hurricane Matthew, Incident Period: October 04, 2016 to October 30, 2016, Major Disaster (Presidential) Declared DR-4286: October 11, 2016, FEMA Id: 4286, Natural disaster type: Hurricane
- South Carolina Severe Storms and Flooding, Incident Period: October 01, 2015 to October 23, 2015, Emergency Declared EM-3373: October 03, 2015, FEMA Id: 3373, Natural disaster type: Storm, Flood
- South Carolina Severe Storms and Flooding, Incident Period: October 01, 2015 to October 23, 2015, Major Disaster (Presidential) Declared DR-4241: October 05, 2015, FEMA Id: 4241, Natural disaster type: Storm, Flood
- South Carolina Severe Winter Storm, Incident Period: February 10, 2014 to February 19, 2014, Emergency Declared EM-3369: February 12, 2014, FEMA Id: 3369, Natural disaster type: Winter Storm
- South Carolina Hurricane Katrina Evacuation, Incident Period: August 29, 2005 to October 01, 2005, Emergency Declared EM-3233: September 10, 2005, FEMA Id: 3233, Natural disaster type: Hurricane
- South Carolina Tropical Storm Frances, Incident Period: September 06, 2004 to October 11, 2004, Major Disaster (Presidential) Declared DR-1566: October 07, 2004, FEMA Id: 1566, Natural disaster type: Tropical Storm
- South Carolina Severe Ice Storm, Incident Period: January 26, 2004 to January 30, 2004, Major Disaster (Presidential) Declared DR-1509: February 13, 2004, FEMA Id: 1509, Natural disaster type: Ice Storm
- 5 other natural disasters have been reported since 1953.
The number of natural disasters in Lee County (15) is near the US average (15).
Major Disasters (Presidential) Declared: 8
Emergencies Declared: 5
Causes of natural disasters: Hurricanes: 7, Floods: 3, Storms: 3, Winter Storms: 2, Ice Storm: 1, Tropical Storm: 1, Other: 1 (Note: some incidents may be assigned to more than one category).
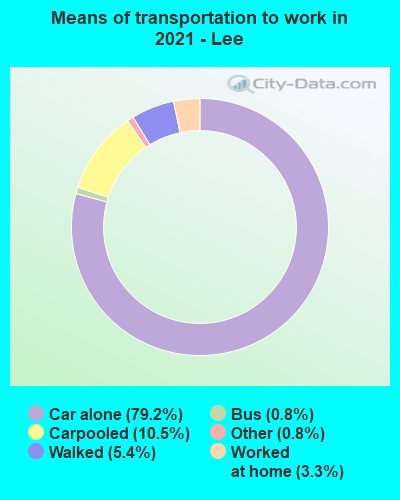
Means of transportation to work:
- Drove a car alone: 3,004 (77.7%)
- Carpooled: 393 (10.2%)
- Taxicab, motorcycle, or other means: 96 (2.5%)
- Walked: 159 (4.1%)
- Worked at home: 115 (3.0%)
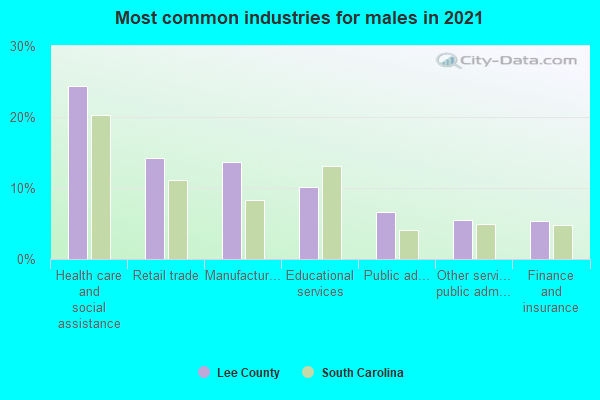
- Health care and social assistance (21%)
- Retail trade (16%)
- Manufacturing (13%)
- Public administration (11%)
- Educational services (10%)
- Other services, except public administration (7%)
- Finance and insurance (6%)
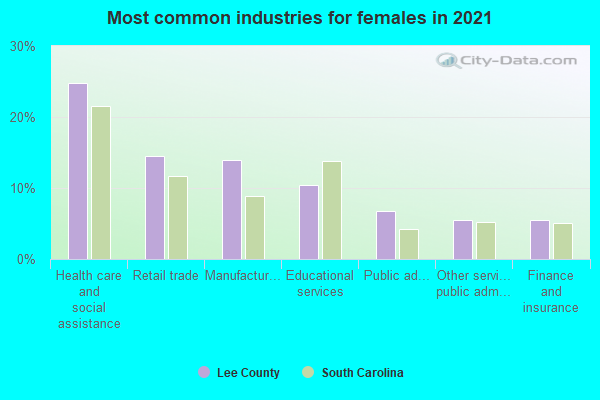
- Health care and social assistance (20%)
- Retail trade (15%)
- Manufacturing (12%)
- Public administration (11%)
- Educational services (10%)
- Other services, except public administration (7%)
- Finance and insurance (5%)
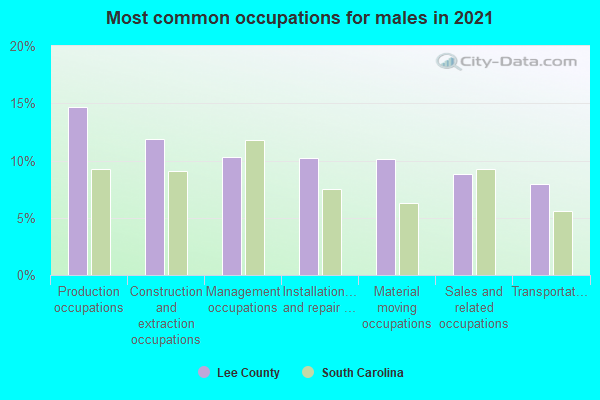
- Production occupations (16%)
- Installation, maintenance, and repair occupations (13%)
- Material moving occupations (11%)
- Management occupations (9%)
- Construction and extraction occupations (8%)
- Transportation occupations (8%)
- Sales and related occupations (7%)
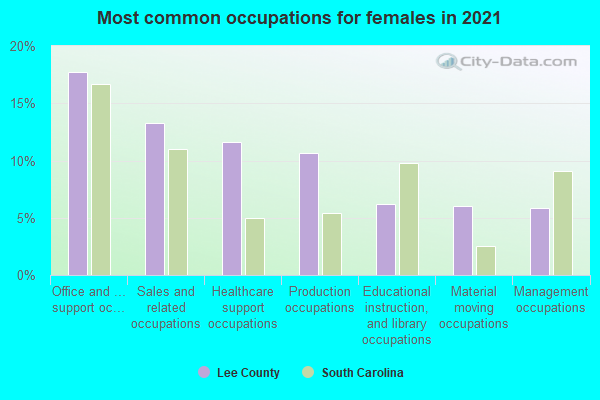
- Office and administrative support occupations (16%)
- Sales and related occupations (13%)
- Production occupations (13%)
- Healthcare support occupations (11%)
- Educational instruction, and library occupations (7%)
- Management occupations (6%)
- Material moving occupations (6%)
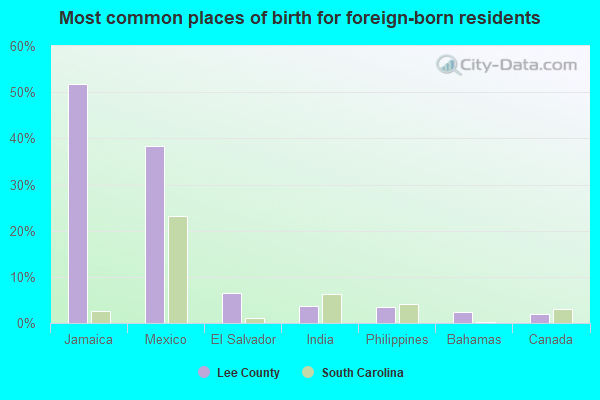
- Jamaica (47%)
- Mexico (31%)
- Honduras (9%)
- Philippines (4%)
- Bahamas (2%)
- Colombia (1%)
- England (0%)
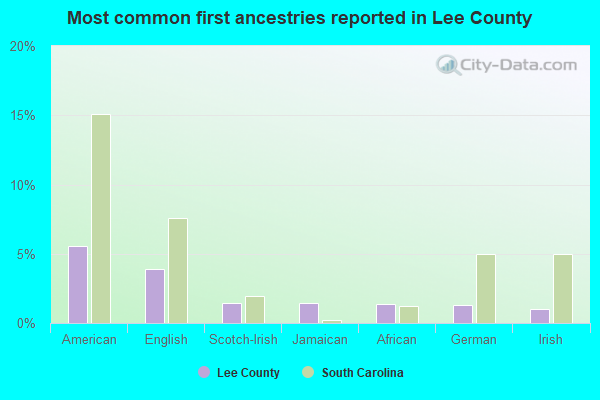
- American (9%)
- English (4%)
- Irish (3%)
- Jamaican (2%)
- Scotch-Irish (1%)
- African (1%)
- German (1%)
People in group quarters in Lee County, South Carolina in 2010:
- 1,802 people in state prisons
- 118 people in nursing facilities/skilled-nursing facilities
- 44 people in residential treatment centers for adults
- 11 people in group homes intended for adults
People in group quarters in Lee County, South Carolina in 2000:
- 1,458 people in state prisons
- 156 people in nursing homes
- 41 people in homes for the mentally retarded
- 13 people in local jails and other confinement facilities (including police lockups)
- 10 people in agriculture workers' dormitories on farms
- 8 people in other group homes
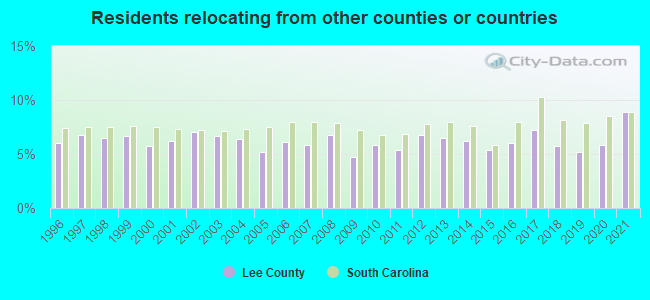
8.86% of this county's 2021 resident taxpayers lived in other counties in 2020 ($29,774 average adjusted gross income)
| Here: | 8.86% |
| South Carolina average: | 8.89% |
10 or fewer of this county's residents moved from foreign countries.
6.43% relocated from other counties in South Carolina ($21,343 average AGI)
2.43% relocated from other states ($8,433 average AGI)
Lee County: 2.43% South Carolina average: 4.96%
Top counties from which taxpayers relocated into this county between 2020 and 2021:
| from Sumter County, SC | |
| from Kershaw County, SC | |
| from Darlington County, SC | |
| from Florence County, SC | |
| from Richland County, SC |
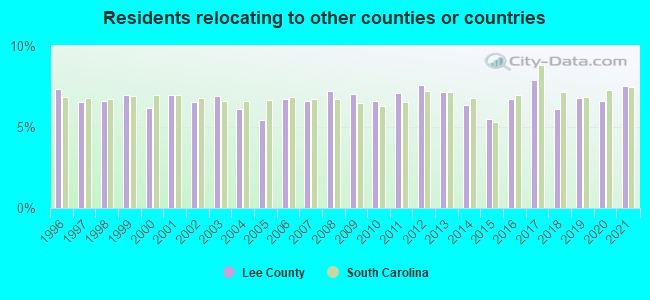
7.54% of this county's 2020 resident taxpayers moved to other counties in 2021 ($36,849 average adjusted gross income)
| Here: | 7.54% |
| South Carolina average: | 7.46% |
10 or fewer of this county's residents moved to foreign countries.
6.51% relocated to other counties in South Carolina ($31,404 average AGI)
1.03% relocated to other states ($5,445 average AGI)
Lee County: 1.03% South Carolina average: 3.47%
Top counties to which taxpayers relocated from this county between 2020 and 2021:
| to Sumter County, SC | |
| to Kershaw County, SC | |
| to Richland County, SC | |
| to Darlington County, SC | |
| to Florence County, SC |
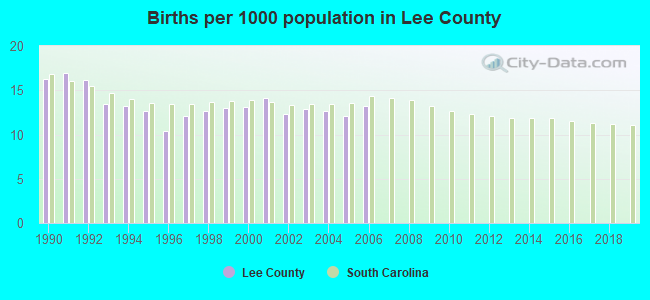
Births per 1000 population from 1990 to 1999: 13.7
Births per 1000 population from 2000 to 2006: 12.9
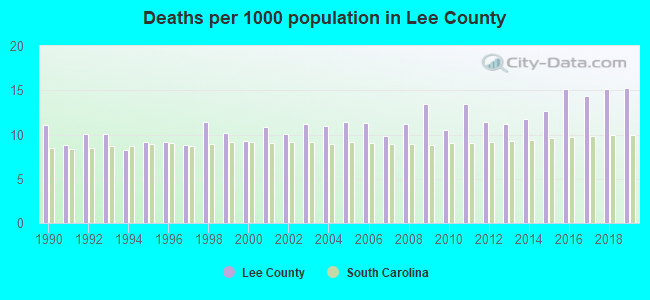
Deaths per 1000 population from 1990 to 1999: 9.7
Deaths per 1000 population from 2000 to 2009: 11.0
Deaths per 1000 population from 2010 to 2020: 13.5
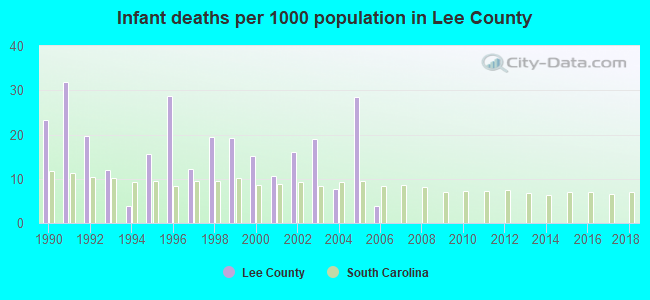
Infant deaths per 1000 live births from 1990 to 1999: 18.6
Infant deaths per 1000 live births from 2000 to 2006: 14.4
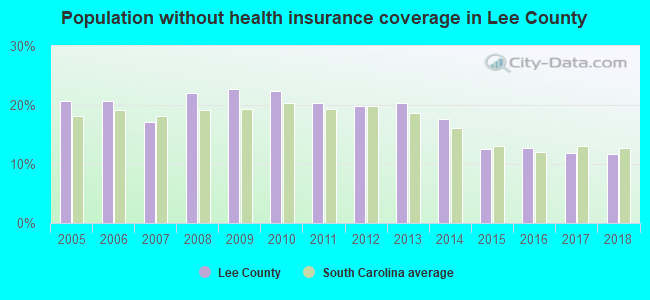
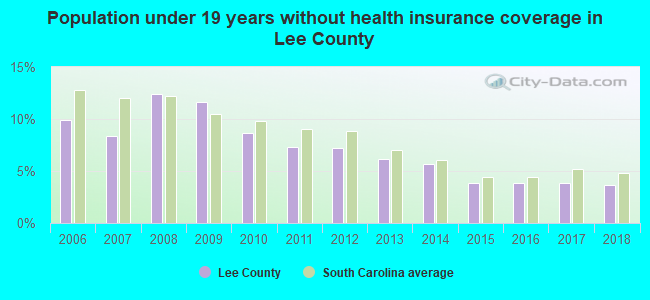
Persons under 19 years old without health insurance coverage in 2018: 3.7%

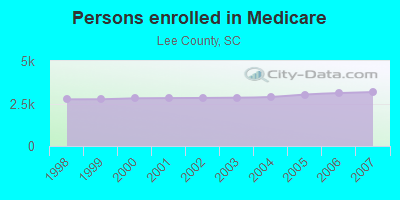
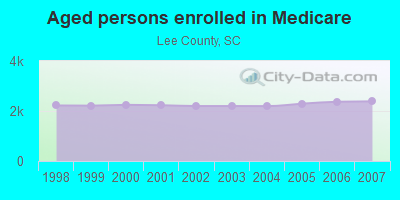
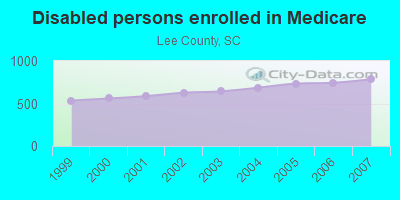
Persons enrolled in hospital insurance and/or supplemental medical insurance (Medicare) in July 1, 2007: 3,172 (2,386 aged, 786 disabled)
Children under 18 without health insurance coverage in 2007: 360 (8%)
Most common underlying causes of death in Lee County, South Carolina in 1999 - 2019:
- Acute myocardial infarction, unspecified (435)
- Bronchus or lung, unspecified - Malignant neoplasms (271)
- Stroke, not specified as haemorrhage or infarction (88)
- Atherosclerotic heart disease (82)
- Chronic obstructive pulmonary disease, unspecified (82)
- Alzheimer disease, unspecified (61)
- Unspecified diabetes mellitus, without complications (52)
- Unspecified dementia (47)
- Pneumonia, unspecified (12)
- Septicaemia, unspecified (11)
Population without health insurance coverage in 2000: 21%
Children under 18 without health insurance coverage in 2000: 17%
Medical specialist MDs per 100,000 population in 2005: 1,177
Total births per 100,000 population, July 2005 - July 2006 : 10
Total deaths per 100,000 population, July 2005 - July 2006: 53
EPA green book nonattainment status in 2004-2006: 1
Crimes per 100,000 population in 1996: 1
Household type by relationship:
Households: 17,007- Male householders: 2,954 (1,118 living alone), Female householders: 3,607 (1,310 living alone)
2,324 spouses (2,304 opposite-sex spouses), 446 unmarried partners, (429 opposite-sex unmarried partners), 4,339 children (3,947 natural, 77 adopted, 319 stepchildren), 1,151 grandchildren, 123 brothers or sisters, 145 parents, 0 foster children, 332 other relatives, 177 non-relatives
- In group quarters: 1,359
Size of family households: 1,821 2-persons, 621 3-persons, 726 4-persons, 346 5-persons, 363 6-persons, 59 7-or-more-persons.
Size of nonfamily households: 2,428 1-person, 191 2-persons, 7 4-persons.
917 married couples with children.
1,125 single-parent households (377 men, 748 women).
95.8% of residents of Lee speak English at home.
3.2% of residents speak Spanish at home (88% speak English very well, 12% speak English well).
0.3% of residents speak other Indo-European language at home (100% speak English very well).
0.5% of residents speak other language at home (100% speak English very well).
In fiscal year 2004:
Federal Government expenditure: $123,243,000 ($6,012 per capita)
Department of Defense expenditure: $1,990,000
Federal direct payments to individuals for retirement and disability: $44,023,000
Federal other direct payments to individuals: $25,123,000
Federal direct payments not to individuals: $6,961,000
Federal grants: $44,640,000
Federal procurement contracts: $484,000 ($0,000 Department of Defense)
Federal salaries and wages: $2,012,000 ($0,000 Department of Defense)
Federal Government direct loans: $751,000
Federal guaranteed/insured loans: $1,242,000
Federal Government insurance: $13,267,000
Population change from April 1, 2000 to July 1, 2005:
Births: 1,434| Here: | 69 per 1000 residents |
| State: | 69 per 1000 residents |
Deaths: 1,137
| Here: | 55 per 1000 residents |
| State: | 46 per 1000 residents |
Net international migration: +292
| Here: | +14 per 1000 residents |
| State: | +9 per 1000 residents |
Net internal migration: -41
| Here: | |
| State: |
Total withdrawal of fresh water for public supply: 1.58 millions of gallons per day (all from ground)
| Here: | 6.2 |
| State: | 6.4 |
| Here: | 4.7 |
| State: | 4.5 |
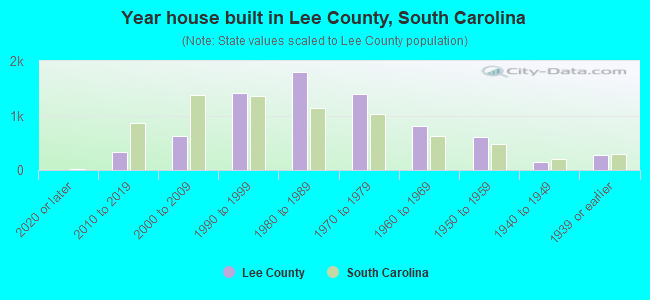
- Year house built in Lee County, South Carolina
- 92020 or later
- 3302010 to 2019
- 5832000 to 2009
- 1,4101990 to 1999
- 1,8621980 to 1989
- 1,3631970 to 1979
- 9031960 to 1969
- 5681950 to 1959
- 1871940 to 1949
- 2101939 or earlier
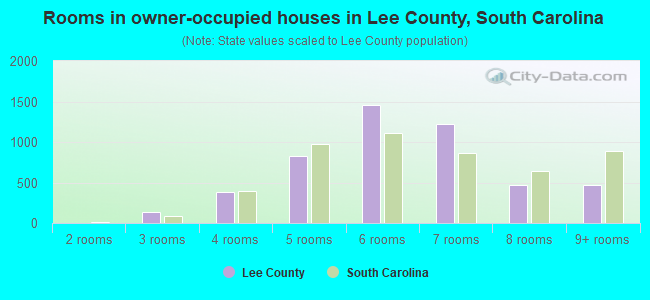
- Rooms in owner-occupied houses in Lee County, South Carolina
- 81 room
- 02 rooms
- 863 rooms
- 4544 rooms
- 9095 rooms
- 1,3526 rooms
- 1,0867 rooms
- 5498 rooms
- 4229+ rooms
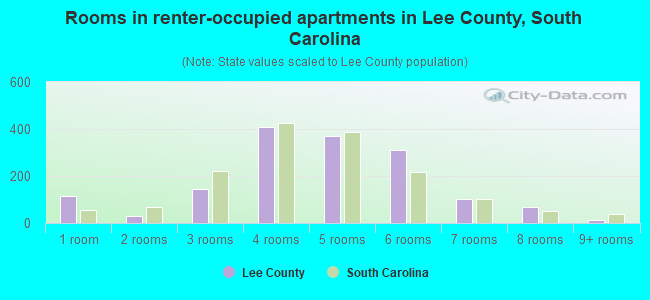
- Rooms in renter-occupied apartments in Lee County, South Carolina
- 801 room
- 202 rooms
- 2493 rooms
- 3974 rooms
- 4445 rooms
- 3196 rooms
- 727 rooms
- 368 rooms
- 349+ rooms
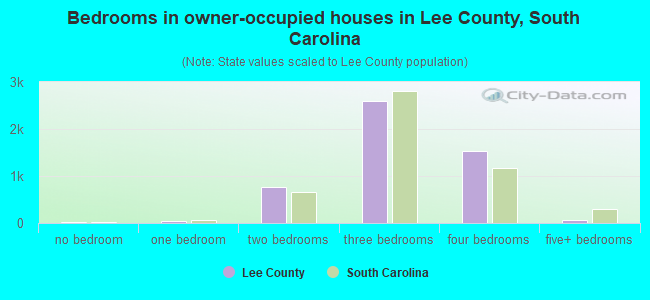
- Bedrooms in owner-occupied houses in Lee County, South Carolina
- 15no bedroom
- 01 bedroom
- 7602 bedrooms
- 2,7253 bedrooms
- 1,2994 bedrooms
- 1075+ bedrooms
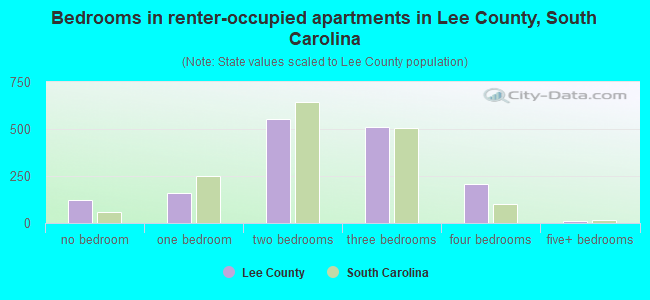
- Bedrooms in renter-occupied apartments in Lee County, South Carolina
- 85no bedroom
- 1821 bedroom
- 5922 bedrooms
- 6003 bedrooms
- 1834 bedrooms
- 95+ bedrooms
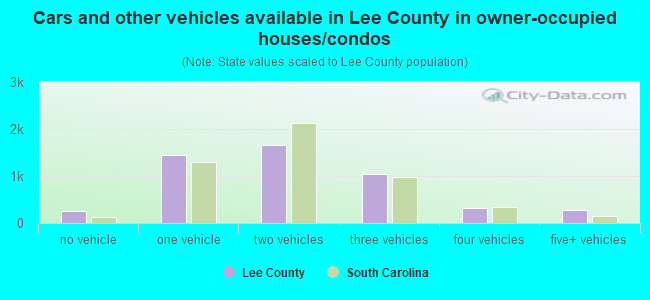
- Cars and other vehicles available in Lee County in owner-occupied houses/condos
- 317no vehicle
- 1,4631 vehicle
- 1,6962 vehicles
- 8813 vehicles
- 2784 vehicles
- 2655+ vehicles
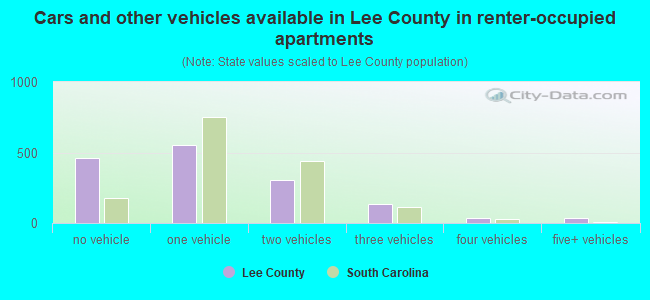
- Cars and other vehicles available in Lee County in renter-occupied apartments
- 452no vehicle
- 5831 vehicle
- 4332 vehicles
- 973 vehicles
- 274 vehicles
- 515+ vehicles
90.0% of Lee County residents lived in the same house 1 years ago.
Out of people who lived in different houses, 28% lived in this county.
Out of people who lived in different counties, 83% lived in South Carolina.
| Lee County: | 90.0% |
| State average: | 86.5% |
Place of birth for U.S.-born residents:
- This state: 12,849
- Other state: 3,488
- Northeast: 1,389
- Midwest: 410
- South: 1,484
- West: 203
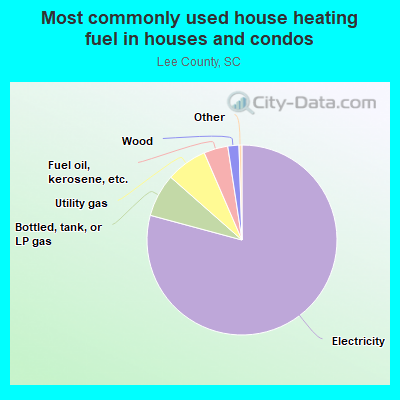
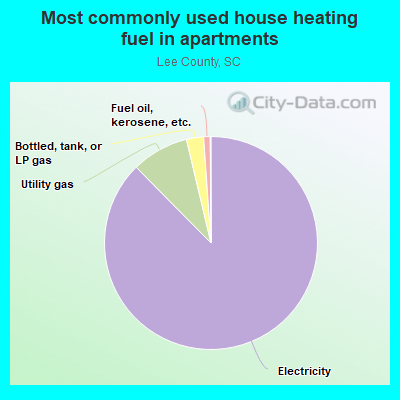
- 81.5%Electricity
- 7.7%Bottled, tank, or LP gas
- 6.4%Utility gas
- 2.7%Fuel oil, kerosene, etc.
- 1.3%Wood
- 0.3%No fuel used
- 88.5%Electricity
- 8.3%Utility gas
- 2.4%Bottled, tank, or LP gas
- 0.9%Fuel oil, kerosene, etc.
Private vs. public school enrollment:
| Here: | 14.9% |
| South Carolina: | 14.4% |
| Here: | 6.2% |
| South Carolina: | 11.1% |
| Here: | 2.7% |
| South Carolina: | 21.9% |
Lee County government finances - Expenditure in 2018:
- Charges - Parks and Recreation: $22,000
- Construction - Miscellaneous Commercial Activities - Other: $488,000
Police Protection: $367,000
Parks and Recreation: $286,000
Housing and Community Development: $279,000
Protective Inspection and Regulation - Other: $122,000
Central Staff Services: $112,000
Local Fire Protection: $88,000
- Current Operations - Local Fire Protection: $4,811,000
Financial Administration: $2,094,000
Toll Highways: $1,792,000
General Public Buildings: $1,527,000
General - Other: $1,473,000
Judicial and Legal Services: $872,000
Local Fire Protection: $703,000
Correctional Institutions: $698,000
Police Protection: $646,000
General Public Buildings: $574,000
Public Welfare - Other: $461,000
Parks and Recreation: $431,000
Central Staff Services: $314,000
Central Staff Services: $301,000
Financial Administration: $237,000
Judicial and Legal Services: $133,000
Libraries: $101,000
Parks and Recreation: $39,000
Air Transportation: $26,000
- General - Interest on Debt: $187,000
- Intergovernmental to Local - Other - General - Other: $544,000
Other - Solid Waste Management: $385,000
- Intergovernmental to State - Financial Administration: $1,089,000
- Local Intergovernmental - General Local Government Support: $2,574,000
Health and Hospitals: $1,025,000
Housing and Community Development: $59,000
Other: $17,000
- Long Term Debt - Beginning Outstanding - Unspecified Public Purpose: $17,151,000
Outstanding Unspecified Public Purpose: $16,504,000
Beginning Outstanding - Unspecified Public Purpose: $4,044,000
Outstanding Unspecified Public Purpose: $3,025,000
Retired Unspecified Public Purpose: $1,560,000
Retired Unspecified Public Purpose: $647,000
Outstanding Nonguaranteed - Industrial Revenue: $629,000
Beginning Outstanding - Public Debt for Private Purpose: $629,000
Beginning Outstanding - Public Debt for Private Purpose: $629,000
Outstanding Nonguaranteed - Industrial Revenue: $629,000
Issue, Unspecified Public Purpose: $541,000
- Other Funds - Cash and Securities: $5,776,000
- Sinking Funds - Cash and Securities: $629,000
Cash and Securities: $629,000
- State Intergovernmental - General Local Government Support: $1,547,000
General Local Government Support: $634,000
- Tax - Property: $5,503,000
Other License: $5,006,000
Property: $4,744,000
General Sales and Gross Receipts: $1,928,000
Other Selective Sales: $1,671,000
General Sales and Gross Receipts: $1,298,000
- Total Salaries and Wages: $5,196,000
Lee County government finances - Revenue in 2018:
- Charges - Parks and Recreation: $22,000
- Construction - Miscellaneous Commercial Activities - Other: $488,000
Police Protection: $367,000
Parks and Recreation: $286,000
Housing and Community Development: $279,000
Protective Inspection and Regulation - Other: $122,000
Central Staff Services: $112,000
Local Fire Protection: $88,000
- Current Operations - Local Fire Protection: $4,811,000
Financial Administration: $2,094,000
Toll Highways: $1,792,000
General Public Buildings: $1,527,000
General - Other: $1,473,000
Judicial and Legal Services: $872,000
Local Fire Protection: $703,000
Correctional Institutions: $698,000
Police Protection: $646,000
General Public Buildings: $574,000
Public Welfare - Other: $461,000
Parks and Recreation: $431,000
Central Staff Services: $314,000
Central Staff Services: $301,000
Financial Administration: $237,000
Judicial and Legal Services: $133,000
Libraries: $101,000
Parks and Recreation: $39,000
Air Transportation: $26,000
- General - Interest on Debt: $187,000
- Intergovernmental to Local - Other - General - Other: $544,000
Other - Solid Waste Management: $385,000
- Intergovernmental to State - Financial Administration: $1,089,000
- Local Intergovernmental - General Local Government Support: $2,574,000
Health and Hospitals: $1,025,000
Housing and Community Development: $59,000
Other: $17,000
- Long Term Debt - Beginning Outstanding - Unspecified Public Purpose: $17,151,000
Outstanding Unspecified Public Purpose: $16,504,000
Beginning Outstanding - Unspecified Public Purpose: $4,044,000
Outstanding Unspecified Public Purpose: $3,025,000
Retired Unspecified Public Purpose: $1,560,000
Retired Unspecified Public Purpose: $647,000
Outstanding Nonguaranteed - Industrial Revenue: $629,000
Beginning Outstanding - Public Debt for Private Purpose: $629,000
Beginning Outstanding - Public Debt for Private Purpose: $629,000
Outstanding Nonguaranteed - Industrial Revenue: $629,000
Issue, Unspecified Public Purpose: $541,000
- Other Funds - Cash and Securities: $5,776,000
- Sinking Funds - Cash and Securities: $629,000
Cash and Securities: $629,000
- State Intergovernmental - General Local Government Support: $1,547,000
General Local Government Support: $634,000
- Tax - Property: $5,503,000
Other License: $5,006,000
Property: $4,744,000
General Sales and Gross Receipts: $1,928,000
Other Selective Sales: $1,671,000
General Sales and Gross Receipts: $1,298,000
- Total Salaries and Wages: $5,196,000
Lee County government finances - Debt in 2018:
- Charges - Parks and Recreation: $22,000
- Construction - Miscellaneous Commercial Activities - Other: $488,000
Police Protection: $367,000
Parks and Recreation: $286,000
Housing and Community Development: $279,000
Protective Inspection and Regulation - Other: $122,000
Central Staff Services: $112,000
Local Fire Protection: $88,000
- Current Operations - Local Fire Protection: $4,811,000
Financial Administration: $2,094,000
Toll Highways: $1,792,000
General Public Buildings: $1,527,000
General - Other: $1,473,000
Judicial and Legal Services: $872,000
Local Fire Protection: $703,000
Correctional Institutions: $698,000
Police Protection: $646,000
General Public Buildings: $574,000
Public Welfare - Other: $461,000
Parks and Recreation: $431,000
Central Staff Services: $314,000
Central Staff Services: $301,000
Financial Administration: $237,000
Judicial and Legal Services: $133,000
Libraries: $101,000
Parks and Recreation: $39,000
Air Transportation: $26,000
- General - Interest on Debt: $187,000
- Intergovernmental to Local - Other - General - Other: $544,000
Other - Solid Waste Management: $385,000
- Intergovernmental to State - Financial Administration: $1,089,000
- Local Intergovernmental - General Local Government Support: $2,574,000
Health and Hospitals: $1,025,000
Housing and Community Development: $59,000
Other: $17,000
- Long Term Debt - Beginning Outstanding - Unspecified Public Purpose: $17,151,000
Outstanding Unspecified Public Purpose: $16,504,000
Beginning Outstanding - Unspecified Public Purpose: $4,044,000
Outstanding Unspecified Public Purpose: $3,025,000
Retired Unspecified Public Purpose: $1,560,000
Retired Unspecified Public Purpose: $647,000
Outstanding Nonguaranteed - Industrial Revenue: $629,000
Beginning Outstanding - Public Debt for Private Purpose: $629,000
Beginning Outstanding - Public Debt for Private Purpose: $629,000
Outstanding Nonguaranteed - Industrial Revenue: $629,000
Issue, Unspecified Public Purpose: $541,000
- Other Funds - Cash and Securities: $5,776,000
- Sinking Funds - Cash and Securities: $629,000
Cash and Securities: $629,000
- State Intergovernmental - General Local Government Support: $1,547,000
General Local Government Support: $634,000
- Tax - Property: $5,503,000
Other License: $5,006,000
Property: $4,744,000
General Sales and Gross Receipts: $1,928,000
Other Selective Sales: $1,671,000
General Sales and Gross Receipts: $1,298,000
- Total Salaries and Wages: $5,196,000
Lee County government finances - Cash and Securities in 2018:
- Charges - Parks and Recreation: $22,000
- Construction - Miscellaneous Commercial Activities - Other: $488,000
Police Protection: $367,000
Parks and Recreation: $286,000
Housing and Community Development: $279,000
Protective Inspection and Regulation - Other: $122,000
Central Staff Services: $112,000
Local Fire Protection: $88,000
- Current Operations - Local Fire Protection: $4,811,000
Financial Administration: $2,094,000
Toll Highways: $1,792,000
General Public Buildings: $1,527,000
General - Other: $1,473,000
Judicial and Legal Services: $872,000
Local Fire Protection: $703,000
Correctional Institutions: $698,000
Police Protection: $646,000
General Public Buildings: $574,000
Public Welfare - Other: $461,000
Parks and Recreation: $431,000
Central Staff Services: $314,000
Central Staff Services: $301,000
Financial Administration: $237,000
Judicial and Legal Services: $133,000
Libraries: $101,000
Parks and Recreation: $39,000
Air Transportation: $26,000
- General - Interest on Debt: $187,000
- Intergovernmental to Local - Other - General - Other: $544,000
Other - Solid Waste Management: $385,000
- Intergovernmental to State - Financial Administration: $1,089,000
- Local Intergovernmental - General Local Government Support: $2,574,000
Health and Hospitals: $1,025,000
Housing and Community Development: $59,000
Other: $17,000
- Long Term Debt - Beginning Outstanding - Unspecified Public Purpose: $17,151,000
Outstanding Unspecified Public Purpose: $16,504,000
Beginning Outstanding - Unspecified Public Purpose: $4,044,000
Outstanding Unspecified Public Purpose: $3,025,000
Retired Unspecified Public Purpose: $1,560,000
Retired Unspecified Public Purpose: $647,000
Outstanding Nonguaranteed - Industrial Revenue: $629,000
Beginning Outstanding - Public Debt for Private Purpose: $629,000
Beginning Outstanding - Public Debt for Private Purpose: $629,000
Outstanding Nonguaranteed - Industrial Revenue: $629,000
Issue, Unspecified Public Purpose: $541,000
- Other Funds - Cash and Securities: $5,776,000
- Sinking Funds - Cash and Securities: $629,000
Cash and Securities: $629,000
- State Intergovernmental - General Local Government Support: $1,547,000
General Local Government Support: $634,000
- Tax - Property: $5,503,000
Other License: $5,006,000
Property: $4,744,000
General Sales and Gross Receipts: $1,928,000
Other Selective Sales: $1,671,000
General Sales and Gross Receipts: $1,298,000
- Total Salaries and Wages: $5,196,000
Supplemental Security Income (SSI) in 2006:
- Total number of recipients: 1,095
- Number of aged recipients: 185
- Number of blind and disabled recipients: 910
- Number of recipients under 18: 165
- Number of recipients between 18 and 64: 532
- Number of recipients older than 64: 398
- Number of recipients also receiving OASDI: 529
- Amount of payments (thousands of dollars): 431
| Most common first names in Lee County, SC among deceased individuals | ||
| Name | Count | Lived (average) |
|---|---|---|
| James | 152 | 69.0 years |
| Mary | 142 | 77.2 years |
| John | 107 | 71.5 years |
| Robert | 106 | 69.8 years |
| Willie | 98 | 69.6 years |
| William | 95 | 72.3 years |
| Henry | 68 | 71.8 years |
| George | 60 | 75.0 years |
| Annie | 56 | 78.8 years |
| Rosa | 46 | 79.1 years |
| Most common last names in Lee County, SC among deceased individuals | ||
| Last name | Count | Lived (average) |
|---|---|---|
| Wilson | 90 | 70.9 years |
| Brown | 82 | 75.6 years |
| Davis | 76 | 73.3 years |
| Smith | 64 | 72.8 years |
| Johnson | 63 | 75.9 years |
| Thomas | 54 | 73.2 years |
| Bradley | 45 | 70.3 years |
| Williams | 44 | 66.6 years |
| Scarborough | 43 | 73.3 years |
| Stuckey | 40 | 74.3 years |
| Businesses in Lee County, SC | ||||
| Name | Count | Name | Count | |
|---|---|---|---|---|
| Ace Hardware | 1 | Lane Furniture | 1 | |
| Advance Auto Parts | 1 | McDonald's | 1 | |
| CVS | 1 | Pizza Hut | 1 | |
| Dairy Queen | 1 | RadioShack | 1 | |
| Econo Lodge | 1 | Subway | 1 | |
| FedEx | 1 | U-Haul | 2 | |
| H&R Block | 1 | UPS | 1 | |
| Hardee's | 1 | Waffle House | 1 | |
| KFC | 1 | Wendy's | 1 | |