Crime rate in San Angelo, Texas (TX): murders, rapes, robberies, assaults, burglaries, thefts, auto thefts, arson, law enforcement employees, police officers, crime map
Crime rate in San Angelo, TX
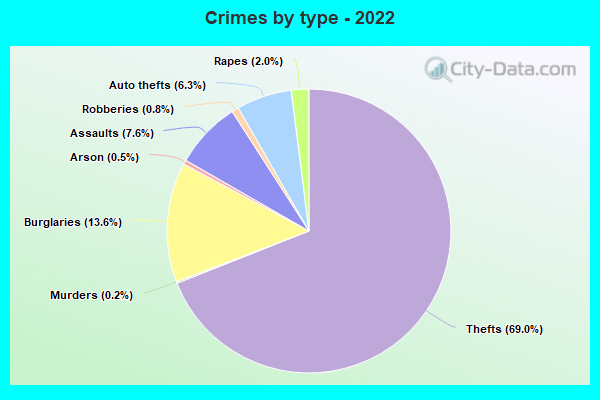
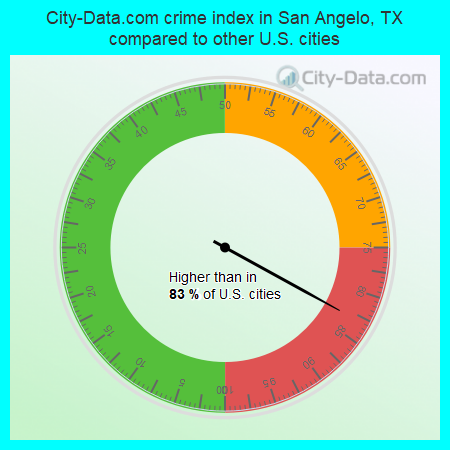
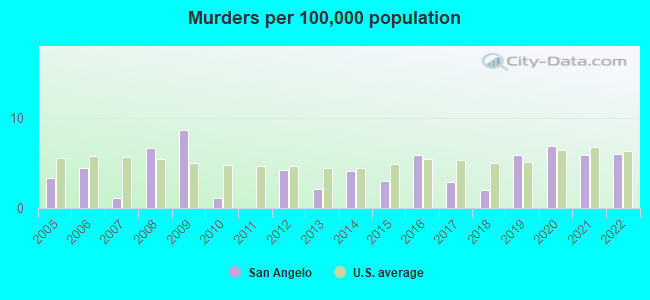
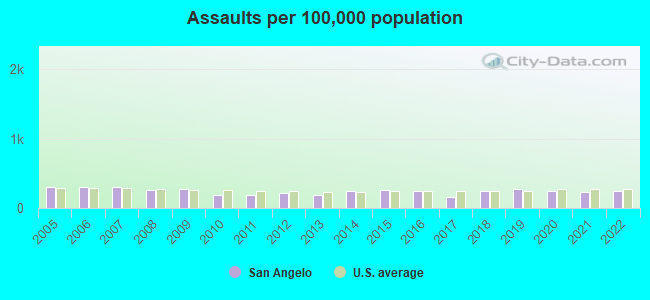
The 2022 crime rate in San Angelo, TX is 253 (City-Data.com crime index), which is about the average for the U.S. cities. It was higher than in 83.0% U.S. cities. The 2022 San Angelo crime rate rose by 1% compared to 2021. The number of homicides stood at 6. In the last 5 years San Angelo has seen decreasing violent crime and decreasing property crime.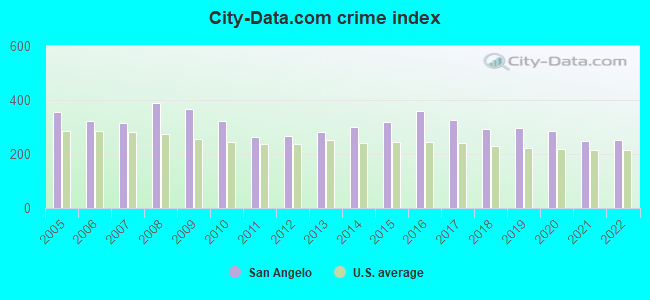
The City-Data.com crime index weighs serious crimes and violent crimes more heavily. Higher means more crime, U.S. average is 246.1. It adjusts for the number of visitors and daily workers commuting into cities.
- means the value is smaller than the state average.- means the value is about the same as the state average.
- means the value is bigger than the state average.
- means the value is much bigger than the state average.
According to our research of Texas and other state lists, there were 453 registered sex offenders living in San Angelo, Texas as of May 17, 2024.
The ratio of all residents to sex offenders in San Angelo is 229 to 1.
Violent crime rate in 2022
| San Angelo: | 209.6 |
| U.S. Average: | 219.8 |
Violent crime rate in 2021
| San Angelo: | 213.3 |
| U.S. Average: | 224.8 |
Violent crime rate in 2020
| San Angelo: | 235.6 |
| U.S. Average: | 228.2 |
Violent crime rate in 2019
| San Angelo: | 248.8 |
| U.S. Average: | 219.9 |
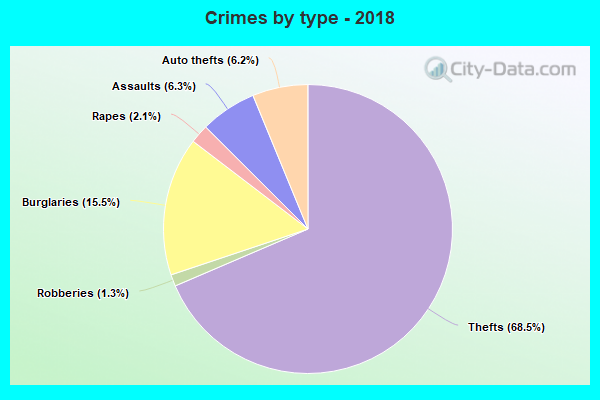
Violent crime rate in 2018
| San Angelo: | 228.0 |
| U.S. Average: | 221.2 |
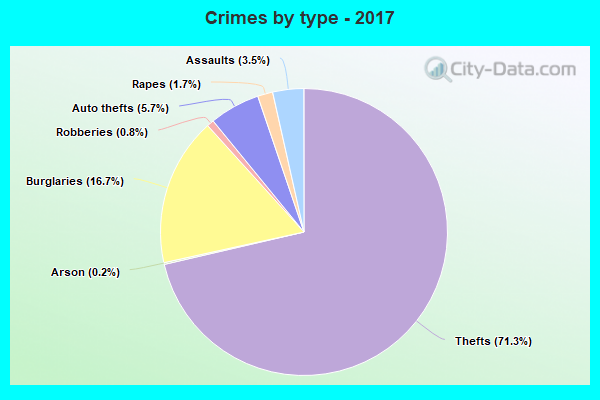
Violent crime rate in 2017
| San Angelo: | 188.9 |
| U.S. Average: | 226.2 |
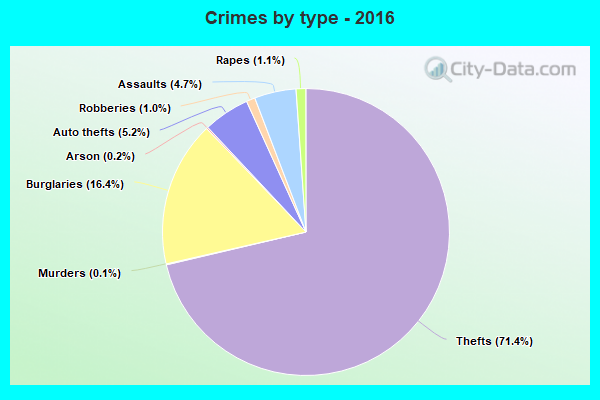
Violent crime rate in 2016
| San Angelo: | 219.4 |
| U.S. Average: | 227.3 |
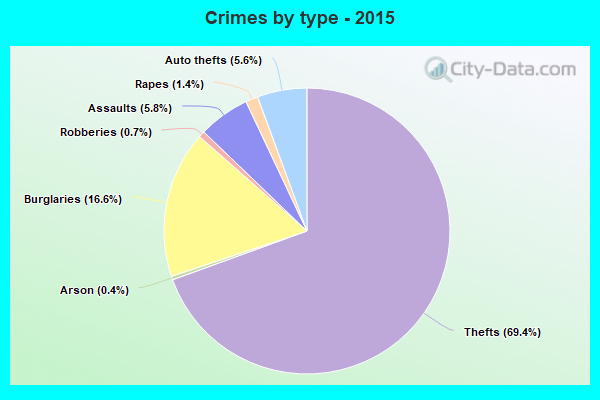
Violent crime rate in 2015
| San Angelo: | 216.7 |
| U.S. Average: | 219.3 |
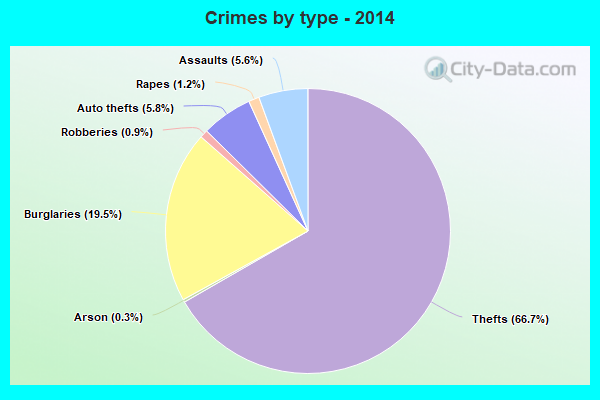
Violent crime rate in 2014
| San Angelo: | 197.0 |
| U.S. Average: | 211.1 |
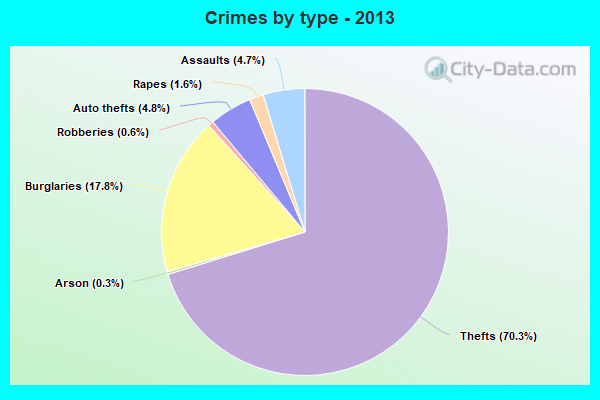
Violent crime rate in 2013
| San Angelo: | 174.3 |
| U.S. Average: | 214.2 |
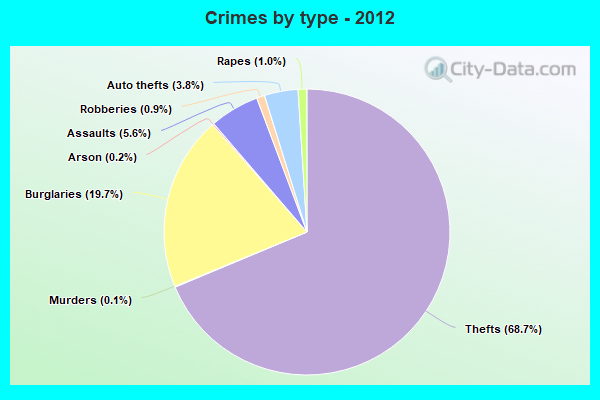
Violent crime rate in 2012
| San Angelo: | 175.1 |
| U.S. Average: | 187.4 |
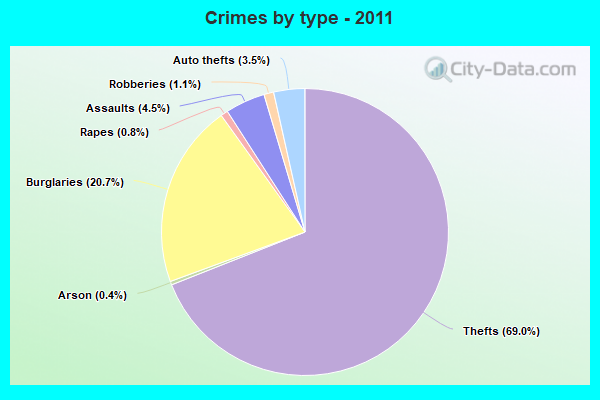
Violent crime rate in 2011
| San Angelo: | 149.2 |
| U.S. Average: | 187.1 |
Violent crime rate in 2010
| San Angelo: | 177.6 |
| U.S. Average: | 195.7 |
Violent crime rate in 2009
| San Angelo: | 246.6 |
| U.S. Average: | 208.9 |
Violent crime rate in 2008
| San Angelo: | 249.6 |
| U.S. Average: | 222.5 |
Violent crime rate in 2007
| San Angelo: | 197.8 |
| U.S. Average: | 229.1 |
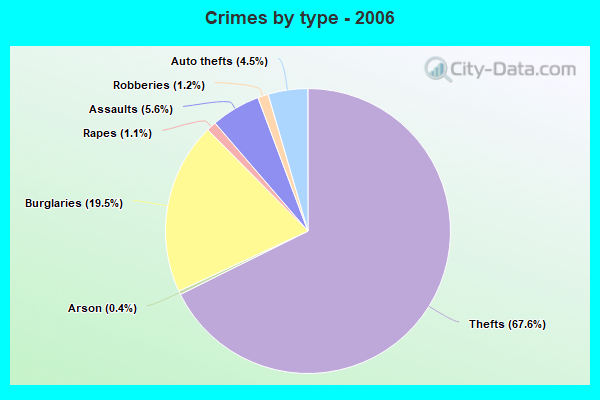
Violent crime rate in 2006
| San Angelo: | 214.7 |
| U.S. Average: | 232.6 |
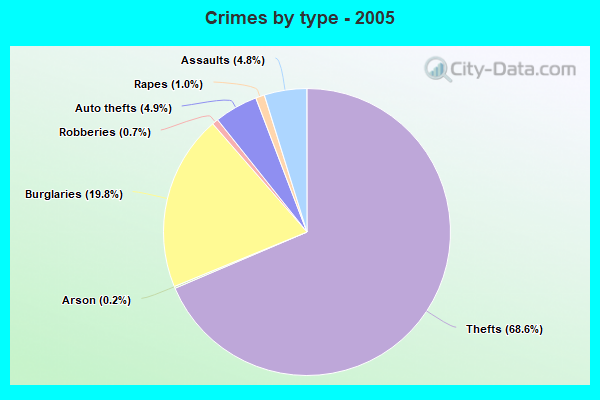
Violent crime rate in 2005
| San Angelo: | 207.2 |
| U.S. Average: | 227.0 |
Property crime rate in 2022
| San Angelo: | 226.0 |
| U.S. Average: | 166.5 |
Property crime rate in 2021
| San Angelo: | 222.8 |
| U.S. Average: | 157.8 |
Property crime rate in 2020
| San Angelo: | 252.0 |
| U.S. Average: | 169.6 |
Property crime rate in 2019
| San Angelo: | 259.3 |
| U.S. Average: | 179.7 |
Property crime rate in 2018
| San Angelo: | 282.7 |
| U.S. Average: | 190.2 |
Property crime rate in 2017
| San Angelo: | 365.9 |
| U.S. Average: | 206.4 |
Property crime rate in 2016
| San Angelo: | 405.1 |
| U.S. Average: | 216.6 |
Property crime rate in 2015
| San Angelo: | 346.6 |
| U.S. Average: | 221.5 |
Property crime rate in 2014
| San Angelo: | 345.5 |
| U.S. Average: | 230.8 |
Property crime rate in 2013
| San Angelo: | 316.3 |
| U.S. Average: | 250.4 |
Property crime rate in 2012
| San Angelo: | 312.4 |
| U.S. Average: | 267.3 |
Property crime rate in 2011
| San Angelo: | 336.5 |
| U.S. Average: | 273.5 |
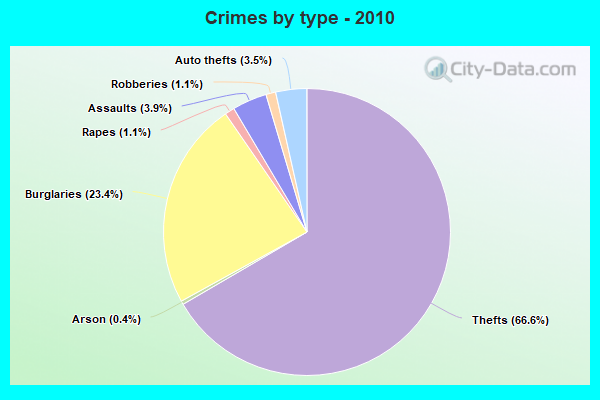
Property crime rate in 2010
| San Angelo: | 414.8 |
| U.S. Average: | 276.4 |
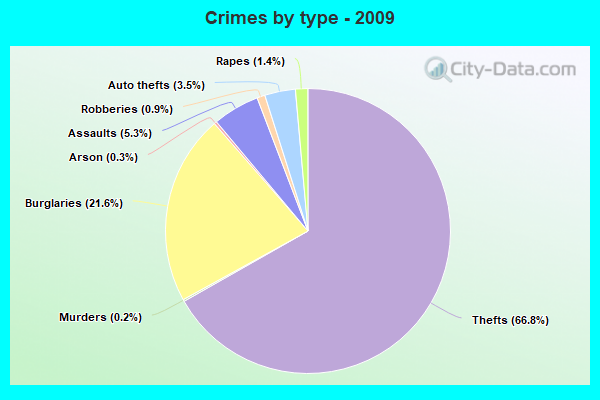
Property crime rate in 2009
| San Angelo: | 414.2 |
| U.S. Average: | 285.6 |
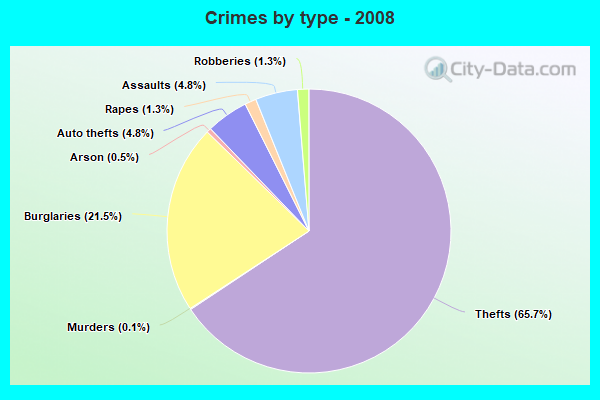
Property crime rate in 2008
| San Angelo: | 450.8 |
| U.S. Average: | 302.2 |
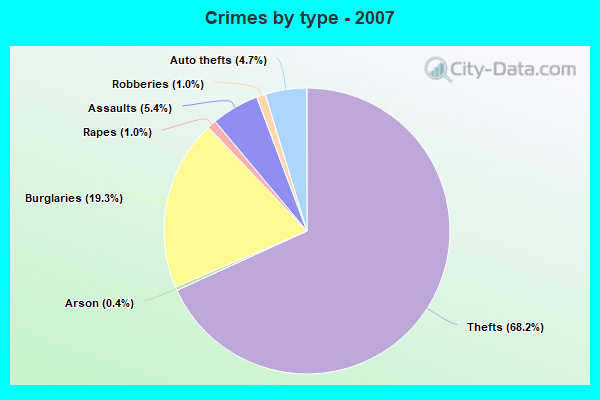
Property crime rate in 2007
| San Angelo: | 375.7 |
| U.S. Average: | 309.2 |
Property crime rate in 2006
| San Angelo: | 369.2 |
| U.S. Average: | 317.3 |
Property crime rate in 2005
| San Angelo: | 439.6 |
| U.S. Average: | 322.3 |
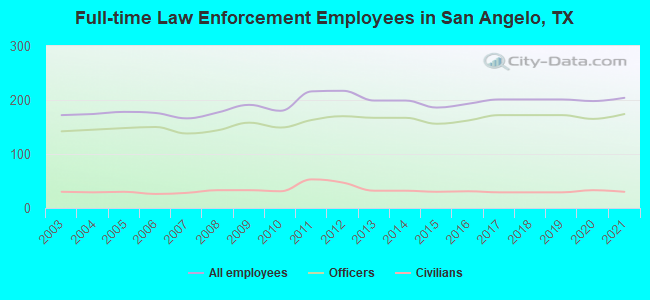
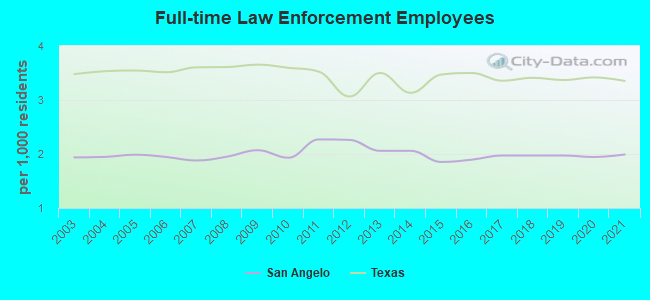
Full-time law enforcement employees in 2021, including police officers: 204 (174 officers - 155 male; 19 female).
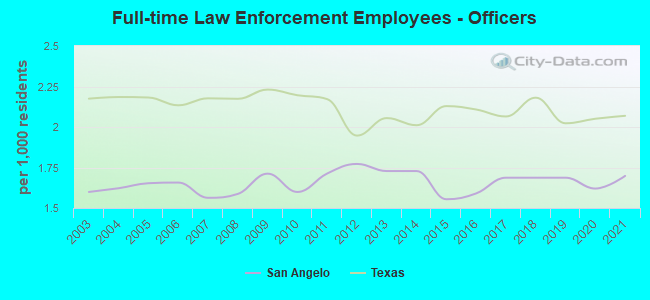
| Officers per 1,000 residents here: | 1.70 |
| Texas average: | 2.07 |
Full-time law enforcement employees in 2020, including police officers: 198 (165 officers - 149 male; 16 female).
| Officers per 1,000 residents here: | 1.62 |
| Texas average: | 2.05 |
Full-time law enforcement employees in 2017, including police officers: 201 (172 officers - 157 male; 15 female).
| Officers per 1,000 residents here: | 1.69 |
| Texas average: | 2.06 |
Full-time law enforcement employees in 2016, including police officers: 193 (162 officers - 148 male; 14 female).
| Officers per 1,000 residents here: | 1.59 |
| Texas average: | 2.11 |
Full-time law enforcement employees in 2015, including police officers: 186 (156 officers - 143 male; 13 female).
| Officers per 1,000 residents here: | 1.55 |
| Texas average: | 2.13 |
Full-time law enforcement employees in 2013, including police officers: 199 (167 officers - 152 male; 15 female).
| Officers per 1,000 residents here: | 1.73 |
| Texas average: | 2.05 |
Full-time law enforcement employees in 2012, including police officers: 217 (170 officers - 153 male; 17 female).
| Officers per 1,000 residents here: | 1.77 |
| Texas average: | 1.95 |
Full-time law enforcement employees in 2011, including police officers: 216 (163 officers - 147 male; 16 female).
| Officers per 1,000 residents here: | 1.71 |
| Texas average: | 2.17 |
Full-time law enforcement employees in 2010, including police officers: 180 (149 officers - 134 male; 15 female).
| Officers per 1,000 residents here: | 1.60 |
| Texas average: | 2.20 |
Full-time law enforcement employees in 2009, including police officers: 191 (158 officers - 142 male; 16 female).
| Officers per 1,000 residents here: | 1.71 |
| Texas average: | 2.23 |
Full-time law enforcement employees in 2008, including police officers: 177 (144 officers - 131 male; 13 female).
| Officers per 1,000 residents here: | 1.59 |
| Texas average: | 2.17 |
Full-time law enforcement employees in 2007, including police officers: 166 (138 officers - 124 male; 14 female).
| Officers per 1,000 residents here: | 1.56 |
| Texas average: | 2.18 |
Full-time law enforcement employees in 2006, including police officers: 176 (150 officers - 134 male; 16 female).
| Officers per 1,000 residents here: | 1.66 |
| Texas average: | 2.13 |
Full-time law enforcement employees in 2005, including police officers: 178 (148 officers - 132 male; 16 female).
| Officers per 1,000 residents here: | 1.65 |
| Texas average: | 2.18 |
Full-time law enforcement employees in 2004, including police officers: 174 (145 officers - 132 male; 13 female).
| Officers per 1,000 residents here: | 1.62 |
| Texas average: | 2.19 |
Full-time law enforcement employees in 2003, including police officers: 172 (142 officers - 129 male; 13 female).
| Officers per 1,000 residents here: | 1.60 |
| Texas average: | 2.17 |