Jackson: Fire Incidents, Michigan (MI)
Where are fire incidents reported in Jackson, MI
Something went wrong! Please refresh the page.
| Fire incidents reported | |
|---|---|
| Sreet name | Count |
| MICHIGAN AVE | 342 |
| FRANCIS ST | 236 |
| LANSING AVE | 198 |
| MICHIGAN | 156 |
| GANSON ST | 154 |
| PAGE AVE | 152 |
| HIGH ST | 118 |
| FRANKLIN ST | 114 |
| WEST AVE | 110 |
| JACKSON ST | 108 |
| JACKSON | 102 |
| FRANCIS | 100 |
| FIRST ST | 98 |
| FOURTH ST | 90 |
| CLINTON RD | 88 |
| GANSON | 88 |
| STEWARD AVE | 86 |
| COOPER ST | 84 |
| STEWARD | 84 |
| SOUTH ST | 80 |
| MORRELL ST | 78 |
| NORTH ST | 78 |
| BLACKSTONE ST | 76 |
| SECOND ST | 74 |
| MASON ST | 72 |
| VAN BUREN ST | 72 |
| ELM | 66 |
| BLACKSTONE | 64 |
| MORRELL | 64 |
| COOPER | 62 |
| Other | 4,684 |
2002 - 2018 National Fire Incident Reporting System (NFIRS) incidents
- Incident types reported to NFIRS in Jackson, MI
- 36,62860.7%Rescue & EMS
- 7,97813.2%Fire
- 5,2398.7%Good Intent Call
- 4,8558.0%Hazardous Condition
- 2,8684.8%Service Call
- 2,3924.0%False Alarm
- 2770.5%Special Incident
- 770.1%Overpressure Rupture
- Fire incident types reported to NFIRS in Jackson, MI
- 4,85660.9%Structure Fires
- 1,48718.6%Outside Fires
- 1,03012.9%Mobile Property/Vehicle Fires
- 6057.6%Other
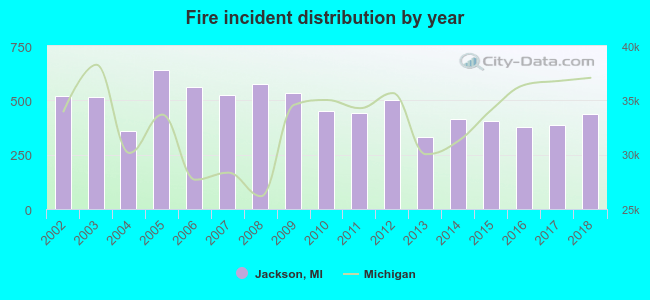 According to the data from the years 2002 - 2018 the average number of fires per year is 469. The highest number of fire incidents - 641 took place in 2005, and the least - 331 in 2013. The data has a decreasing trend.
The average number of yearly fire incidents per 10k residents in Jackson, MI compared to nearest cities:
(Note: Based on data for the last 3 years, including only cities with population 5,000 and above)
| Jackson: | 120.5 |
| Albion: | 93.5 |
| Chelsea: | 85.7 |
| Eaton Rapids: | 87.5 |
| Mason: | 101.8 |
| Hillsdale: | 35.2 |
| Holt: | 21.0 |
| Marshall: | 75.8 |
| Tecumseh: | 26.2 |
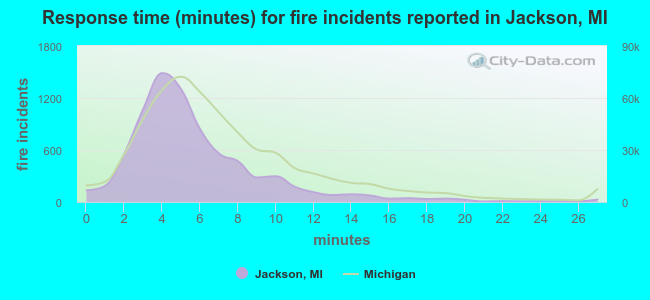 The median response time based on all reported fire incidents is 5 minutes. This is lower than the Michigan median value.
The median response time in Jackson, MI compared to nearest cities:
(Note: Based on data for all years, including only cities with at least 500 fire incidents)
| Jackson: | 5 minutes |
| Parma: | 10 minutes |
| Brooklyn: | 8 minutes |
| Albion: | 5 minutes |
| Onsted: | 11 minutes |
| Manchester: | 11 minutes |
| Chelsea: | 8 minutes |
| Eaton Rapids: | 10 minutes |
| Mason: | 8 minutes |
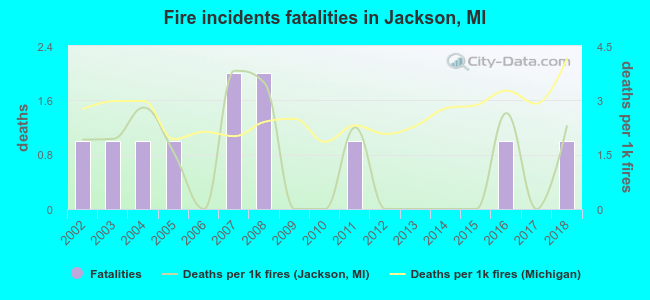 Based on the data from the years 2002 - 2018 the average number of fire-related fatalities per year is 1. The highest number of reported deaths - 2 took place in 2007, and the lowest - 0 in 2006. The data has a constant trend.
The average number of deaths per 1,000 fire incidents is 1. This indicator was the highest - 4 in 2007, and the lowest 0 in 2006. The trend for fatalities per 1,000 incidents is rising. Compared to the Michigan value the number of fatalities per 1,000 fire incidents is lower.
Based on the data from the years 2002 - 2018 the average number of fire-related fatalities per year is 1. The highest number of reported deaths - 2 took place in 2007, and the lowest - 0 in 2006. The data has a constant trend.
The average number of deaths per 1,000 fire incidents is 1. This indicator was the highest - 4 in 2007, and the lowest 0 in 2006. The trend for fatalities per 1,000 incidents is rising. Compared to the Michigan value the number of fatalities per 1,000 fire incidents is lower.
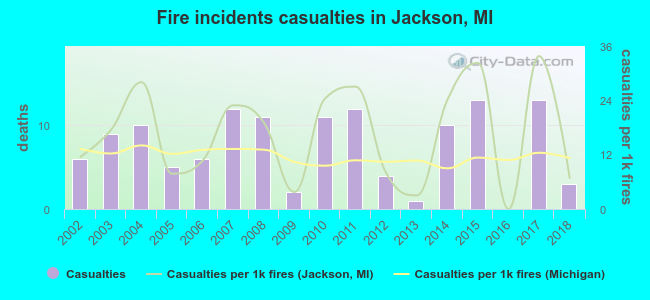 According to the data from the years 2002 - 2018 the average number of fire-related casualties per year is 8. The highest number of reported casualties - 13 took place in 2015, and the lowest - 0 in 2016. The data has a declining trend.
The average number of casualties per 1,000 fire incidents is 17. This indicator was the highest - 34 in 2017, and the lowest 0 in 2016. The trend for casualties per 1,000 incidents is decreasing. Compared to the Michigan value the number of injuries per 1,000 incidents is higher.
According to the data from the years 2002 - 2018 the average number of fire-related casualties per year is 8. The highest number of reported casualties - 13 took place in 2015, and the lowest - 0 in 2016. The data has a declining trend.
The average number of casualties per 1,000 fire incidents is 17. This indicator was the highest - 34 in 2017, and the lowest 0 in 2016. The trend for casualties per 1,000 incidents is decreasing. Compared to the Michigan value the number of injuries per 1,000 incidents is higher.Casualties per 1,000 incidents in Jackson, MI compared to nearest cities:
(Note: Based on data for all years, including only cities with at least 500 fire incidents)
| Jackson: | 16.0 |
| Parma: | 3.8 |
| Brooklyn: | 16.4 |
| Albion: | 8.8 |
| Onsted: | 3.8 |
| Manchester: | 6.2 |
| Chelsea: | 2.8 |
| Eaton Rapids: | 11.1 |
| Mason: | 1.3 |
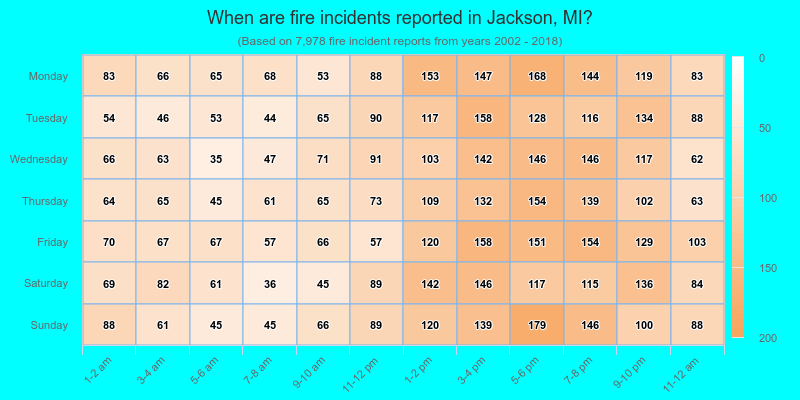
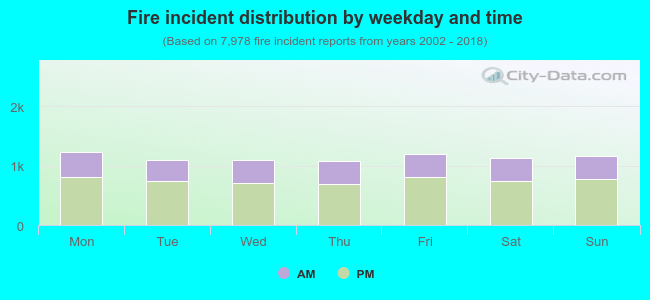 33.6% incidents where reported in the morning and 66.4% in the evening. The most fires (15.5%) took place on Monday, and the least (13.4%) on Thursday.
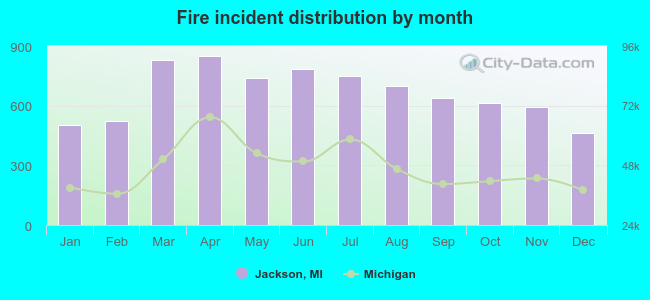 According to the 7,978 fire incident reports from years 2002 - 2018 most fires (10.6%) took place during April, and the least (5.8%) in December.
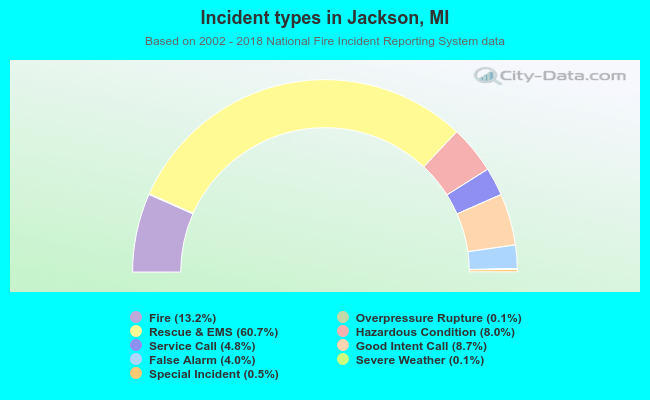 Out of all 60,356 cases reported during the years 2002 - 2018, the most belonged to the categories: Rescue & EMS (60.7%), Fire (13.2%), and Good Intent Call (8.7%).
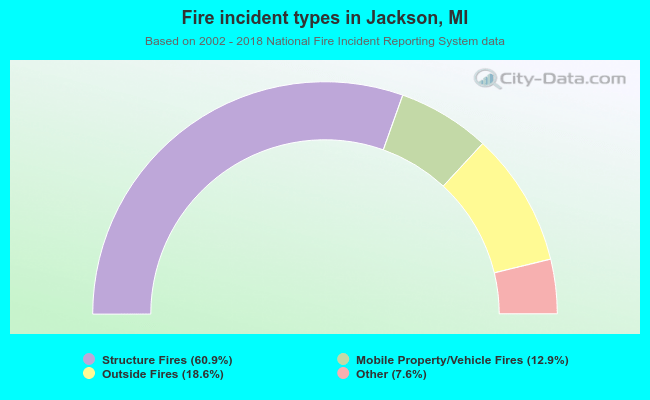 When looking into fire subcategories, the most incidents belonged to: Structure Fires (60.9%), and Outside Fires (18.6%).