Carrboro: Fire Incidents, North Carolina (NC)
Where are fire incidents reported in Carrboro, NC
Something went wrong! Please refresh the page.
| Fire incidents reported | |
|---|---|
| Sreet name | Count |
| JONES FERRY RD | 176 |
| JONES FERRY (CITY) RD | 124 |
| HWY 54 BYP | 116 |
| MAIN ST | 100 |
| HWY 54 (CITY) BYP | 90 |
| NC 54 | 74 |
| BPW CLUB RD | 68 |
| POPLAR AVE | 68 |
| HWY 54 BYPASS (CITY) | 66 |
| GREENSBORO ST | 64 |
| ESTES DR | 54 |
| ROCK HAVEN RD | 48 |
| SMITH LEVEL RD | 46 |
| BARNES ST | 38 |
| HWY 54 WEST | 28 |
| NC 54 HWY | 28 |
| OLD FAYETTVILLE RD | 28 |
| MERRITT MILL RD | 26 |
| SMITH LEVEL (CITY) RD | 26 |
| JONES FERRY RD. (CITY) | 24 |
| DAVIE RD | 22 |
| HILLSBOROUGH RD | 22 |
| HWY 54 WEST HWY | 22 |
| FIDELITY ST | 18 |
| FRIAR LN | 18 |
| GREENSBORO (OUTLINE) ST | 18 |
| OLD FAYETTEVILLE RD | 18 |
| CAROL ST | 16 |
| HOMESTEAD RD | 16 |
| LAUREL AVE | 16 |
2002 - 2018 National Fire Incident Reporting System (NFIRS) incidents
- Incident types reported to NFIRS in Carrboro, NC
- 4,66650.8%Rescue & EMS
- 1,31514.3%Fire
- 1,17912.8%Hazardous Condition
- 92310.0%Good Intent Call
- 6517.1%False Alarm
- 3744.1%Service Call
- 340.4%Severe Weather
- 330.4%Special Incident
- 120.1%Overpressure Rupture
- Fire incident types reported to NFIRS in Carrboro, NC
- 68652.2%Structure Fires
- 41931.9%Outside Fires
- 1289.7%Mobile Property/Vehicle Fires
- 826.2%Other
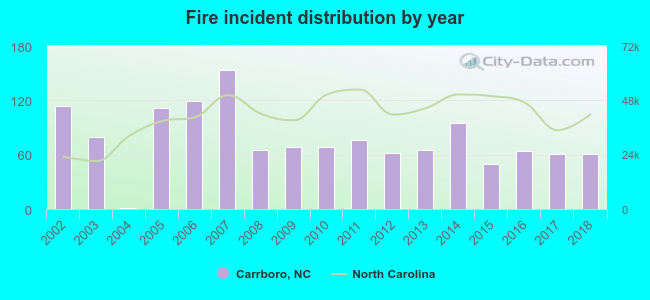 According to the data from the years 2002 - 2018 the average number of fires per year is 77. The highest number of fires - 153 took place in 2007, and the least - 1 in 2004. The data has a decreasing trend.
The average number of yearly fire incidents per 10k residents in Carrboro, NC compared to nearest cities:
(Note: Based on data for the last 3 years, including only cities with population 5,000 and above)
| Carrboro: | 29.5 |
| Chapel Hill: | 39.1 |
| Hillsborough: | 146.6 |
| Durham: | 32.5 |
| Morrisville: | 25.0 |
| Mebane: | 102.7 |
| Apex: | 26.2 |
| Cary: | 16.8 |
| Graham: | 45.8 |
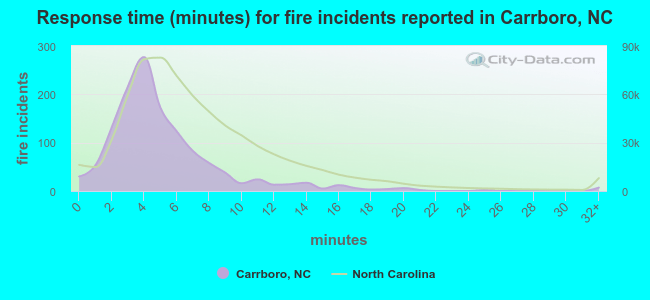 The median response time based on all reported fire incidents is 4 minutes. This is lower compared to the North Carolina median value.
The median response time in Carrboro, NC compared to nearest cities:
(Note: Based on data for all years, including only cities with at least 500 fire incidents)
| Carrboro: | 4 minutes |
| Chapel Hill: | 5 minutes |
| Hillsborough: | 8 minutes |
| Durham: | 5 minutes |
| Pittsboro: | 8 minutes |
| Morrisville: | 6 minutes |
| Mebane: | 7 minutes |
| Apex: | 6 minutes |
| Cary: | 5 minutes |
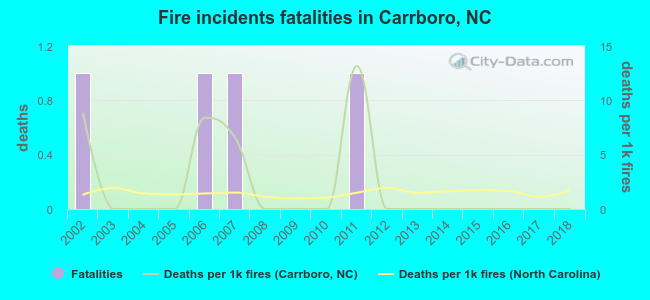 According to the data from the years 2002 - 2018 the average number of fire-related yearly deaths is 0. The highest number of reported deaths - 1 took place in 2002, and the lowest - 0 in 2003. The data has a decreasing trend.
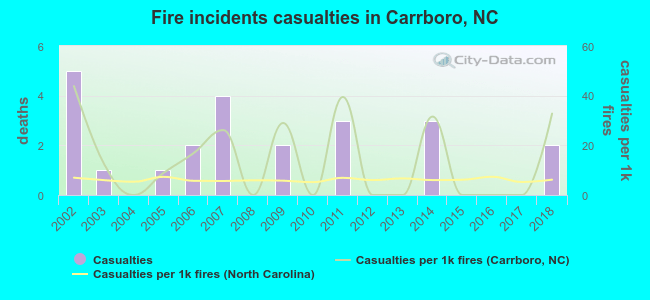 According to the data from the years 2002 - 2018 the average number of fire-related casualties per year is 1. The highest number of reported casualties - 5 took place in 2002, and the lowest - 0 in 2004. The data has a declining trend.
The average number of casualties per 1,000 fires is 14. This indicator was the highest - 44 in 2002, and the lowest 0 in 2004. The trend for injuries per 1,000 fires is dropping. Compared to the state value the number of injuries per 1,000 fires is much higher.
According to the data from the years 2002 - 2018 the average number of fire-related casualties per year is 1. The highest number of reported casualties - 5 took place in 2002, and the lowest - 0 in 2004. The data has a declining trend.
The average number of casualties per 1,000 fires is 14. This indicator was the highest - 44 in 2002, and the lowest 0 in 2004. The trend for injuries per 1,000 fires is dropping. Compared to the state value the number of injuries per 1,000 fires is much higher.Casualties per 1,000 incidents in Carrboro, NC compared to nearest cities:
(Note: Based on data for all years, including only cities with at least 500 fire incidents)
| Carrboro: | 17.5 |
| Chapel Hill: | 13.5 |
| Hillsborough: | 1.4 |
| Durham: | 6.1 |
| Pittsboro: | 0.7 |
| Morrisville: | 6.8 |
| Mebane: | 8.1 |
| Apex: | 6.6 |
| Cary: | 12.2 |
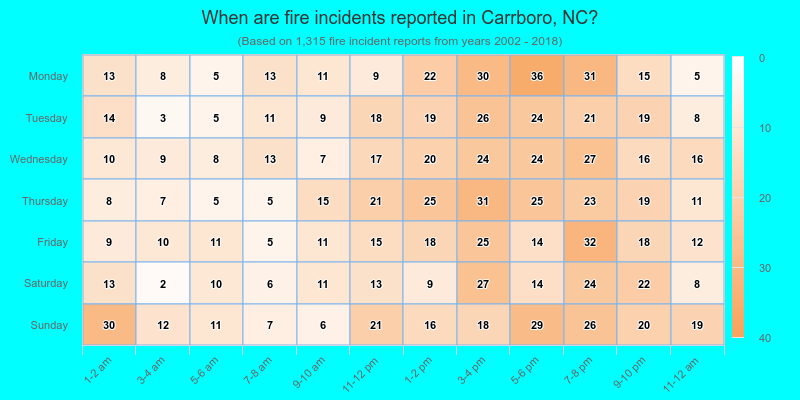
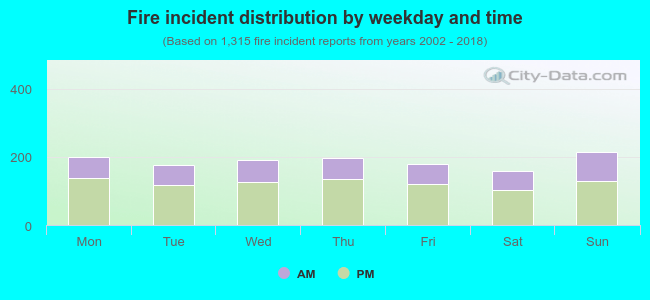 34.0% incidents where reported in the morning and 66.0% in the evening. The most fires (16.3%) took place on Sunday, and the least (12.1%) on Saturday.
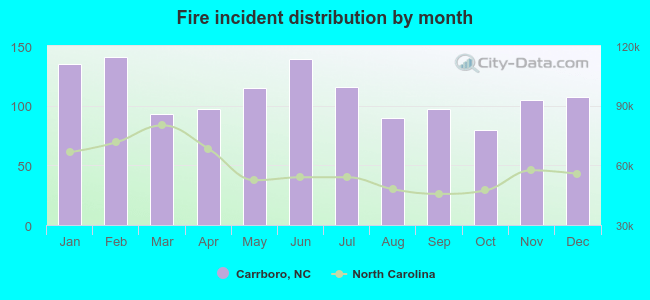 Based on the 1,315 fire incidents from years 2002 - 2018 most fires (10.7%) took place during February, and the least (6.1%) in October.
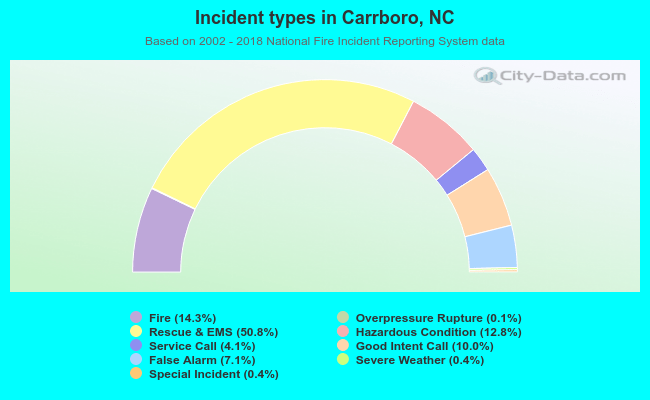 Out of all 9,187 cases reported during the years 2002 - 2018, the most belonged to the categories: Rescue & EMS (50.8%), Fire (14.3%), and Hazardous Condition (12.8%).
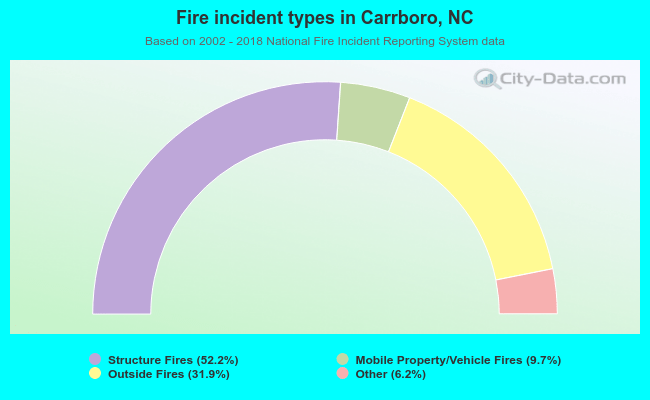 When looking into fire subcategories, the most incidents belonged to: Structure Fires (52.2%), and Outside Fires (31.9%).