Arab: Fire Incidents, Alabama (AL)
Where are fire incidents reported in Arab, AL
Something went wrong! Please refresh the page.
|
| |||||||||||||||||||||||||||||||||||||||||||||||||||||||||||||||||||||||||||||||||||||||||||||||||||||||||||||
2006 - 2018 National Fire Incident Reporting System (NFIRS) incidents
- Incident types reported to NFIRS in Arab, AL
- 1,55849.9%Rescue & EMS
- 78925.3%Fire
- 43013.8%Good Intent Call
- 1565.0%Hazardous Condition
- 752.4%False Alarm
- 732.3%Service Call
- 301.0%Special Incident
- 80.3%Severe Weather
- Fire incident types reported to NFIRS in Arab, AL
- 34844.1%Structure Fires
- 30038.0%Outside Fires
- 789.9%Mobile Property/Vehicle Fires
- 638.0%Other
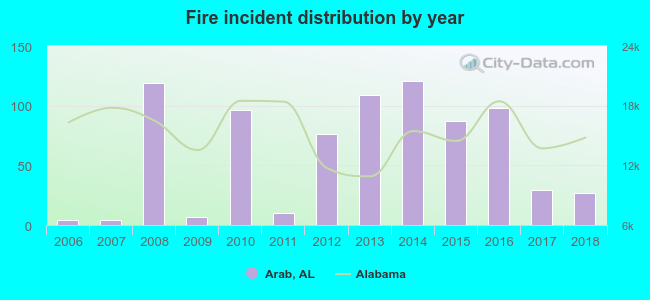 Based on the data from the years 2006 - 2018 the average number of fire incidents per year is 61. The highest number of fires - 121 took place in 2014, and the least - 4 in 2006. The data has an increasing trend.
The average number of yearly fire incidents per 10k residents in Arab, AL compared to nearest cities:
(Note: Based on data for the last 3 years, including only cities with population 5,000 and above)
| Arab: | 62.0 |
| Guntersville: | 119.2 |
| Albertville: | 115.0 |
| Boaz: | 86.4 |
| Cullman: | 83.0 |
| Vinemont: | 79.9 |
| Hartselle: | 31.6 |
| Oneonta: | 108.6 |
| Huntsville: | 42.6 |
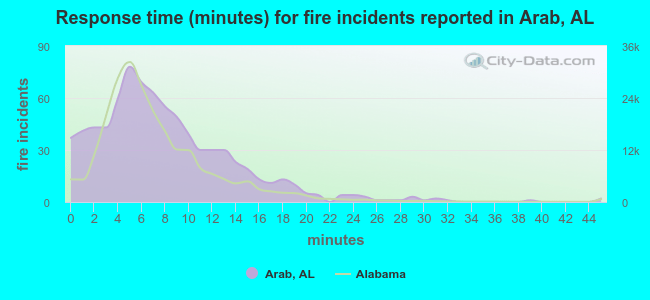 The median response time based on all reported fire incidents is 7 minutes. This is about the same as the state median value.
The median response time in Arab, AL compared to nearest cities:
(Note: Based on data for all years, including only cities with at least 500 fire incidents)
| Arab: | 7 minutes |
| Guntersville: | 6 minutes |
| Albertville: | 5 minutes |
| Blountsville: | 12 minutes |
| Boaz: | 6 minutes |
| Cullman: | 7 minutes |
| Altoona: | 12 minutes |
| Vinemont: | 8 minutes |
| Hartselle: | 5 minutes |
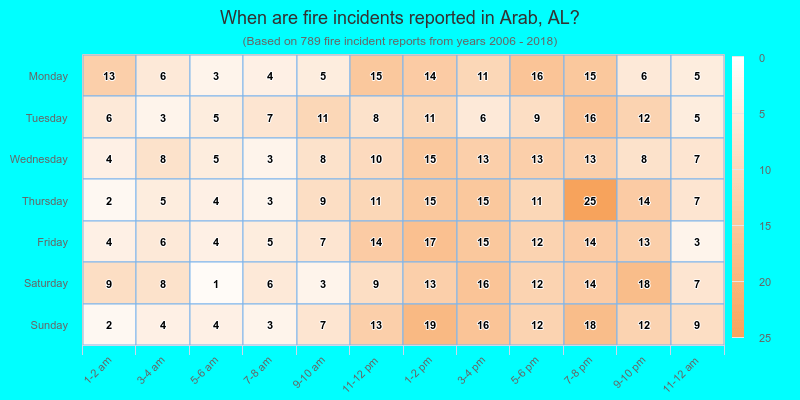
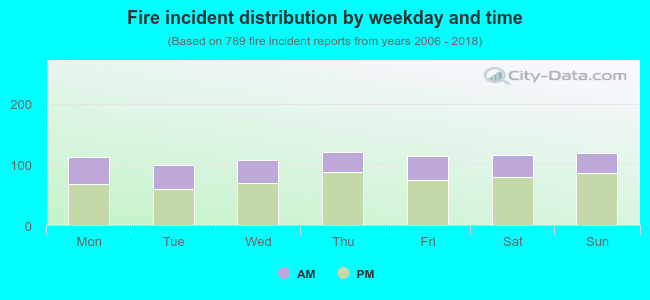 33.8% incidents where reported in the morning and 66.2% in the evening. The most fires (15.3%) took place on Thursday, and the least (12.5%) on Tuesday.
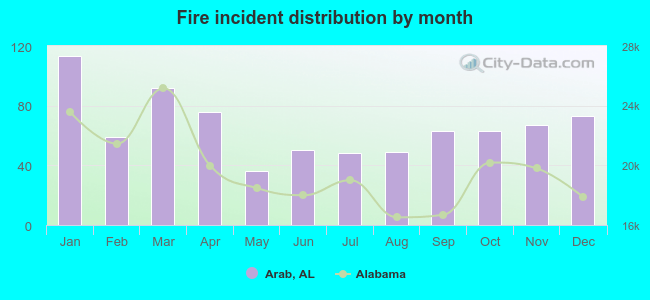 Based on the 789 fire incident reports from years 2006 - 2018 most fires (14.3%) took place during January, and the least (4.6%) in May.
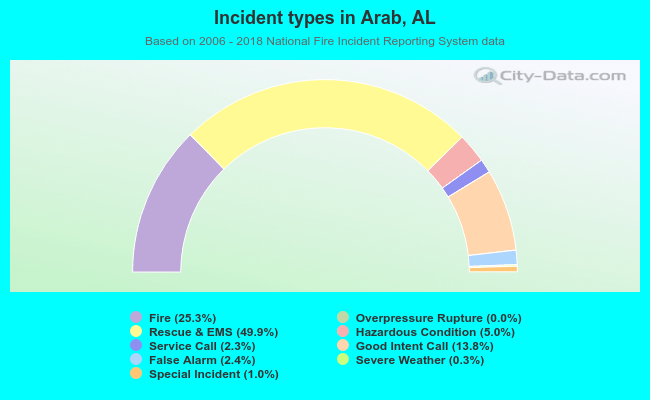 Out of all 3,120 cases reported during the years 2006 - 2018, the most belonged to the categories: Rescue & EMS (49.9%), Fire (25.3%), and Good Intent Call (13.8%).
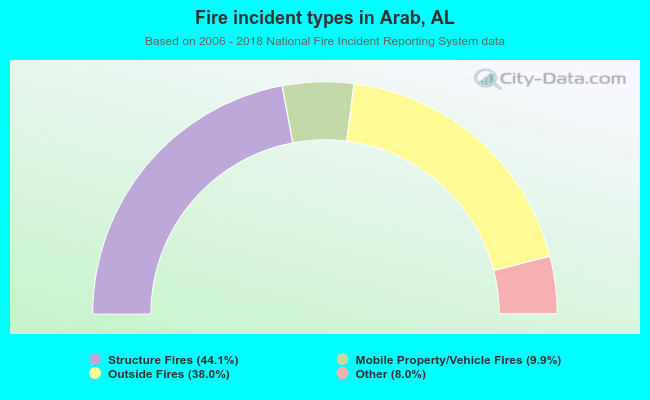 When looking into fire subcategories, the most incidents belonged to: Structure Fires (44.1%), and Outside Fires (38.0%).