Huntsville: Fire Incidents, Alabama (AL)
Where are fire incidents reported in Huntsville, AL
Something went wrong! Please refresh the page.
| Fire incidents reported | |
|---|---|
| Sreet name | Count |
| MEMORIAL PKY | 2,623 |
| UNIVERSITY DR | 1,749 |
| SPARKMAN DR | 943 |
| INTERSTATE 565 | 821 |
| GOVERNORS DR | 617 |
| MERIDIAN ST | 515 |
| DRAKE AVE | 510 |
| BOB WALLACE AVE | 489 |
| OAKWOOD AVE | 476 |
| JORDAN LN | 444 |
| GREENE ST | 420 |
| WINCHESTER RD | 416 |
| BLUE SPRING RD | 412 |
| SEMINOLE DR | 402 |
| PATTON RD | 397 |
| HOLMES AVE | 396 |
| WHITESBURG DR | 386 |
| MASTIN LAKE RD | 378 |
| CLINTON AVE | 362 |
| TRIANA BLV | 361 |
| BONNELL DR | 345 |
| PULASKI PIKE | 343 |
| HIGHWAY 72 EAST | 325 |
| NEWSON RD | 314 |
| NINTH AVE | 274 |
| MASON CT | 262 |
| OLD MONROVIA RD | 260 |
| HIGHWAY 53 | 238 |
| JOHNSON RD | 234 |
| OLD MADISON PKE | 231 |
2002 - 2018 National Fire Incident Reporting System (NFIRS) incidents
- Incident types reported to NFIRS in Huntsville, AL
- 53,00852.4%Rescue & EMS
- 13,51013.4%False Alarm
- 12,94412.8%Fire
- 11,83911.7%Good Intent Call
- 7,6057.5%Hazardous Condition
- 1,8791.9%Service Call
- 1560.2%Special Incident
- 1370.1%Overpressure Rupture
- Fire incident types reported to NFIRS in Huntsville, AL
- 5,28240.8%Outside Fires
- 4,10131.7%Structure Fires
- 2,62320.3%Mobile Property/Vehicle Fires
- 9387.2%Other
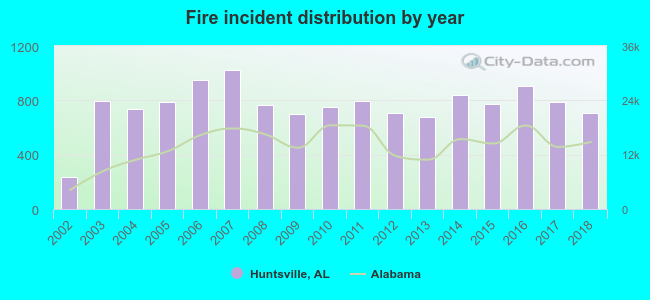 Based on the data from the years 2002 - 2018 the average number of fires per year is 761. The highest number of fires - 1,022 took place in 2007, and the least - 238 in 2002. The data has a growing trend.
The average number of yearly fire incidents per 10k residents in Huntsville, AL compared to nearest cities:
(Note: Based on data for the last 3 years, including only cities with population 5,000 and above)
| Huntsville: | 42.6 |
| Madison: | 15.0 |
| Meridianville: | 14.9 |
| Harvest: | 30.9 |
| Athens: | 38.1 |
| Decatur: | 46.8 |
| Hartselle: | 31.6 |
| Arab: | 62.0 |
| Guntersville: | 119.2 |
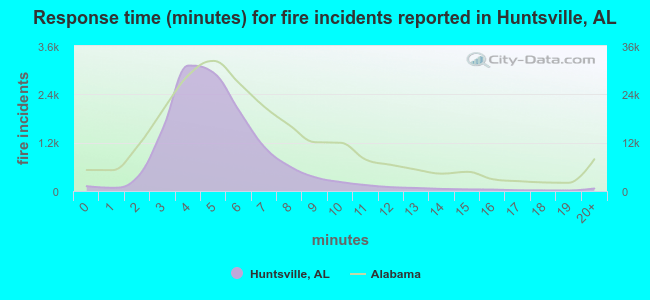 The median response time based on all reported fire incidents is 5 minutes. This is lower than the state median value.
The median response time in Huntsville, AL compared to nearest cities:
(Note: Based on data for all years, including only cities with at least 500 fire incidents)
| Huntsville: | 5 minutes |
| Madison: | 5 minutes |
| Athens: | 4 minutes |
| Decatur: | 5 minutes |
| Hartselle: | 5 minutes |
| Arab: | 7 minutes |
| Guntersville: | 6 minutes |
| Scottsboro: | 5 minutes |
| Vinemont: | 8 minutes |
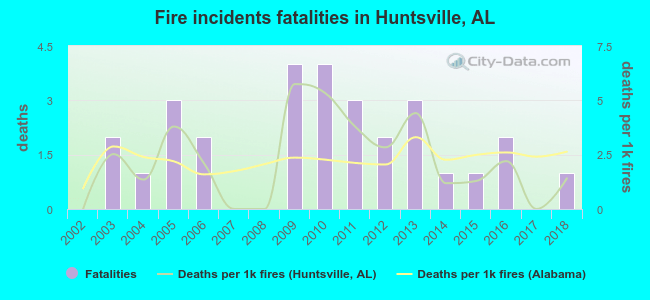 According to the reports from the years 2002 - 2018 the average number of fire-related fatalities per year is 2. The highest number of deaths - 4 took place in 2009, and the lowest - 0 in 2002. The data has an increasing trend.
The average number of fatalities per 1,000 fires is 2. This indicator was the highest - 6 in 2009, and the lowest 0 in 2002. The trend for fatalities per 1,000 fires is increasing. Compared to the state value the number of fatalities per 1,000 fires is similar.
According to the reports from the years 2002 - 2018 the average number of fire-related fatalities per year is 2. The highest number of deaths - 4 took place in 2009, and the lowest - 0 in 2002. The data has an increasing trend.
The average number of fatalities per 1,000 fires is 2. This indicator was the highest - 6 in 2009, and the lowest 0 in 2002. The trend for fatalities per 1,000 fires is increasing. Compared to the state value the number of fatalities per 1,000 fires is similar.Deaths per 1,000 incidents in Huntsville, AL compared to nearest cities:
(Note: Based on data for all years, including only cities with at least 2,500 fire incidents)
| Huntsville: | 2.2 |
| Decatur: | 1.1 |
| Albertville: | 0.0 |
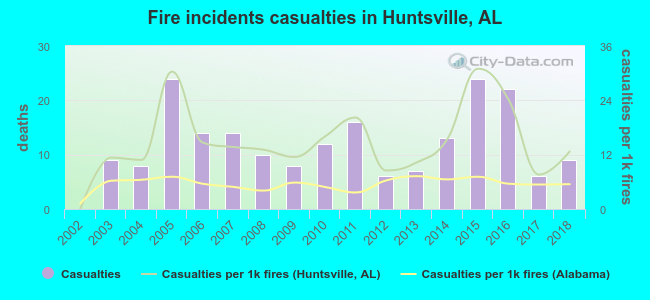 According to the reports from the years 2002 - 2018 the average number of fire-related yearly casualties is 12. The highest number of reported injuries - 24 took place in 2005, and the lowest - 0 in 2002. The data has an increasing trend.
The average number of injuries per 1,000 fires is 15. This indicator was the highest - 31 in 2015, and the lowest 0 in 2002. The trend for injuries per 1,000 incidents is increasing. Compared to the Alabama value the number of casualties per 1,000 incidents is much higher.
According to the reports from the years 2002 - 2018 the average number of fire-related yearly casualties is 12. The highest number of reported injuries - 24 took place in 2005, and the lowest - 0 in 2002. The data has an increasing trend.
The average number of injuries per 1,000 fires is 15. This indicator was the highest - 31 in 2015, and the lowest 0 in 2002. The trend for injuries per 1,000 incidents is increasing. Compared to the Alabama value the number of casualties per 1,000 incidents is much higher.Casualties per 1,000 incidents in Huntsville, AL compared to nearest cities:
(Note: Based on data for all years, including only cities with at least 500 fire incidents)
| Huntsville: | 15.6 |
| Madison: | 2.5 |
| Athens: | 6.9 |
| Decatur: | 2.7 |
| Hartselle: | 0.0 |
| Arab: | 1.3 |
| Guntersville: | 3.8 |
| Scottsboro: | 11.8 |
| Vinemont: | 3.5 |
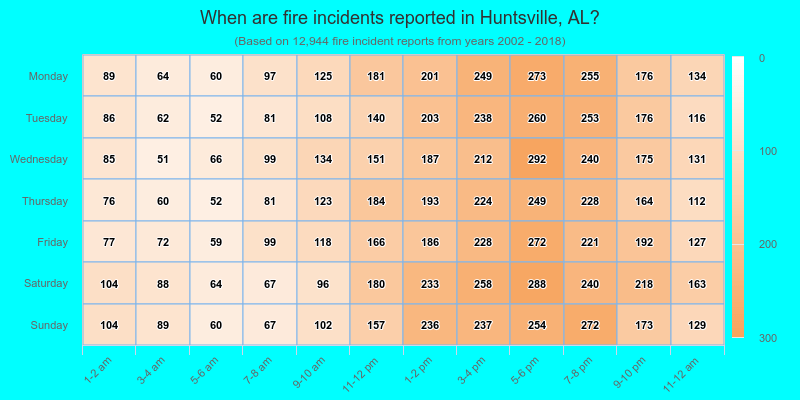
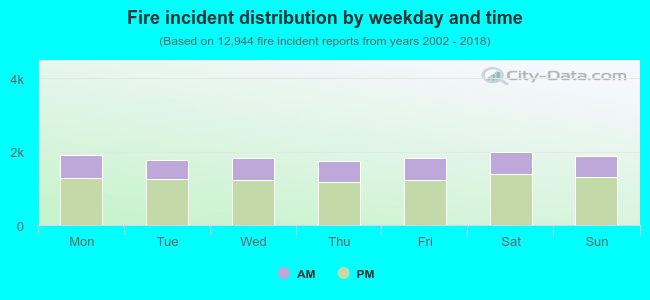 31.5% incidents where reported in the morning and 68.5% in the evening. The most fires (15.4%) took place on Saturday, and the least (13.5%) on Thursday.
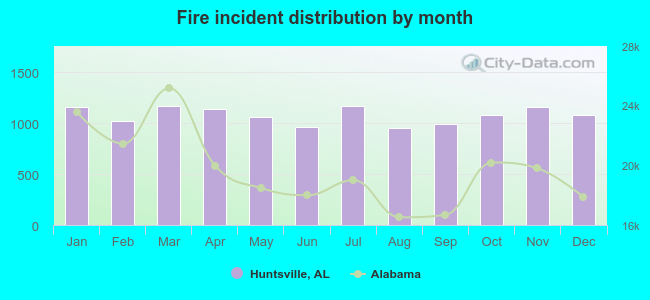 Based on the 12,944 fires from years 2002 - 2018 most fires (9.1%) took place during March, and the least (7.4%) in August.
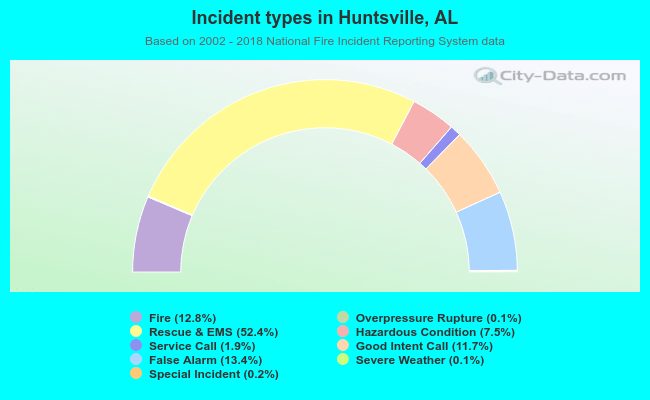 Out of all 101,176 cases reported during the years 2002 - 2018, the most belonged to the categories: Rescue & EMS (52.4%), False Alarm (13.4%), and Fire (12.8%).
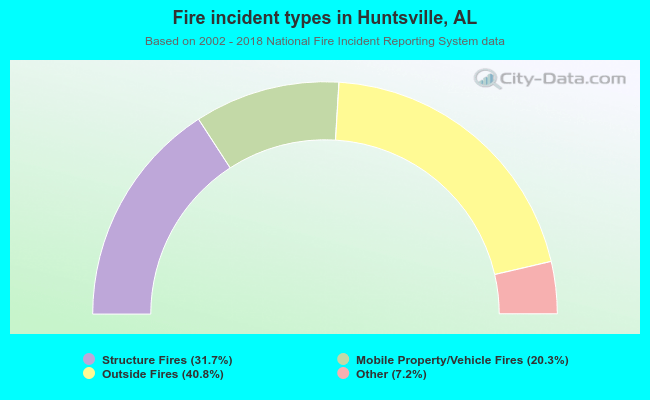 When looking into fire subcategories, the most incidents belonged to: Outside Fires (40.8%), and Structure Fires (31.7%).