Cullman: Fire Incidents, Alabama (AL)
Where are fire incidents reported in Cullman, AL
Something went wrong! Please refresh the page.
| Fire incidents reported | |
|---|---|
| Sreet name | Count |
| 2ND AVE | 286 |
| 157 HWY | 178 |
| 4TH ST | 109 |
| 3RD AVE | 101 |
| 3RD ST | 91 |
| I-65 | 60 |
| CHEROKEE AVE | 55 |
| OLIVE ST | 55 |
| WARNKE RD | 55 |
| 1ST AVE | 48 |
| CR 421 | 48 |
| CR 463 | 47 |
| 4TH AVE | 44 |
| CR 1141 | 43 |
| CR 222 | 42 |
| 5TH AVE | 40 |
| CHILDHAVEN RD | 40 |
| KATHERINE ST | 40 |
| CR 436 | 39 |
| MAIN AVE | 39 |
| MARIE ST | 39 |
| US 278 W | 38 |
| DENSON AVE | 35 |
| MORGAN AVE | 35 |
| 278 HWY | 34 |
| CLEVELAND AVE | 34 |
| CR 1157 | 34 |
| CR 469 | 34 |
| LOGAN AVE | 33 |
| 1545 | 32 |
| Other | 409 |
2004 - 2018 National Fire Incident Reporting System (NFIRS) incidents
- Incident types reported to NFIRS in Cullman, AL
- 8,64256.6%Rescue & EMS
- 2,21714.5%Fire
- 1,61610.6%Good Intent Call
- 1,52410.0%Service Call
- 6364.2%False Alarm
- 5603.7%Hazardous Condition
- 330.2%Severe Weather
- 300.2%Overpressure Rupture
- Fire incident types reported to NFIRS in Cullman, AL
- 1,02646.3%Outside Fires
- 73733.2%Structure Fires
- 33415.1%Mobile Property/Vehicle Fires
- 1205.4%Other
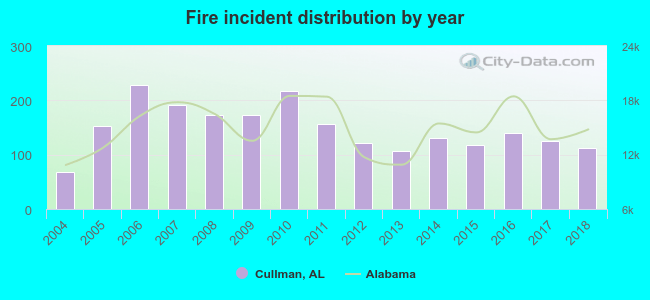 Based on the data from the years 2004 - 2018 the average number of fire incidents per year is 148. The highest number of reported fire incidents - 229 took place in 2006, and the least - 68 in 2004. The data has a rising trend.
The average number of yearly fire incidents per 10k residents in Cullman, AL compared to nearest cities:
(Note: Based on data for the last 3 years, including only cities with population 5,000 and above)
| Cullman: | 83.0 |
| Vinemont: | 79.9 |
| Bremen: | 4.7 |
| Hartselle: | 31.6 |
| Danville: | 1.6 |
| Arab: | 62.0 |
| Oneonta: | 108.6 |
| Decatur: | 46.8 |
| Guntersville: | 119.2 |
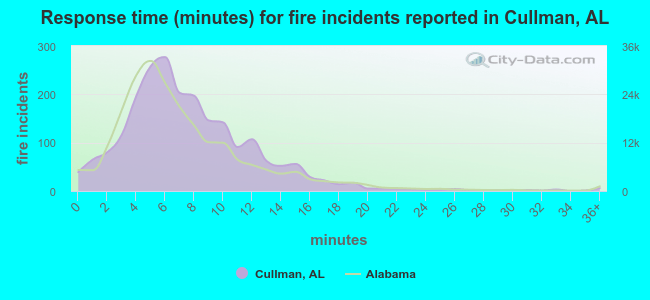 The median response time based on all reported fire incidents is 7 minutes. This is about the same as the state median value.
The median response time in Cullman, AL compared to nearest cities:
(Note: Based on data for all years, including only cities with at least 500 fire incidents)
| Cullman: | 7 minutes |
| Vinemont: | 8 minutes |
| Blountsville: | 12 minutes |
| Hartselle: | 5 minutes |
| Hayden: | 13 minutes |
| Arab: | 7 minutes |
| Oneonta: | 9 minutes |
| Decatur: | 5 minutes |
| Altoona: | 12 minutes |
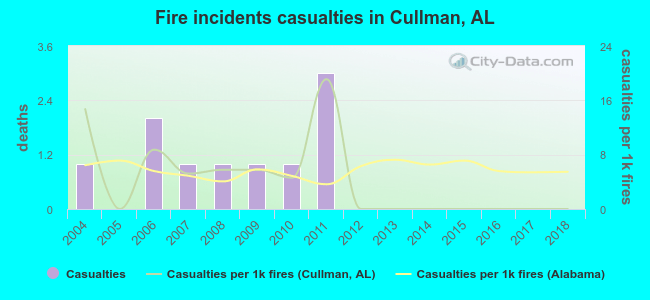 Based on the data from the years 2004 - 2018 the average number of fire-related yearly casualties is 1. The highest number of injuries - 3 took place in 2011, and the lowest - 0 in 2005. The data has a dropping trend.
The average number of injuries per 1,000 fires is 4. This indicator was the highest - 19 in 2011, and the lowest 0 in 2005. The trend for casualties per 1,000 fire incidents is declining. Compared to the Alabama value the number of casualties per 1,000 fires is lower.
Based on the data from the years 2004 - 2018 the average number of fire-related yearly casualties is 1. The highest number of injuries - 3 took place in 2011, and the lowest - 0 in 2005. The data has a dropping trend.
The average number of injuries per 1,000 fires is 4. This indicator was the highest - 19 in 2011, and the lowest 0 in 2005. The trend for casualties per 1,000 fire incidents is declining. Compared to the Alabama value the number of casualties per 1,000 fires is lower.
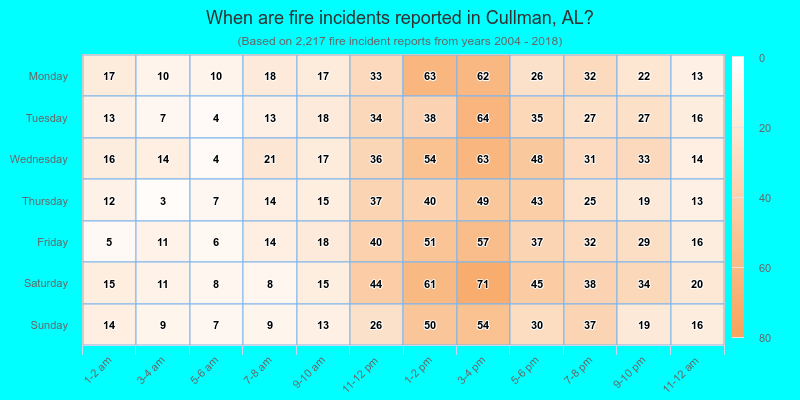
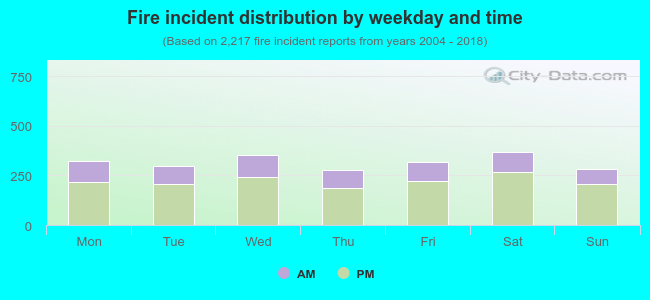 29.9% incidents where reported in the morning and 70.1% in the evening. The most fires (16.7%) took place on Saturday, and the least (12.5%) on Thursday.
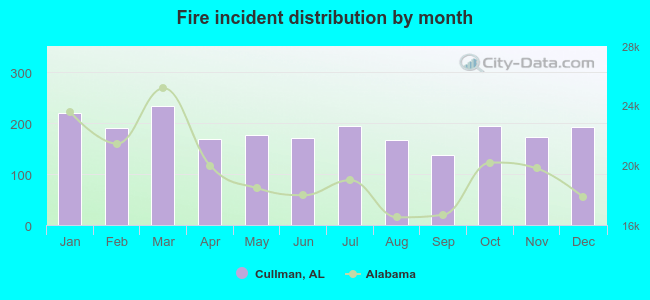 Based on the 2,217 incident reports from years 2004 - 2018 most fires (10.6%) took place during March, and the least (6.2%) in September.
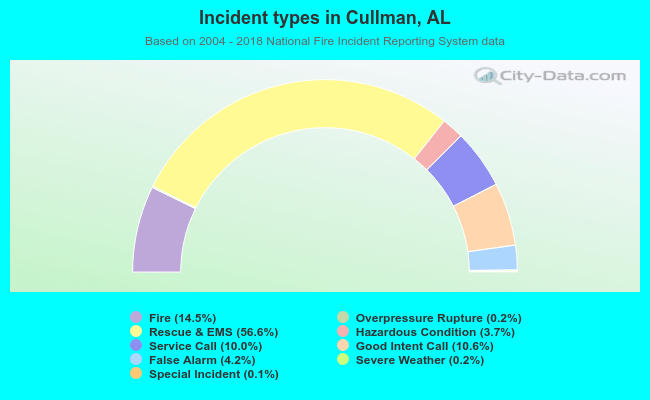 Out of all 15,272 cases reported during the years 2004 - 2018, the most belonged to the categories: Rescue & EMS (56.6%), Fire (14.5%), and Good Intent Call (10.6%).
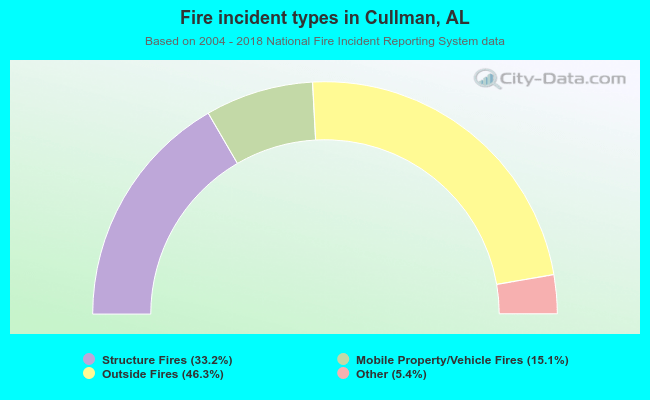 When looking into fire subcategories, the most reports belonged to: Outside Fires (46.3%), and Structure Fires (33.2%).