Arlington: Fire Incidents, Washington (WA)
Where are fire incidents reported in Arlington, WA
Something went wrong! Please refresh the page.
| Fire incidents reported | |
|---|---|
| Sreet name | Count |
| 172 ST | 232 |
| SR 530 | 128 |
| SMOKEY POINT BLVD | 110 |
| SR 530 HWY | 84 |
| BURN RD | 80 |
| JORDAN RD | 78 |
| SR 530 NE HWY | 66 |
| SR 9 | 66 |
| 67TH AVE | 58 |
| 67 AV | 56 |
| 67 AVE | 52 |
| MCELROY RD | 46 |
| 188 ST | 44 |
| 204 ST | 44 |
| 132 ST | 42 |
| 172ND ST | 42 |
| 188TH ST | 42 |
| JIM CREEK RD | 42 |
| GRANDVIEW RD | 40 |
| 200 ST | 38 |
| 59 AVE | 34 |
| WEST AVE | 34 |
| LAKEWOOD RD | 32 |
| 5 ST | 30 |
| SMOKEY POINT DR | 30 |
| WADE RD | 30 |
| 35 AVE | 28 |
| 99 AVE | 28 |
| CROWN RIDGE BLVD | 28 |
| HIGHLAND DR | 28 |
| Other | 1,271 |
2002 - 2018 National Fire Incident Reporting System (NFIRS) incidents
- Incident types reported to NFIRS in Arlington, WA
- 15,51755.1%Rescue & EMS
- 4,63616.5%Good Intent Call
- 2,96310.5%Fire
- 2,5048.9%Service Call
- 1,7396.2%Hazardous Condition
- 6982.5%False Alarm
- 570.2%Special Incident
- Fire incident types reported to NFIRS in Arlington, WA
- 1,14638.7%Structure Fires
- 1,12437.9%Outside Fires
- 44415.0%Mobile Property/Vehicle Fires
- 2498.4%Other
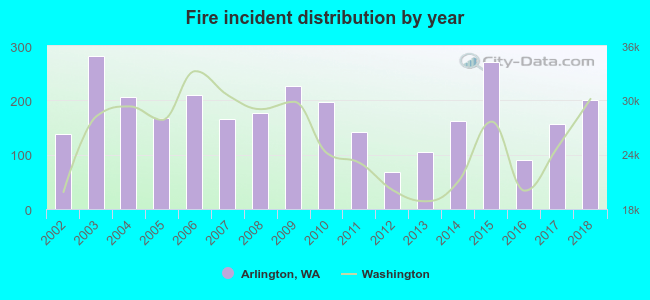 According to the data from the years 2002 - 2018 the average number of fire incidents per year is 174. The highest number of reported fire incidents - 281 took place in 2003, and the least - 68 in 2012. The data has an increasing trend.
The average number of yearly fire incidents per 10k residents in Arlington, WA compared to nearest cities:
(Note: Based on data for the last 3 years, including only cities with population 5,000 and above)
| Arlington: | 79.4 |
| Marysville: | 19.5 |
| Stanwood: | 41.5 |
| Lake Stevens: | 27.2 |
| Everett: | 40.3 |
| Snohomish: | 98.1 |
| Mount Vernon: | 19.3 |
| Mukilteo: | 18.9 |
| Burlington: | 91.4 |
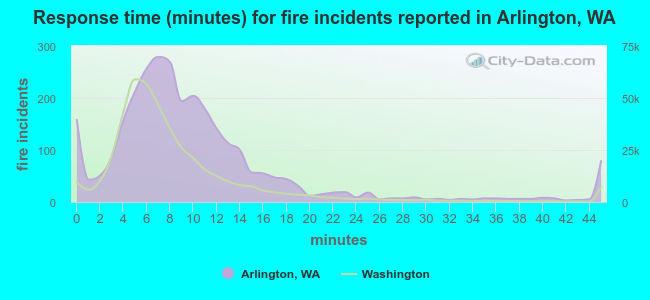 The median response time based on all reported fire incidents is 8 minutes. This is about the same as the Washington median value.
The median response time in Arlington, WA compared to nearest cities:
(Note: Based on data for all years, including only cities with at least 500 fire incidents)
| Arlington: | 8 minutes |
| Marysville: | 7 minutes |
| Granite Falls: | 9 minutes |
| Stanwood: | 8 minutes |
| Lake Stevens: | 8 minutes |
| Everett: | 6 minutes |
| Snohomish: | 8 minutes |
| Mount Vernon: | 7 minutes |
| Mukilteo: | 6 minutes |
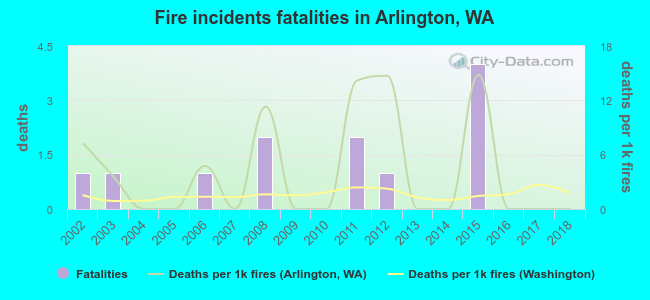 Based on the data from the years 2002 - 2018 the average number of fire-related fatalities per year is 1. The highest number of deaths - 4 took place in 2015, and the lowest - 0 in 2004. The data has a decreasing trend.
The average number of fatalities per 1,000 fire incidents is 4. This indicator was the highest - 15 in 2015, and the lowest 0 in 2004. The trend for fatalities per 1,000 incidents is dropping. Compared to the state value the number of deaths per 1,000 fires is much higher.
Based on the data from the years 2002 - 2018 the average number of fire-related fatalities per year is 1. The highest number of deaths - 4 took place in 2015, and the lowest - 0 in 2004. The data has a decreasing trend.
The average number of fatalities per 1,000 fire incidents is 4. This indicator was the highest - 15 in 2015, and the lowest 0 in 2004. The trend for fatalities per 1,000 incidents is dropping. Compared to the state value the number of deaths per 1,000 fires is much higher.Deaths per 1,000 incidents in Arlington, WA compared to nearest cities:
(Note: Based on data for all years, including only cities with at least 2,500 fire incidents)
| Arlington: | 4.0 |
| Marysville: | 0.8 |
| Everett: | 1.7 |
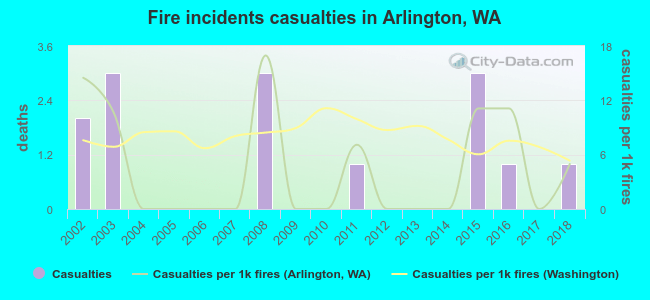 Based on the reports from the years 2002 - 2018 the average number of fire-related yearly casualties is 1. The highest number of reported casualties - 3 took place in 2003, and the lowest - 0 in 2004. The data has a declining trend.
The average number of injuries per 1,000 fires is 4. This indicator was the highest - 17 in 2008, and the lowest 0 in 2004. The trend for casualties per 1,000 fires is decreasing. Compared to the state value the number of casualties per 1,000 fires is lower.
Based on the reports from the years 2002 - 2018 the average number of fire-related yearly casualties is 1. The highest number of reported casualties - 3 took place in 2003, and the lowest - 0 in 2004. The data has a declining trend.
The average number of injuries per 1,000 fires is 4. This indicator was the highest - 17 in 2008, and the lowest 0 in 2004. The trend for casualties per 1,000 fires is decreasing. Compared to the state value the number of casualties per 1,000 fires is lower.Casualties per 1,000 incidents in Arlington, WA compared to nearest cities:
(Note: Based on data for all years, including only cities with at least 500 fire incidents)
| Arlington: | 4.7 |
| Marysville: | 7.1 |
| Granite Falls: | 6.0 |
| Stanwood: | 0.5 |
| Lake Stevens: | 9.5 |
| Everett: | 15.0 |
| Snohomish: | 3.4 |
| Mount Vernon: | 4.3 |
| Mukilteo: | 19.2 |
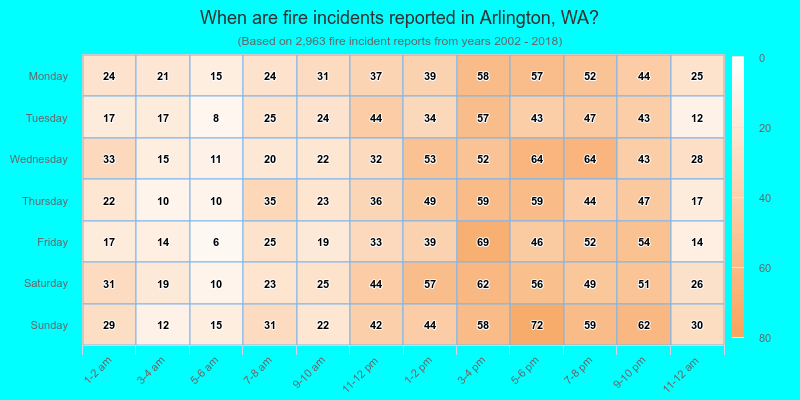
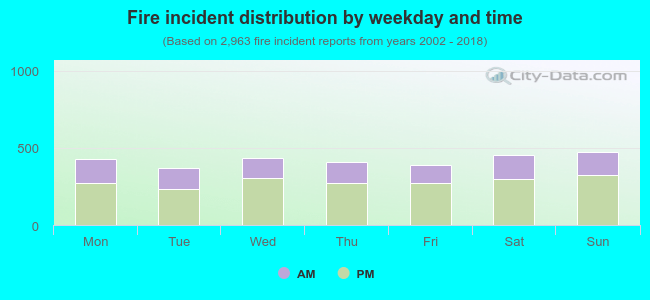 32.8% incidents where reported in the morning and 67.2% in the evening. The most fires (16.1%) took place on Sunday, and the least (12.5%) on Tuesday.
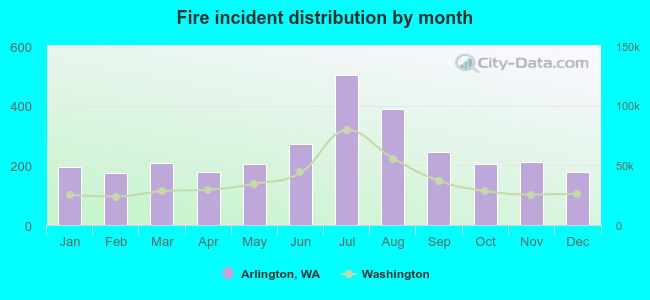 According to the 2,963 incident reports from years 2002 - 2018 most fires (17.0%) took place during July, and the least (5.8%) in February.
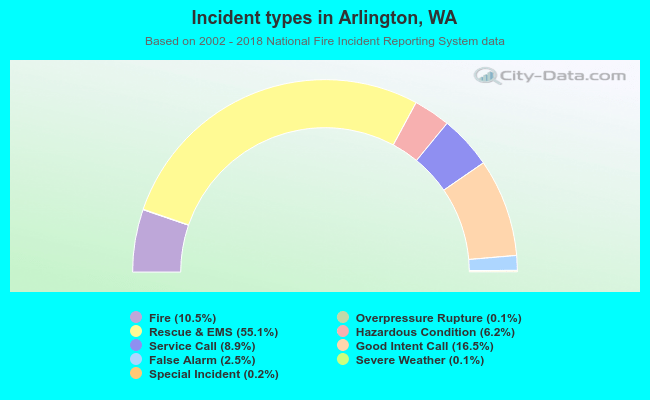 Out of all 28,145 cases reported during the years 2002 - 2018, the most belonged to the categories: Rescue & EMS (55.1%), Good Intent Call (16.5%), and Fire (10.5%).
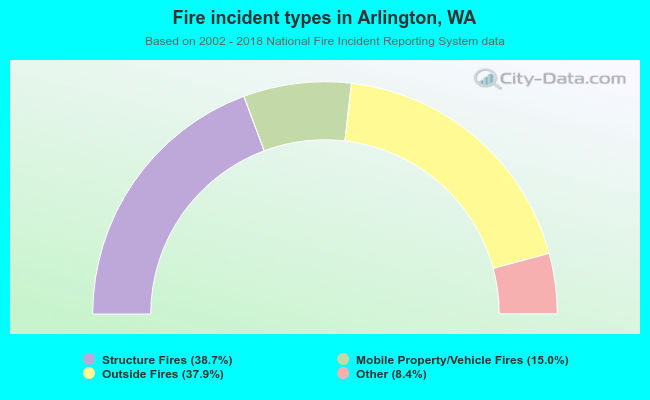 When looking into fire subcategories, the most reports belonged to: Structure Fires (38.7%), and Outside Fires (37.9%).