Mukilteo: Fire Incidents, Washington (WA)
Where are fire incidents reported in Mukilteo, WA
Something went wrong! Please refresh the page.
| Fire incidents reported | |
|---|---|
| Sreet name | Count |
| HARBOUR POINTE BLVD | 232 |
| MUKILTEO SPEEDWAY | 166 |
| PAINE FIELD BLVD | 144 |
| FRONT ST | 74 |
| SR 525 | 38 |
| CYRUS WAY | 36 |
| CHENNAULT BEACH RD | 34 |
| HARBOUR PL | 26 |
| 47 PL | 24 |
| 81 PL | 24 |
| CHENNAULT BCH | 24 |
| 88 ST | 20 |
| 46 PL | 18 |
| 53 AVE | 16 |
| CLUB HOUSE LN | 16 |
| 50 PL | 14 |
| 76 ST | 14 |
| GOAT TRAIL LOOP RD | 14 |
| 2 ST | 12 |
| 49 AVE | 12 |
| 60 AVE | 12 |
| 84 ST | 12 |
| 92 ST | 12 |
| MUKILTEO SPDWY | 12 |
| 16 CT | 10 |
| 44 AVE | 10 |
| 48 AVE | 10 |
| 48 PL | 10 |
| 93 PL | 10 |
| BEVERLY PARK RD | 10 |
2002 - 2018 National Fire Incident Reporting System (NFIRS) incidents
- Incident types reported to NFIRS in Mukilteo, WA
- 6,26156.4%Rescue & EMS
- 1,65214.9%Good Intent Call
- 1,20910.9%Service Call
- 8868.0%Fire
- 5354.8%False Alarm
- 5294.8%Hazardous Condition
- 170.2%Overpressure Rupture
- Fire incident types reported to NFIRS in Mukilteo, WA
- 35840.4%Outside Fires
- 28932.6%Structure Fires
- 15617.6%Other
- 839.4%Mobile Property/Vehicle Fires
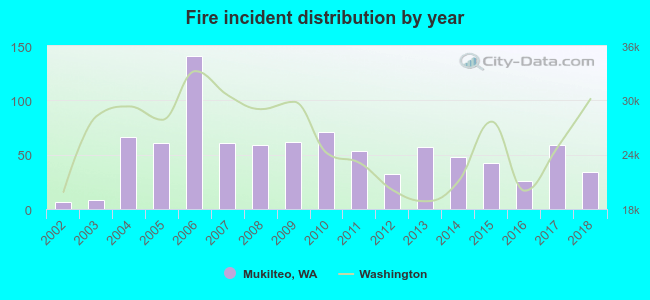 Based on the data from the years 2002 - 2018 the average number of fire incidents per year is 52. The highest number of fire incidents - 141 took place in 2006, and the least - 6 in 2002. The data has a growing trend.
The average number of yearly fire incidents per 10k residents in Mukilteo, WA compared to nearest cities:
(Note: Based on data for the last 3 years, including only cities with population 5,000 and above)
| Mukilteo: | 18.9 |
| Everett: | 40.3 |
| Mill Creek: | 10.8 |
| Lynnwood: | 56.1 |
| Edmonds: | 16.5 |
| Mountlake Terrace: | 14.9 |
| Brier: | 10.4 |
| Snohomish: | 98.1 |
| Bothell: | 32.5 |
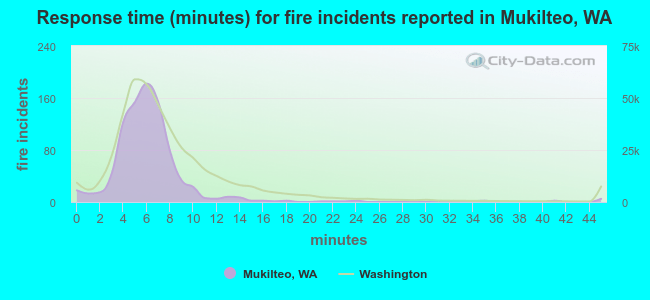 The median response time based on all reported fire incidents is 6 minutes. This is comparable to the Washington median value.
The median response time in Mukilteo, WA compared to nearest cities:
(Note: Based on data for all years, including only cities with at least 500 fire incidents)
| Mukilteo: | 6 minutes |
| Everett: | 6 minutes |
| Lynnwood: | 7 minutes |
| Edmonds: | 7 minutes |
| Mountlake Terrace: | 7 minutes |
| Snohomish: | 8 minutes |
| Bothell: | 6 minutes |
| Shoreline: | 7 minutes |
| Kenmore: | 6 minutes |
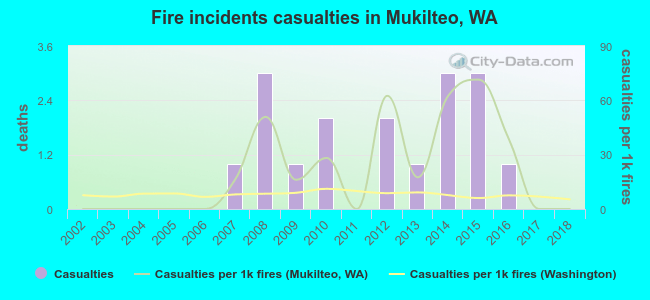 Based on the data from the years 2002 - 2018 the average number of fire-related casualties per year is 1. The highest number of reported injuries - 3 took place in 2008, and the lowest - 0 in 2002. The data has a constant trend.
The average number of casualties per 1,000 fires is 21. This indicator was the highest - 71 in 2015, and the lowest 0 in 2002. The trend for injuries per 1,000 fire incidents is increasing. Compared to the Washington value the number of casualties per 1,000 fire incidents is much higher.
Based on the data from the years 2002 - 2018 the average number of fire-related casualties per year is 1. The highest number of reported injuries - 3 took place in 2008, and the lowest - 0 in 2002. The data has a constant trend.
The average number of casualties per 1,000 fires is 21. This indicator was the highest - 71 in 2015, and the lowest 0 in 2002. The trend for injuries per 1,000 fire incidents is increasing. Compared to the Washington value the number of casualties per 1,000 fire incidents is much higher.
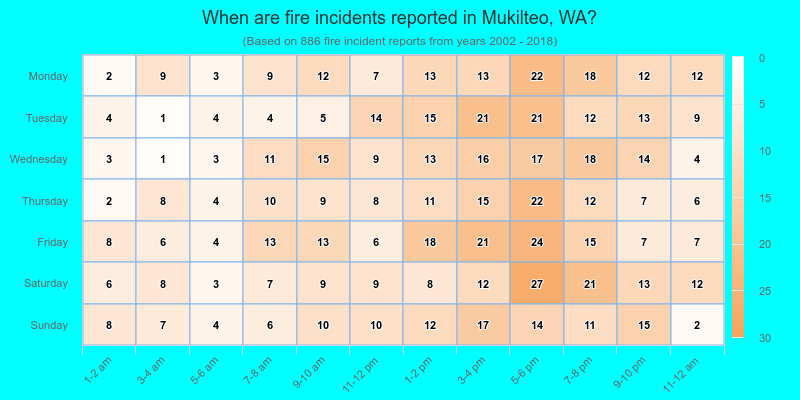
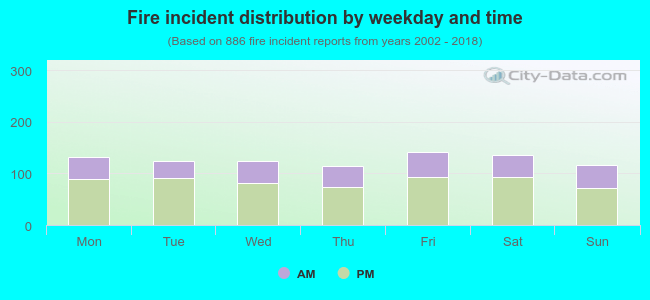 33.2% incidents where reported in the morning and 66.8% in the evening. The most fires (16.0%) took place on Friday, and the least (12.9%) on Thursday.
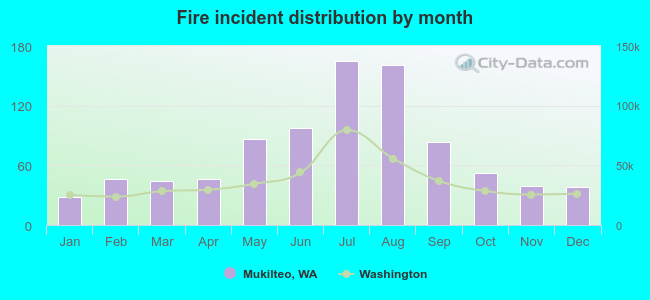 According to the 886 reports from years 2002 - 2018 most fires (18.6%) took place during July, and the least (3.2%) in January.
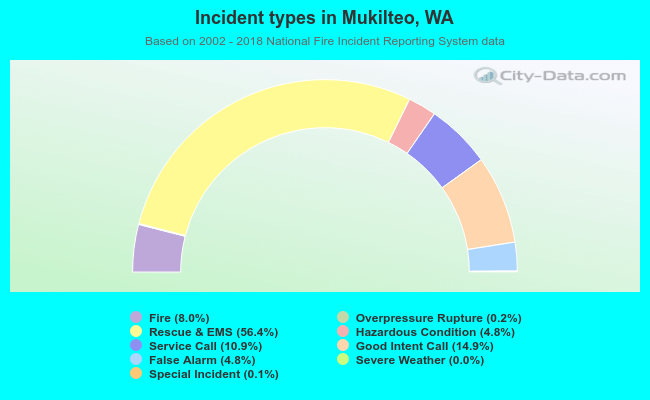 Out of all 11,104 cases reported during the years 2002 - 2018, the most belonged to the categories: Rescue & EMS (56.4%), Good Intent Call (14.9%), and Service Call (10.9%).
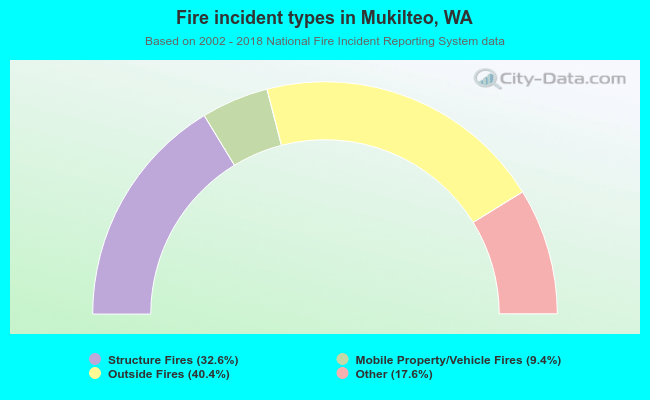 When looking into fire subcategories, the most reports belonged to: Outside Fires (40.4%), and Structure Fires (32.6%).