Everett: Fire Incidents, Washington (WA)
Where are fire incidents reported in Everett, WA
Something went wrong! Please refresh the page.
| Fire incidents reported | |
|---|---|
| Sreet name | Count |
| EVERGREEN WAY | 658 |
| CASINO RD | 546 |
| BROADWAY | 356 |
| 4 AVE | 302 |
| 128 ST | 262 |
| EVERETT MALL WAY | 218 |
| 112 ST | 206 |
| HWY 99 | 178 |
| MARINE VIEW DR | 160 |
| RUCKER AVE | 158 |
| COLBY AVE | 152 |
| 19 AVE | 146 |
| GIBSON RD | 144 |
| ADMIRALTY WAY | 132 |
| HOYT AVE | 124 |
| BROADWAY AVE | 122 |
| 19TH AVE | 120 |
| LOMBARD AVE | 114 |
| CASINO | 112 |
| CENTER RD | 108 |
| EVERETT AVE | 108 |
| EVERGREEN | 104 |
| 132 ST | 102 |
| WETMORE AVE | 102 |
| AIRPORT RD | 100 |
| 8 AVE | 98 |
| 75 ST | 96 |
| HEWITT AVE | 96 |
| 124 ST | 90 |
| HOLLY DR | 90 |
| Other | 2,493 |
2002 - 2018 National Fire Incident Reporting System (NFIRS) incidents
- Incident types reported to NFIRS in Everett, WA
- 55,46964.5%Rescue & EMS
- 11,30113.1%Good Intent Call
- 7,7979.1%Fire
- 3,9574.6%Service Call
- 3,6224.2%Hazardous Condition
- 3,5314.1%False Alarm
- 1850.2%Special Incident
- 1460.2%Overpressure Rupture
- Fire incident types reported to NFIRS in Everett, WA
- 3,71447.6%Outside Fires
- 2,34930.1%Structure Fires
- 1,23015.8%Mobile Property/Vehicle Fires
- 5046.5%Other
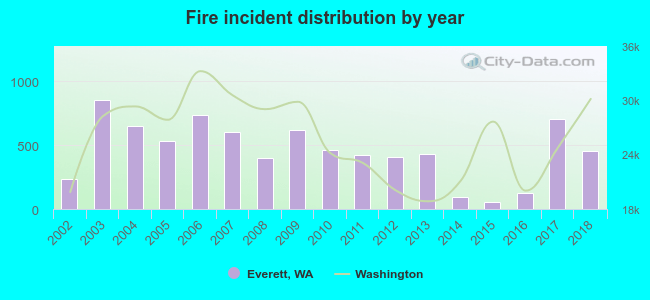 Based on the data from the years 2002 - 2018 the average number of fires per year is 459. The highest number of fires - 852 took place in 2003, and the least - 56 in 2015. The data has an increasing trend.
The average number of yearly fire incidents per 10k residents in Everett, WA compared to nearest cities:
(Note: Based on data for the last 3 years, including only cities with population 5,000 and above)
| Everett: | 40.3 |
| Mukilteo: | 18.9 |
| Snohomish: | 98.1 |
| Mill Creek: | 10.8 |
| Marysville: | 19.5 |
| Lake Stevens: | 27.2 |
| Lynnwood: | 56.1 |
| Monroe: | 19.6 |
| Brier: | 10.4 |
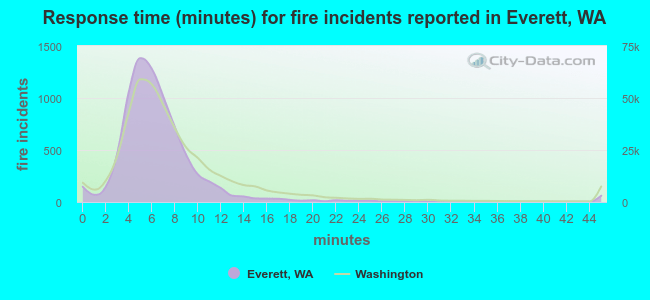 The median response time based on all reported fire incidents is 6 minutes. This is about the same as the state median value.
The median response time in Everett, WA compared to nearest cities:
(Note: Based on data for all years, including only cities with at least 500 fire incidents)
| Everett: | 6 minutes |
| Mukilteo: | 6 minutes |
| Snohomish: | 8 minutes |
| Marysville: | 7 minutes |
| Lake Stevens: | 8 minutes |
| Lynnwood: | 7 minutes |
| Monroe: | 8 minutes |
| Mountlake Terrace: | 7 minutes |
| Edmonds: | 7 minutes |
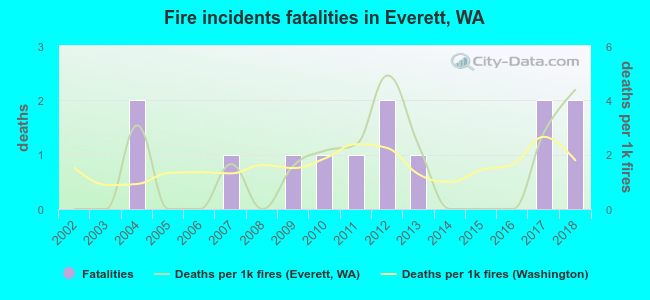 According to the reports from the years 2002 - 2018 the average number of fire-related yearly deaths is 1. The highest number of deaths - 2 took place in 2004, and the lowest - 0 in 2002. The data has a rising trend.
The average number of fatalities per 1,000 fires is 1. This indicator was the highest - 5 in 2012, and the lowest 0 in 2002. The trend for fatalities per 1,000 fires is growing. Compared to the Washington value the number of deaths per 1,000 fire incidents is about the same.
According to the reports from the years 2002 - 2018 the average number of fire-related yearly deaths is 1. The highest number of deaths - 2 took place in 2004, and the lowest - 0 in 2002. The data has a rising trend.
The average number of fatalities per 1,000 fires is 1. This indicator was the highest - 5 in 2012, and the lowest 0 in 2002. The trend for fatalities per 1,000 fires is growing. Compared to the Washington value the number of deaths per 1,000 fire incidents is about the same.Deaths per 1,000 incidents in Everett, WA compared to nearest cities:
(Note: Based on data for all years, including only cities with at least 2,500 fire incidents)
| Everett: | 1.7 |
| Marysville: | 0.8 |
| Lynnwood: | 0.5 |
| Arlington: | 4.0 |
| Shoreline: | 2.9 |
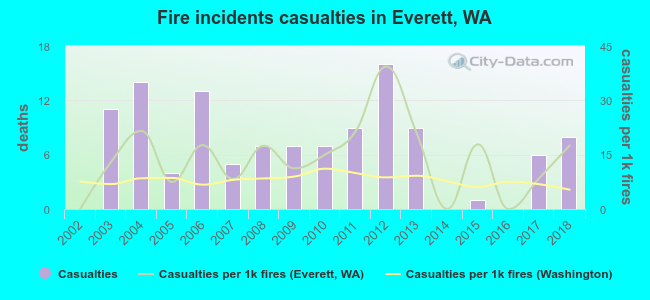 According to the data from the years 2002 - 2018 the average number of fire-related yearly casualties is 7. The highest number of casualties - 16 took place in 2012, and the lowest - 0 in 2002. The data has an increasing trend.
The average number of injuries per 1,000 fires is 14. This indicator was the highest - 39 in 2012, and the lowest 0 in 2002. The trend for injuries per 1,000 incidents is rising. Compared to the state value the number of casualties per 1,000 incidents is higher.
According to the data from the years 2002 - 2018 the average number of fire-related yearly casualties is 7. The highest number of casualties - 16 took place in 2012, and the lowest - 0 in 2002. The data has an increasing trend.
The average number of injuries per 1,000 fires is 14. This indicator was the highest - 39 in 2012, and the lowest 0 in 2002. The trend for injuries per 1,000 incidents is rising. Compared to the state value the number of casualties per 1,000 incidents is higher.Casualties per 1,000 incidents in Everett, WA compared to nearest cities:
(Note: Based on data for all years, including only cities with at least 500 fire incidents)
| Everett: | 15.0 |
| Mukilteo: | 19.2 |
| Snohomish: | 3.4 |
| Marysville: | 7.1 |
| Lake Stevens: | 9.5 |
| Lynnwood: | 7.8 |
| Monroe: | 2.0 |
| Mountlake Terrace: | 13.9 |
| Edmonds: | 13.1 |
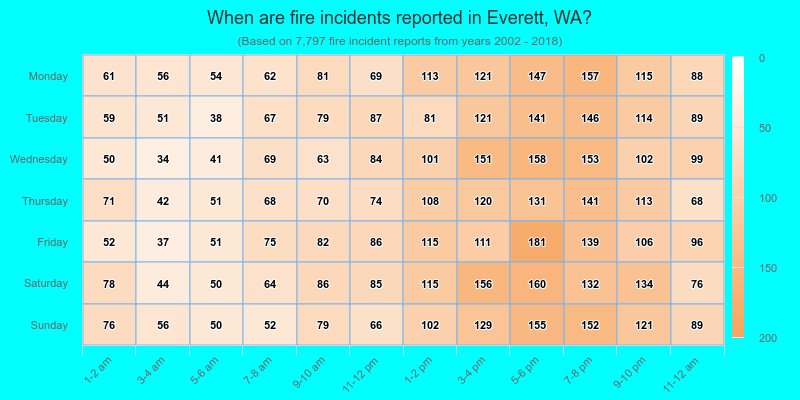
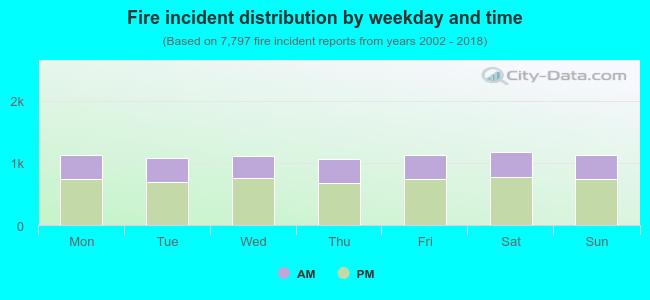 34.0% incidents where reported in the morning and 66.0% in the evening. The most fires (15.1%) took place on Saturday, and the least (13.6%) on Thursday.
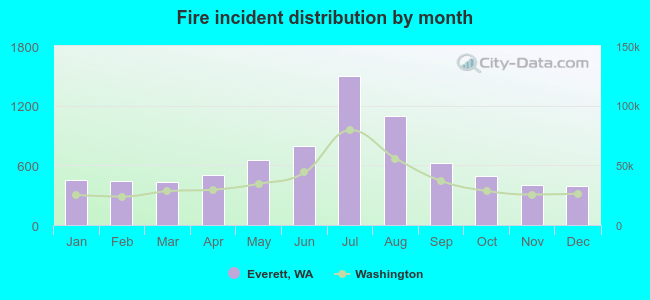 Based on the 7,797 fire incidents from years 2002 - 2018 most fires (19.3%) took place during July, and the least (5.1%) in December.
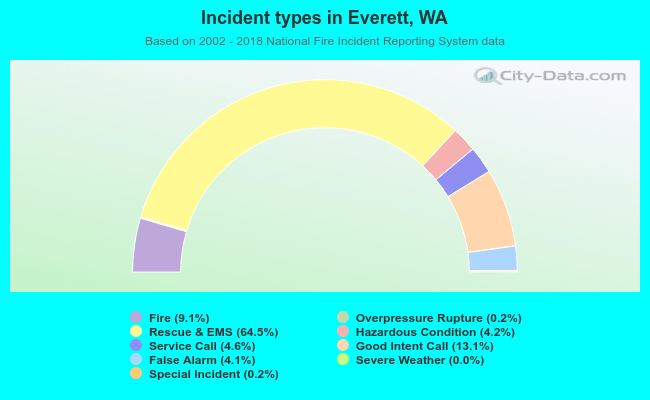 Out of all 86,019 cases reported during the years 2002 - 2018, the most belonged to the categories: Rescue & EMS (64.5%), Good Intent Call (13.1%), and Fire (9.1%).
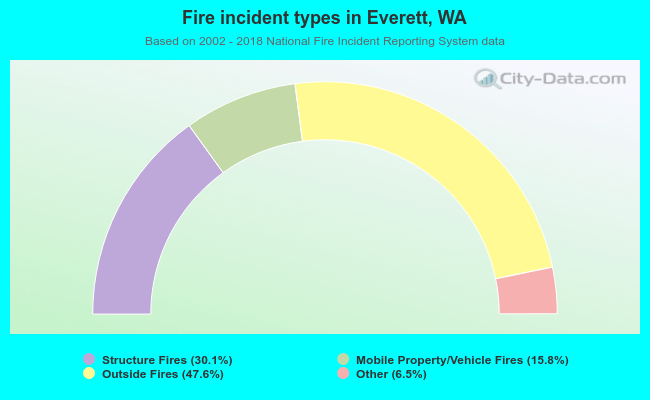 When looking into fire subcategories, the most reports belonged to: Outside Fires (47.6%), and Structure Fires (30.1%).