Auburn: Fire Incidents, Maine (ME)
Where are fire incidents reported in Auburn, ME
Something went wrong! Please refresh the page.
| Fire incidents reported | |
|---|---|
| Sreet name | Count |
| TURNER ST | 262 |
| CENTER ST | 234 |
| MOUNT AUBURN AVE | 184 |
| COURT ST | 108 |
| MINOT AVE | 94 |
| HOTEL RD | 78 |
| GREAT FALLS PLZ | 64 |
| MILL ST | 60 |
| MAIN ST | 58 |
| RIVERSIDE DR | 58 |
| SUMMER ST | 56 |
| BROAD ST | 54 |
| ALLIED RD | 52 |
| HAMPSHIRE ST | 48 |
| MINOT AVE | 46 |
| SPRING ST | 46 |
| SOUTH MAIN ST | 40 |
| HIGH ST | 34 |
| LAKE ST | 34 |
| PLEASANT ST | 34 |
| MINOT AV | 30 |
| OLD DANVILLE RD | 30 |
| WASHINGTON (NORTH) ST | 30 |
| GOFF ST | 28 |
| MOUNT AUBURN AV | 28 |
| POWNAL RD | 28 |
| TURNER RD | 28 |
| GOLDTHWAITE RD | 26 |
| MERROW RD | 26 |
| POLAND RD | 26 |
2003 - 2018 National Fire Incident Reporting System (NFIRS) incidents
- Incident types reported to NFIRS in Auburn, ME
- 12,31460.4%Rescue & EMS
- 2,86214.0%Hazardous Condition
- 1,8559.1%Fire
- 1,2226.0%Service Call
- 1,0455.1%False Alarm
- 1,0115.0%Good Intent Call
- 670.3%Special Incident
- Fire incident types reported to NFIRS in Auburn, ME
- 89548.2%Structure Fires
- 67436.3%Outside Fires
- 19310.4%Mobile Property/Vehicle Fires
- 935.0%Other
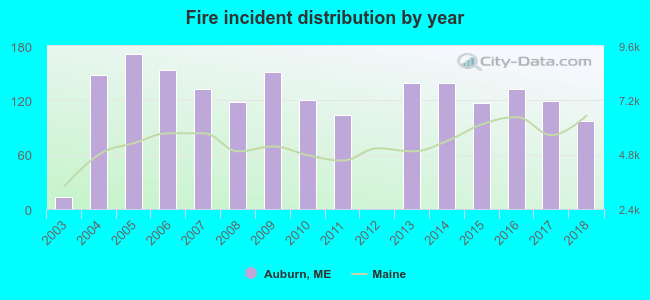 According to the data from the years 2003 - 2018 the average number of fires per year is 116. The highest number of reported fires - 171 took place in 2005, and the least - 0 in 2012. The data has a growing trend.
The average number of yearly fire incidents per 10k residents in Auburn, ME compared to nearest cities:
(Note: Based on data for the last 3 years, including only cities with population 5,000 and above)
| Auburn: | 50.8 |
| Lewiston: | 43.4 |
| Poland: | 62.0 |
| Lisbon: | 33.7 |
| New Gloucester: | 31.9 |
| Turner: | 50.0 |
| Gray: | 54.5 |
| Paris: | 40.5 |
| Topsham: | 38.2 |
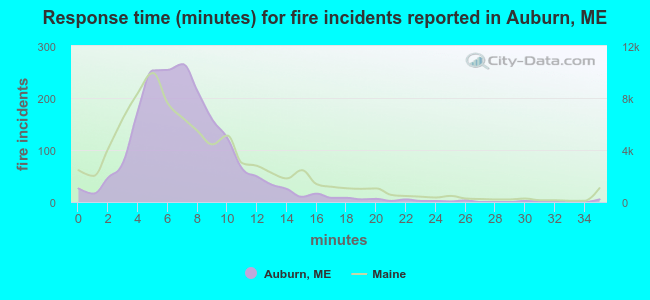 The median response time based on all reported fire incidents is 7 minutes. This is about the same as the state median value.
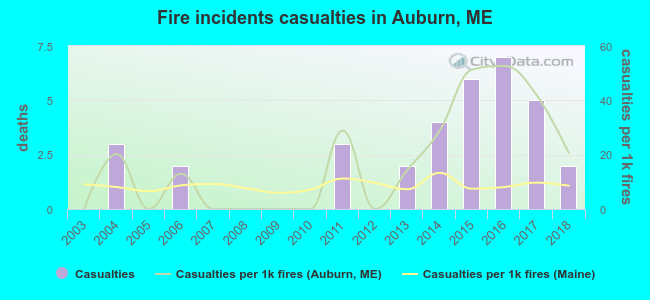 Based on the reports from the years 2003 - 2018 the average number of fire-related casualties per year is 2. The highest number of reported injuries - 7 took place in 2016, and the lowest - 0 in 2003. The data has an increasing trend.
The average number of injuries per 1,000 fire incidents is 17. This indicator was the highest - 53 in 2016, and the lowest 0 in 2003. The trend for casualties per 1,000 incidents is rising. Compared to the state value the number of casualties per 1,000 incidents is much higher.
Based on the reports from the years 2003 - 2018 the average number of fire-related casualties per year is 2. The highest number of reported injuries - 7 took place in 2016, and the lowest - 0 in 2003. The data has an increasing trend.
The average number of injuries per 1,000 fire incidents is 17. This indicator was the highest - 53 in 2016, and the lowest 0 in 2003. The trend for casualties per 1,000 incidents is rising. Compared to the state value the number of casualties per 1,000 incidents is much higher.
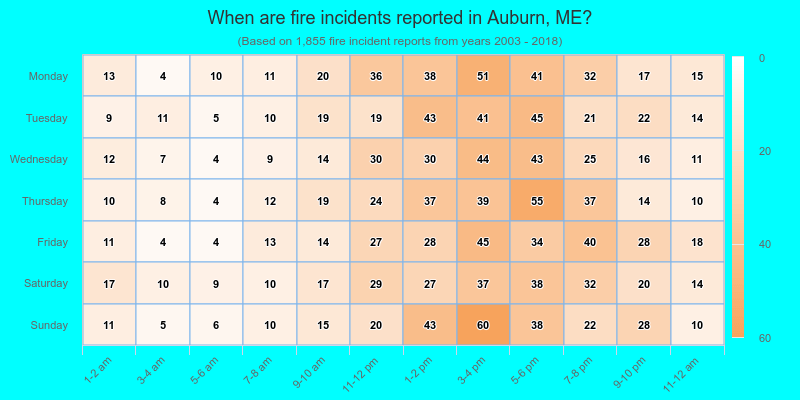
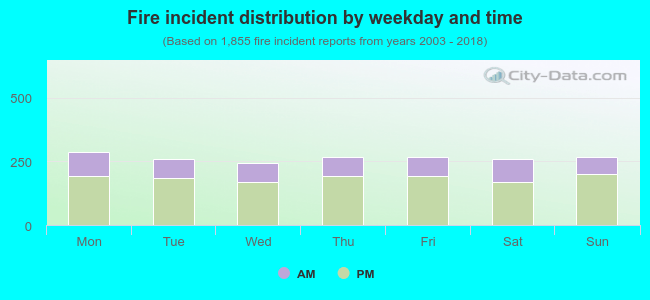 29.8% incidents where reported in the morning and 70.2% in the evening. The most fires (15.5%) took place on Monday, and the least (13.2%) on Wednesday.
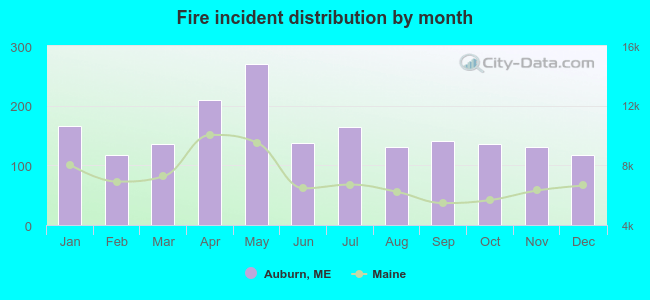 Based on the 1,855 fire incident reports from years 2003 - 2018 most fires (14.5%) took place during May, and the least (6.3%) in December.
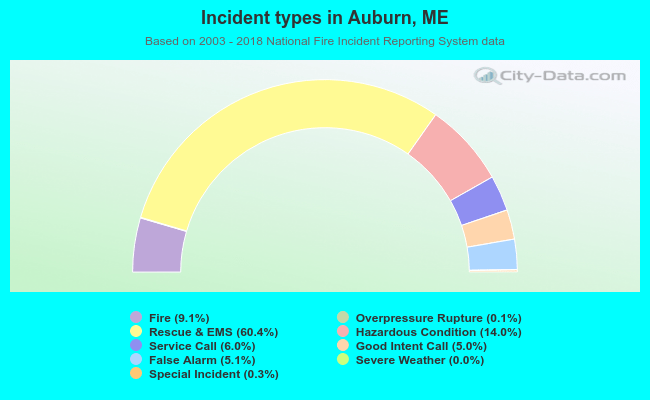 Out of all 20,396 cases reported during the years 2003 - 2018, the most belonged to the categories: Rescue & EMS (60.4%), Hazardous Condition (14.0%), and Fire (9.1%).
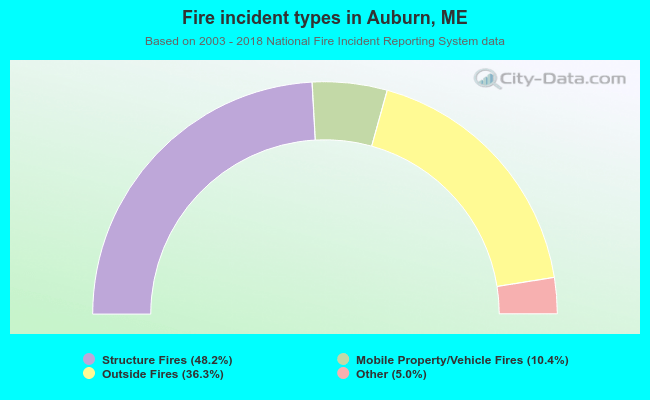 When looking into fire subcategories, the most reports belonged to: Structure Fires (48.2%), and Outside Fires (36.3%).