New Gloucester: Fire Incidents, Maine (ME)
Where are fire incidents reported in New Gloucester, ME
Something went wrong! Please refresh the page.
|
| |||||||||||||||||||||||||||||||||||||||||||||||||||||||||||||||||||||||||||||||||||||||||||||||||||||||||||||
2003 - 2018 National Fire Incident Reporting System (NFIRS) incidents
- Incident types reported to NFIRS in New Gloucester, ME
- 1,23056.1%Rescue & EMS
- 30714.0%Hazardous Condition
- 26812.2%Fire
- 1758.0%Service Call
- 1265.7%Good Intent Call
- 743.4%False Alarm
- 80.4%Overpressure Rupture
- 60.3%Special Incident
- Fire incident types reported to NFIRS in New Gloucester, ME
- 12546.6%Structure Fires
- 9836.6%Outside Fires
- 3914.6%Mobile Property/Vehicle Fires
- 62.2%Other
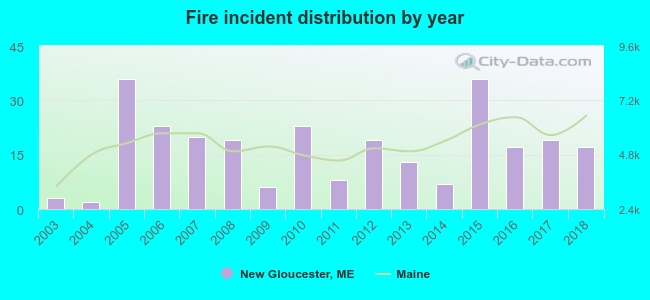 Based on the data from the years 2003 - 2018 the average number of fire incidents per year is 17. The highest number of reported fires - 36 took place in 2005, and the least - 2 in 2004. The data has a rising trend.
The average number of yearly fire incidents per 10k residents in New Gloucester, ME compared to nearest cities:
(Note: Based on data for the last 3 years, including only cities with population 5,000 and above)
| New Gloucester: | 31.9 |
| Gray: | 54.5 |
| Poland: | 62.0 |
| Auburn: | 50.8 |
| Lewiston: | 43.4 |
| Lisbon: | 33.7 |
| Windham: | 44.1 |
| Yarmouth: | 36.3 |
| Cumberland: | 43.0 |

 35.8% incidents where reported in the morning and 64.2% in the evening. The most fires (18.3%) took place on Saturday, and the least (11.6%) on Wednesday.
 According to the 268 incident reports from years 2003 - 2018 most fires (14.2%) took place during April, and the least (3.7%) in August.
 Out of all 2,194 cases reported during the years 2003 - 2018, the most belonged to the categories: Rescue & EMS (56.1%), Hazardous Condition (14.0%), and Fire (12.2%).
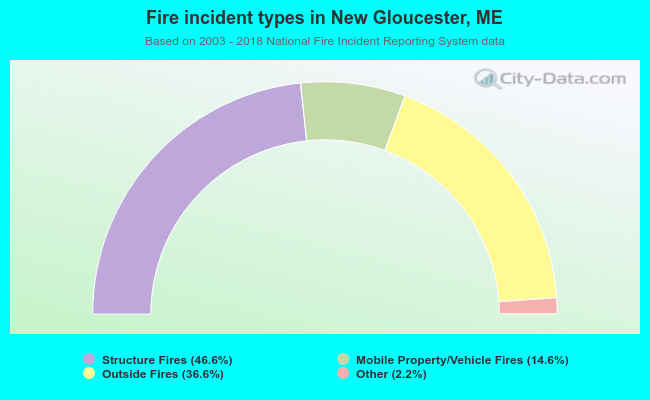 When looking into fire subcategories, the most reports belonged to: Structure Fires (46.6%), and Outside Fires (36.6%).