Windham: Fire Incidents, Maine (ME)
Where are fire incidents reported in Windham, ME
Something went wrong! Please refresh the page.
| Fire incidents reported | |
|---|---|
| Sreet name | Count |
| ROOSEVELT TRL | 292 |
| TANDBERG TRL | 92 |
| RIVER RD | 82 |
| GRAY RD | 78 |
| MAIN ST | 52 |
| POPE RD | 32 |
| ALBION RD | 28 |
| FALMOUTH RD | 26 |
| WINDHAM CENTER RD | 26 |
| DEPOT ST | 20 |
| HAVEN RD | 18 |
| HIGHLAND CLIFF RD | 16 |
| LAKESIDE DR | 16 |
| MALLISON FALLS RD | 16 |
| SWETT RD | 16 |
| VARNEY MILL RD | 16 |
| COTTAGE RD | 14 |
| LANDING RD | 14 |
| ROOSEVELT TR | 14 |
| SMITH RD | 14 |
| WEBB RD | 14 |
| WOODLAND RD | 14 |
| LAND OF NOD RD | 12 |
| PEAVEY AVE | 12 |
| VISTA DR | 12 |
| BEAULIEU DR | 10 |
| COOK RD | 10 |
| FINLEY RD | 10 |
| HIGH ST | 10 |
| NASH RD | 10 |
2002 - 2018 National Fire Incident Reporting System (NFIRS) incidents
- Incident types reported to NFIRS in Windham, ME
- 7,13156.7%Rescue & EMS
- 1,78514.2%Hazardous Condition
- 1,0378.2%Service Call
- 8977.1%Fire
- 8156.5%Good Intent Call
- 8036.4%False Alarm
- 760.6%Severe Weather
- 290.2%Special Incident
- Fire incident types reported to NFIRS in Windham, ME
- 51257.1%Structure Fires
- 21524.0%Outside Fires
- 11412.7%Mobile Property/Vehicle Fires
- 566.2%Other
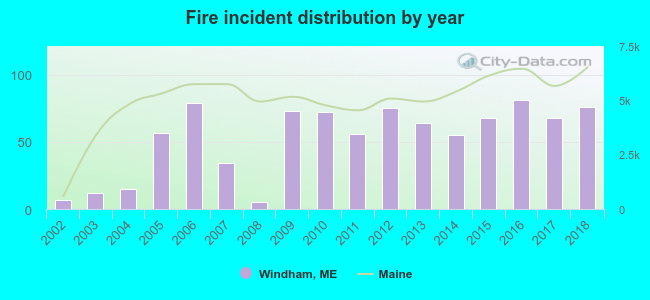 According to the data from the years 2002 - 2018 the average number of fire incidents per year is 53. The highest number of fire incidents - 81 took place in 2016, and the least - 5 in 2008. The data has a growing trend.
The average number of yearly fire incidents per 10k residents in Windham, ME compared to nearest cities:
(Note: Based on data for the last 3 years, including only cities with population 5,000 and above)
| Windham: | 44.1 |
| Gray: | 54.5 |
| Standish: | 22.3 |
| Gorham: | 90.1 |
| Westbrook: | 33.0 |
| Falmouth: | 24.7 |
| Cumberland: | 43.0 |
| Yarmouth: | 36.3 |
| New Gloucester: | 31.9 |
 The median response time based on all reported fire incidents is 6 minutes. This is about the same as the Maine median value.
The median response time in Windham, ME compared to nearest cities:
(Note: Based on data for all years, including only cities with at least 500 fire incidents)
| Windham: | 6 minutes |
| Gorham: | 7 minutes |
| Westbrook: | 5 minutes |
| Portland: | 4 minutes |
| South Portland: | 6 minutes |
| Scarborough: | 7 minutes |
| Freeport: | 8 minutes |
| Saco: | 7 minutes |
| Auburn: | 7 minutes |
 Based on the reports from the years 2002 - 2018 the average number of fire-related casualties per year is 1. The highest number of reported casualties - 4 took place in 2009, and the lowest - 0 in 2002. The data has a rising trend.
The average number of injuries per 1,000 fires is 17. This indicator was the highest - 73 in 2014, and the lowest 0 in 2002. The trend for injuries per 1,000 incidents is growing. Compared to the state value the number of casualties per 1,000 incidents is much higher.
Based on the reports from the years 2002 - 2018 the average number of fire-related casualties per year is 1. The highest number of reported casualties - 4 took place in 2009, and the lowest - 0 in 2002. The data has a rising trend.
The average number of injuries per 1,000 fires is 17. This indicator was the highest - 73 in 2014, and the lowest 0 in 2002. The trend for injuries per 1,000 incidents is growing. Compared to the state value the number of casualties per 1,000 incidents is much higher.Casualties per 1,000 incidents in Windham, ME compared to nearest cities:
(Note: Based on data for all years, including only cities with at least 500 fire incidents)
| Windham: | 21.2 |
| Gorham: | 10.8 |
| Westbrook: | 35.2 |
| Portland: | 5.2 |
| South Portland: | 2.3 |
| Scarborough: | 6.5 |
| Freeport: | 4.7 |
| Saco: | 17.0 |
| Auburn: | 18.3 |
 31.5% incidents where reported in the morning and 68.5% in the evening. The most fires (17.2%) took place on Monday, and the least (11.5%) on Wednesday.
 Based on the 897 fires from years 2002 - 2018 most fires (12.6%) took place during April, and the least (4.8%) in September.
 Out of all 12,585 cases reported during the years 2002 - 2018, the most belonged to the categories: Rescue & EMS (56.7%), Hazardous Condition (14.2%), and Service Call (8.2%).
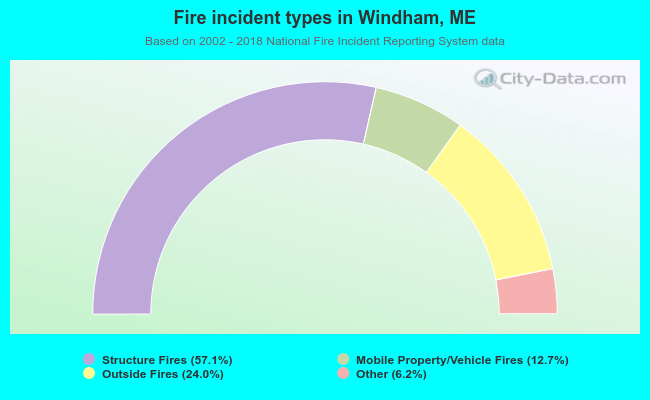 When looking into fire subcategories, the most reports belonged to: Structure Fires (57.1%), and Outside Fires (24.0%).