Austintown: Fire Incidents, Ohio (OH)
Where are fire incidents reported in Austintown, OH
Something went wrong! Please refresh the page.
| Fire incidents reported | |
|---|---|
| Sreet name | Count |
| MAHONING AVE | 352 |
| RACCOON RD | 246 |
| WESTCHESTER DR | 214 |
| MERIDIAN RD | 142 |
| KIRK RD | 110 |
| COMPASS WEST | 78 |
| NEW RD | 74 |
| CANFIELD-NILES RD | 66 |
| MAHONING AV | 58 |
| CANFIELD NILES RD | 56 |
| BURKEY RD | 54 |
| EDGEHILL AVE | 46 |
| TURNER RD | 46 |
| CANFIELDNILES RD | 44 |
| OHLTOWN RD | 44 |
| IDAHO RD | 42 |
| VICTORIA RD | 34 |
| WESTMINSTER AVE | 34 |
| INTERSTATE BLVD | 32 |
| NAVARRE AVE | 32 |
| SEVENTY SIX DR | 30 |
| BEVERLY AVE | 28 |
| MAIN ST | 28 |
| NORQUEST BLVD | 28 |
| PEMBROOK RD | 28 |
| ROANOKE AVE | 28 |
| COUNTY LINE RD | 26 |
| WEBB RD | 26 |
| FOUR MILE RUN RD | 24 |
| LANTERMAN RD | 24 |
2002 - 2018 National Fire Incident Reporting System (NFIRS) incidents
- Incident types reported to NFIRS in Austintown, OH
- 12,81357.7%Rescue & EMS
- 2,87713.0%Hazardous Condition
- 2,0099.0%Fire
- 1,5346.9%Service Call
- 1,4896.7%Good Intent Call
- 1,3976.3%False Alarm
- 400.2%Severe Weather
- 350.2%Overpressure Rupture
- Fire incident types reported to NFIRS in Austintown, OH
- 1,06252.9%Structure Fires
- 51625.7%Outside Fires
- 42221.0%Mobile Property/Vehicle Fires
- 90.4%Other
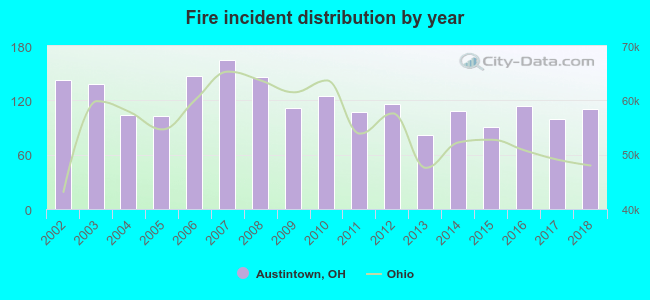 Based on the data from the years 2002 - 2018 the average number of fire incidents per year is 118. The highest number of reported fire incidents - 165 took place in 2007, and the least - 82 in 2013. The data has a declining trend.
The average number of yearly fire incidents per 10k residents in Austintown, OH compared to nearest cities:
(Note: Based on data for the last 3 years, including only cities with population 5,000 and above)
| Austintown: | 36.3 |
| Canfield: | 35.6 |
| Youngstown: | 89.8 |
| Girard: | 36.9 |
| Boardman: | 20.4 |
| Niles: | 34.4 |
| Campbell: | 88.4 |
| Struthers: | 33.2 |
| Hubbard: | 84.0 |
 The median response time based on all reported fire incidents is 5 minutes. This is lower than the Ohio median value.
The median response time in Austintown, OH compared to nearest cities:
(Note: Based on data for all years, including only cities with at least 500 fire incidents)
| Austintown: | 5 minutes |
| Canfield: | 6 minutes |
| Youngstown: | 3 minutes |
| Girard: | 4 minutes |
| Boardman: | 4 minutes |
| Niles: | 4 minutes |
| Campbell: | 3 minutes |
| Struthers: | 3 minutes |
| Hubbard: | 8 minutes |
 Based on the data from the years 2002 - 2018 the average number of fire-related fatalities per year is 0. The highest number of reported deaths - 1 took place in 2002, and the lowest - 0 in 2003. The data has a decreasing trend.
 According to the data from the years 2002 - 2018 the average number of fire-related casualties per year is 5. The highest number of injuries - 12 took place in 2007, and the lowest - 0 in 2004. The data has a rising trend.
The average number of casualties per 1,000 fire incidents is 40. This indicator was the highest - 78 in 2012, and the lowest 0 in 2004. The trend for injuries per 1,000 incidents is increasing. Compared to the state value the number of casualties per 1,000 fire incidents is much higher.
According to the data from the years 2002 - 2018 the average number of fire-related casualties per year is 5. The highest number of injuries - 12 took place in 2007, and the lowest - 0 in 2004. The data has a rising trend.
The average number of casualties per 1,000 fire incidents is 40. This indicator was the highest - 78 in 2012, and the lowest 0 in 2004. The trend for injuries per 1,000 incidents is increasing. Compared to the state value the number of casualties per 1,000 fire incidents is much higher.
 30.8% incidents where reported in the morning and 69.2% in the evening. The most fires (16.1%) took place on Friday, and the least (13.5%) on Tuesday.
 According to the 2,009 fires from years 2002 - 2018 most fires (10.6%) took place during May, and the least (5.8%) in February.
 Out of all 22,208 cases reported during the years 2002 - 2018, the most belonged to the categories: Rescue & EMS (57.7%), Hazardous Condition (13.0%), and Fire (9.0%).
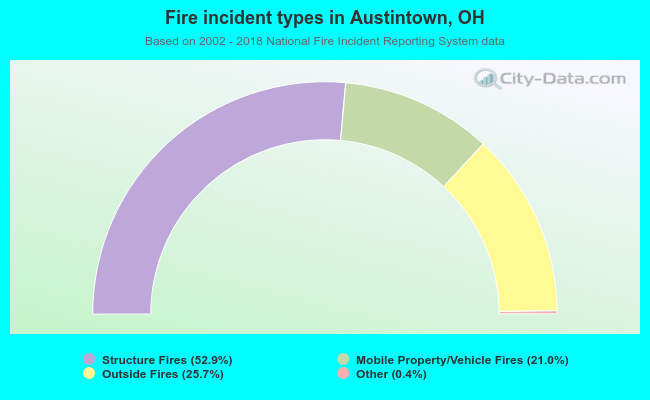 When looking into fire subcategories, the most incidents belonged to: Structure Fires (52.9%), and Outside Fires (25.7%).