Hubbard: Fire Incidents, Ohio (OH)
Where are fire incidents reported in Hubbard, OH
Something went wrong! Please refresh the page.
| Fire incidents reported | |
|---|---|
| Sreet name | Count |
| WEST LIBERTY ST | 88 |
| NORTH MAIN ST | 66 |
| CHESTNUT RIDGE RD | 64 |
| TRUCK WORLD BLVD | 44 |
| YOUNGSTOWN HUBBARD RD | 34 |
| MASURY RD | 32 |
| INTERSTATE 80 RTE | 30 |
| SEIFERT LEWIS RD | 28 |
| WEST PARK AVE | 28 |
| JACOBS RD | 26 |
| ELMWOOD DR | 24 |
| CREED AVE | 20 |
| I80 EAST | 20 |
| MT EVERETT RD | 20 |
| WARNER RD | 20 |
| LIBERTY AVE | 18 |
| EAST LIBERTY ST | 16 |
| POTHOUR WHEELER RD | 16 |
| TIBBETTS WICK RD | 16 |
| BELL WICK RD | 14 |
| DRUMMOND AVE | 14 |
| SOUTH MAIN ST | 14 |
| STEWART SHARON RD | 14 |
| BELLWICK RD | 12 |
| COLLAR PRICE RD | 12 |
| COUNTY LINE RD | 12 |
| LIBERTY ST | 12 |
| LINCOLN AVE | 12 |
| WICK CAMPBELL RD | 12 |
| WOODBINE AVE | 12 |
| Other | 112 |
2002 - 2018 National Fire Incident Reporting System (NFIRS) incidents
- Incident types reported to NFIRS in Hubbard, OH
- 1,19336.2%Hazardous Condition
- 86226.1%Fire
- 46013.9%Service Call
- 2597.9%False Alarm
- 2276.9%Good Intent Call
- 2006.1%Rescue & EMS
- 481.5%Special Incident
- 471.4%Severe Weather
- Fire incident types reported to NFIRS in Hubbard, OH
- 38244.3%Structure Fires
- 30735.6%Outside Fires
- 17220.0%Mobile Property/Vehicle Fires
- 10.1%Other
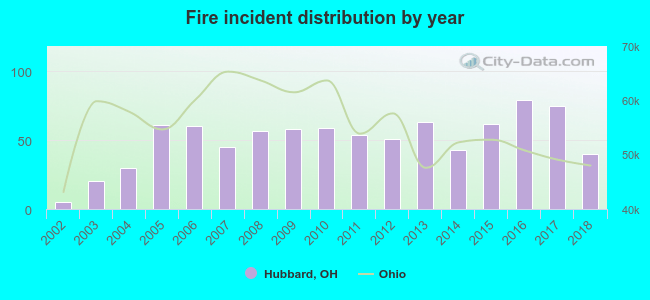 According to the data from the years 2002 - 2018 the average number of fire incidents per year is 51. The highest number of reported fires - 79 took place in 2016, and the least - 5 in 2002. The data has a growing trend.
The average number of yearly fire incidents per 10k residents in Hubbard, OH compared to nearest cities:
(Note: Based on data for the last 3 years, including only cities with population 5,000 and above)
| Hubbard: | 84.0 |
| Campbell: | 88.4 |
| Youngstown: | 89.8 |
| Girard: | 36.9 |
| Struthers: | 33.2 |
| Boardman: | 20.4 |
| Austintown: | 36.3 |
| Niles: | 34.4 |
| Canfield: | 35.6 |
 The median response time based on all reported fire incidents is 8 minutes. This is higher than the Ohio median value.
The median response time in Hubbard, OH compared to nearest cities:
(Note: Based on data for all years, including only cities with at least 500 fire incidents)
| Hubbard: | 8 minutes |
| Campbell: | 3 minutes |
| Youngstown: | 3 minutes |
| Girard: | 4 minutes |
| Struthers: | 3 minutes |
| Boardman: | 4 minutes |
| Austintown: | 5 minutes |
| Niles: | 4 minutes |
| Canfield: | 6 minutes |
 Based on the data from the years 2002 - 2018 the average number of fire-related fatalities per year is 0. The highest number of deaths - 2 took place in 2017, and the lowest - 0 in 2002. The data has a constant trend.
 29.5% incidents where reported in the morning and 70.5% in the evening. The most fires (16.2%) took place on Sunday, and the least (12.8%) on Monday.
 Based on the 862 fires from years 2002 - 2018 most fires (15.5%) took place during April, and the least (5.2%) in January.
 Out of all 3,299 cases reported during the years 2002 - 2018, the most belonged to the categories: Hazardous Condition (36.2%), Fire (26.1%), and Service Call (13.9%).
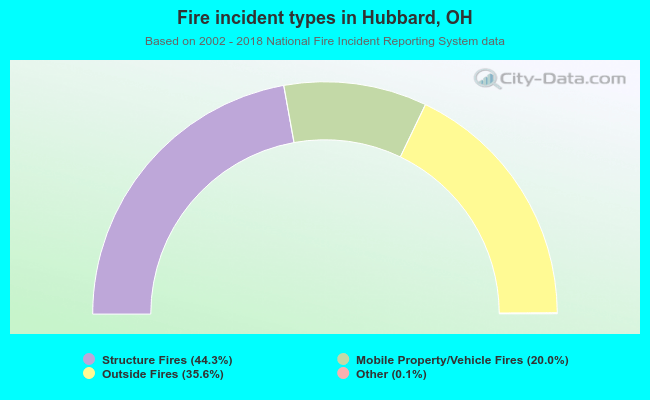 When looking into fire subcategories, the most incidents belonged to: Structure Fires (44.3%), and Outside Fires (35.6%).