Campbell: Fire Incidents, Ohio (OH)
Where are fire incidents reported in Campbell, OH
Something went wrong! Please refresh the page.
| Fire incidents reported | |
|---|---|
| Sreet name | Count |
| TREMBLE AVE | 92 |
| COITSVILLE RD | 88 |
| DEVITT AVE | 84 |
| TWELFTH ST | 80 |
| ROBINSON RD | 76 |
| SIXTH ST | 68 |
| TENNEY AVE | 60 |
| WHIPPLE AVE | 54 |
| WILSON AVE | 50 |
| BRIGHT AVE | 46 |
| GLADSTONE ST | 46 |
| PENHALE AVE | 46 |
| MCCARTNEY RD | 44 |
| GORDON AVE | 42 |
| SANDERSON AVE | 42 |
| WOODLAND AVE | 40 |
| PORTER AVE | 38 |
| REED ST | 32 |
| JACKSON ST | 30 |
| 12TH ST | 28 |
| JEAN ST | 26 |
| HYATT AVE | 22 |
| MADISON ST | 22 |
| THIRTEENTH ST | 22 |
| HAMROCK DR | 20 |
| ROOSEVELT DR | 20 |
| BLOSSOM AVE | 18 |
| DELMAR ST | 18 |
| SYCAMORE DR | 18 |
| WALTER ST | 18 |
2005 - 2018 National Fire Incident Reporting System (NFIRS) incidents
- Incident types reported to NFIRS in Campbell, OH
- 1,05739.5%Fire
- 61923.1%Service Call
- 56921.2%Hazardous Condition
- 1796.7%False Alarm
- 1445.4%Rescue & EMS
- 983.7%Good Intent Call
- 70.3%Special Incident
- 40.1%Severe Weather
- Fire incident types reported to NFIRS in Campbell, OH
- 53850.9%Structure Fires
- 44742.3%Outside Fires
- 726.8%Mobile Property/Vehicle Fires
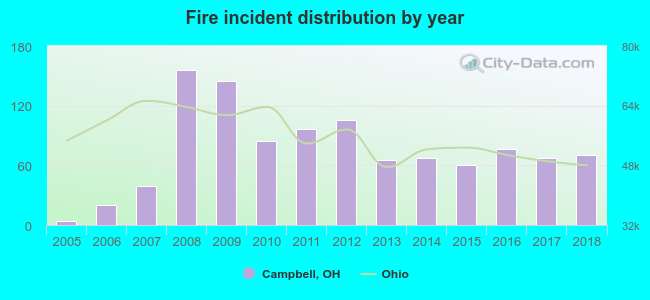 Based on the data from the years 2005 - 2018 the average number of fire incidents per year is 75. The highest number of fires - 156 took place in 2008, and the least - 4 in 2005. The data has a rising trend.
The average number of yearly fire incidents per 10k residents in Campbell, OH compared to nearest cities:
(Note: Based on data for the last 3 years, including only cities with population 5,000 and above)
| Campbell: | 88.4 |
| Struthers: | 33.2 |
| Youngstown: | 89.8 |
| Boardman: | 20.4 |
| Hubbard: | 84.0 |
| Austintown: | 36.3 |
| Girard: | 36.9 |
| Canfield: | 35.6 |
| Niles: | 34.4 |
 The median response time based on all reported fire incidents is 3 minutes. This is much lower compared to the state median value.
The median response time in Campbell, OH compared to nearest cities:
(Note: Based on data for all years, including only cities with at least 500 fire incidents)
| Campbell: | 3 minutes |
| Struthers: | 3 minutes |
| Youngstown: | 3 minutes |
| Boardman: | 4 minutes |
| Hubbard: | 8 minutes |
| Austintown: | 5 minutes |
| Girard: | 4 minutes |
| Canfield: | 6 minutes |
| Niles: | 4 minutes |
 According to the data from the years 2005 - 2018 the average number of fire-related casualties per year is 1. The highest number of reported casualties - 3 took place in 2008, and the lowest - 0 in 2005. The data has a growing trend.
The average number of casualties per 1,000 fire incidents is 9. This indicator was the highest - 33 in 2015, and the lowest 0 in 2005. The trend for casualties per 1,000 fires is rising. Compared to the Ohio value the number of injuries per 1,000 fire incidents is lower.
According to the data from the years 2005 - 2018 the average number of fire-related casualties per year is 1. The highest number of reported casualties - 3 took place in 2008, and the lowest - 0 in 2005. The data has a growing trend.
The average number of casualties per 1,000 fire incidents is 9. This indicator was the highest - 33 in 2015, and the lowest 0 in 2005. The trend for casualties per 1,000 fires is rising. Compared to the Ohio value the number of injuries per 1,000 fire incidents is lower.Casualties per 1,000 incidents in Campbell, OH compared to nearest cities:
(Note: Based on data for all years, including only cities with at least 500 fire incidents)
| Campbell: | 11.4 |
| Struthers: | 21.8 |
| Youngstown: | 11.1 |
| Boardman: | 52.1 |
| Hubbard: | 2.3 |
| Austintown: | 40.8 |
| Girard: | 5.8 |
| Canfield: | 38.0 |
| Niles: | 17.0 |
 30.7% incidents where reported in the morning and 69.3% in the evening. The most fires (16.7%) took place on Tuesday, and the least (12.6%) on Thursday.
 According to the 1,057 fires from years 2005 - 2018 most fires (11.0%) took place during July, and the least (4.8%) in December.
 Out of all 2,679 cases reported during the years 2005 - 2018, the most belonged to the categories: Fire (39.5%), Service Call (23.1%), and Hazardous Condition (21.2%).
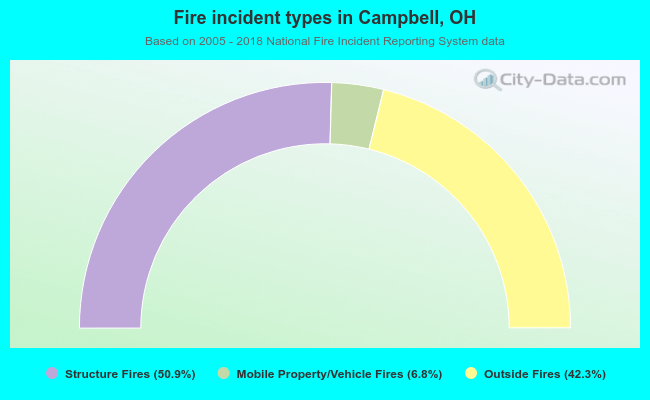 When looking into fire subcategories, the most reports belonged to: Structure Fires (50.9%), and Outside Fires (42.3%).