Bartlesville: Fire Incidents, Oklahoma (OK)
Where are fire incidents reported in Bartlesville, OK
Something went wrong! Please refresh the page.
| Fire incidents reported | |
|---|---|
| Sreet name | Count |
| WASHINGTON BLVD | 182 |
| FRANK PHILLIPS BLVD | 150 |
| US 60 | 128 |
| JOHNSTONE AVE | 108 |
| CR 2145 | 100 |
| SANTA FE AVE | 82 |
| MADISON BLVD | 78 |
| ADAMS BLVD | 76 |
| MAPLE AVE | 74 |
| OKESA RD | 70 |
| OAK AVE | 68 |
| TUXEDO BLVD | 64 |
| CR 2365 | 58 |
| NOWATA RD | 56 |
| 2400 | 52 |
| JENNINGS AVE | 50 |
| KEELER AVE | 48 |
| ROGERS AVE | 48 |
| CHEROKEE AVE | 46 |
| DEWEY AVE | 42 |
| HICKORY AVE | 42 |
| OSAGE AVE | 42 |
| PENN AVE | 42 |
| ARMSTRONG AVE | 40 |
| CR 3551 | 40 |
| SEMINOLE AVE | 40 |
| 60 HWY | 38 |
| HAZEL RD | 38 |
| OK 123 | 38 |
| VIRGINIA AVE | 38 |
| Other | 1,420 |
2004 - 2018 National Fire Incident Reporting System (NFIRS) incidents
- Incident types reported to NFIRS in Bartlesville, OK
- 10,37355.5%Rescue & EMS
- 3,39818.2%Fire
- 1,4817.9%Good Intent Call
- 1,4557.8%False Alarm
- 1,1446.1%Hazardous Condition
- 6703.6%Service Call
- 1300.7%Special Incident
- 300.2%Overpressure Rupture
- Fire incident types reported to NFIRS in Bartlesville, OK
- 2,12362.5%Outside Fires
- 68520.2%Structure Fires
- 3189.4%Other
- 2728.0%Mobile Property/Vehicle Fires
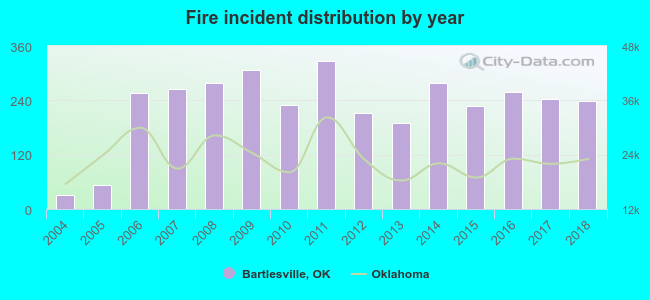 Based on the data from the years 2004 - 2018 the average number of fires per year is 227. The highest number of reported fire incidents - 327 took place in 2011, and the least - 30 in 2004. The data has a growing trend.
The average number of yearly fire incidents per 10k residents in Bartlesville, OK compared to nearest cities:
(Note: Based on data for the last 3 years, including only cities with population 5,000 and above)
| Bartlesville: | 67.5 |
| Skiatook: | 126.3 |
| Collinsville: | 102.6 |
| Owasso: | 34.9 |
| Claremore: | 109.6 |
| Catoosa: | 95.6 |
| Tulsa: | 50.9 |
| Sand Springs: | 130.8 |
| Vinita: | 161.4 |
 The median response time based on all reported fire incidents is 5 minutes. This is lower compared to the state median value.
The median response time in Bartlesville, OK compared to nearest cities:
(Note: Based on data for all years, including only cities with at least 500 fire incidents)
| Bartlesville: | 5 minutes |
| Dewey: | 7 minutes |
| Copan: | 10 minutes |
| Nowata: | 9 minutes |
| Pawhuska: | 5 minutes |
| Oologah: | 7 minutes |
| Skiatook: | 8 minutes |
| Collinsville: | 7 minutes |
| Coffeyville: | 5 minutes |
 Based on the reports from the years 2004 - 2018 the average number of fire-related yearly deaths is 1. The highest number of reported deaths - 5 took place in 2014, and the lowest - 0 in 2004. The data has a constant trend.
The average number of deaths per 1,000 fire incidents is 2. This indicator was the highest - 18 in 2014, and the lowest 0 in 2004. The trend for fatalities per 1,000 fire incidents is constant. Compared to the Oklahoma value the number of deaths per 1,000 fire incidents is higher.
Based on the reports from the years 2004 - 2018 the average number of fire-related yearly deaths is 1. The highest number of reported deaths - 5 took place in 2014, and the lowest - 0 in 2004. The data has a constant trend.
The average number of deaths per 1,000 fire incidents is 2. This indicator was the highest - 18 in 2014, and the lowest 0 in 2004. The trend for fatalities per 1,000 fire incidents is constant. Compared to the Oklahoma value the number of deaths per 1,000 fire incidents is higher.Deaths per 1,000 incidents in Bartlesville, OK compared to nearest cities:
(Note: Based on data for all years, including only cities with at least 2,500 fire incidents)
| Bartlesville: | 2.4 |
| Claremore: | 0.9 |
| Tulsa: | 3.1 |
| Sand Springs: | 1.6 |
 According to the reports from the years 2004 - 2018 the average number of fire-related casualties per year is 1. The highest number of injuries - 3 took place in 2010, and the lowest - 0 in 2004. The data has an increasing trend.
The average number of injuries per 1,000 fires is 2. This indicator was the highest - 13 in 2010, and the lowest 0 in 2004. The trend for injuries per 1,000 incidents is rising. Compared to the Oklahoma value the number of injuries per 1,000 fire incidents is lower.
According to the reports from the years 2004 - 2018 the average number of fire-related casualties per year is 1. The highest number of injuries - 3 took place in 2010, and the lowest - 0 in 2004. The data has an increasing trend.
The average number of injuries per 1,000 fires is 2. This indicator was the highest - 13 in 2010, and the lowest 0 in 2004. The trend for injuries per 1,000 incidents is rising. Compared to the Oklahoma value the number of injuries per 1,000 fire incidents is lower.Casualties per 1,000 incidents in Bartlesville, OK compared to nearest cities:
(Note: Based on data for all years, including only cities with at least 500 fire incidents)
| Bartlesville: | 2.4 |
| Dewey: | 0.0 |
| Copan: | 1.2 |
| Nowata: | 4.2 |
| Pawhuska: | 1.2 |
| Oologah: | 4.3 |
| Skiatook: | 0.0 |
| Collinsville: | 0.0 |
| Coffeyville: | 9.1 |
 25.7% incidents where reported in the morning and 74.3% in the evening. The most fires (17.2%) took place on Saturday, and the least (13.2%) on Monday.
 According to the 3,398 fire incidents from years 2004 - 2018 most fires (16.1%) took place during March, and the least (4.6%) in June.
 Out of all 18,691 cases reported during the years 2004 - 2018, the most belonged to the categories: Rescue & EMS (55.5%), Fire (18.2%), and Good Intent Call (7.9%).
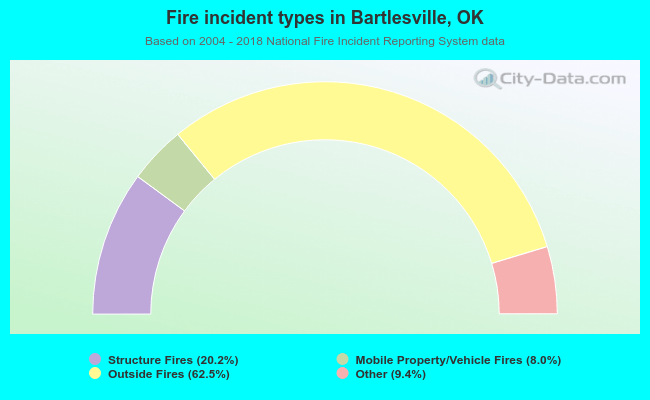 When looking into fire subcategories, the most incidents belonged to: Outside Fires (62.5%), and Structure Fires (20.2%).