Bastrop: Fire Incidents, Louisiana (LA)
Where are fire incidents reported in Bastrop, LA
Something went wrong! Please refresh the page.
| Fire incidents reported | |
|---|---|
| Sreet name | Count |
| MER ROUGE RD | 78 |
| PLEASANT DR | 76 |
| OLD BONITA RD | 72 |
| COOPER LAKE RD | 68 |
| COLLINSTON RD | 58 |
| CARBON PLANT RD | 56 |
| OLD MONROE RD | 46 |
| SHELTON RD | 44 |
| DOWD RD | 42 |
| MADISON AVE | 40 |
| CHERRY RIDGE RD | 38 |
| CROSSETT RD | 36 |
| 165 HWY | 32 |
| CROSSETT HWY | 32 |
| JACKSON ST | 32 |
| EAST MADISON | 30 |
| HARRINGTON AVE | 30 |
| GEORGE ST | 28 |
| ODOM ST | 28 |
| HUEY ST | 26 |
| HUEY | 24 |
| MARTIN LUTHER KING | 24 |
| NAFF AVE | 24 |
| PERRYVILLE RD | 24 |
| VAN AVE | 24 |
| CUTT OFF RD | 22 |
| GRABAULT RD | 22 |
| MAPLEWOOD DR | 22 |
| RIIS ST | 22 |
| W MADISON | 22 |
| Other | 977 |
2002 - 2018 National Fire Incident Reporting System (NFIRS) incidents
- Incident types reported to NFIRS in Bastrop, LA
- 2,09958.1%Fire
- 56615.7%Good Intent Call
- 42111.7%False Alarm
- 3048.4%Hazardous Condition
- 1133.1%Service Call
- 822.3%Rescue & EMS
- 110.3%Special Incident
- 80.2%Overpressure Rupture
- 70.2%Severe Weather
- Fire incident types reported to NFIRS in Bastrop, LA
- 85840.9%Structure Fires
- 84340.2%Outside Fires
- 29914.2%Mobile Property/Vehicle Fires
- 994.7%Other
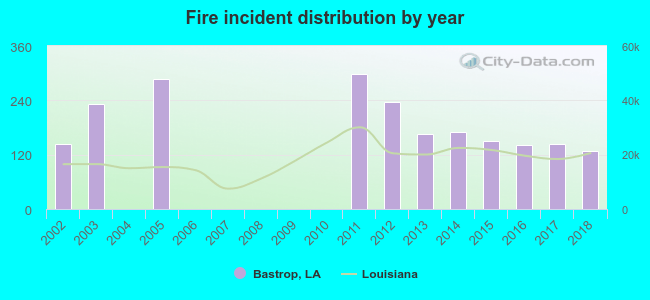 Based on the data from the years 2002 - 2018 the average number of fire incidents per year is 123. The highest number of reported fire incidents - 299 took place in 2011, and the least - 0 in 2004. The data has a decreasing trend.
The average number of yearly fire incidents per 10k residents in Bastrop, LA compared to nearest cities:
(Note: Based on data for the last 3 years, including only cities with population 5,000 and above)
| Bastrop: | 126.2 |
| Monroe: | 70.4 |
| West Monroe: | 210.8 |
| Ruston: | 42.6 |
| Tallulah: | 201.0 |
| Grambling: | 33.8 |
 The median response time based on all reported fire incidents is 4 minutes. This is lower than the Louisiana median value.
The median response time in Bastrop, LA compared to nearest cities:
(Note: Based on data for all years, including only cities with at least 500 fire incidents)
| Bastrop: | 4 minutes |
| Monroe: | 5 minutes |
| West Monroe: | 6 minutes |
| Rayville: | 5 minutes |
| Crossett: | 5 minutes |
| Farmerville: | 7 minutes |
| Oak Grove: | 10 minutes |
| Calhoun: | 7 minutes |
| Delhi: | 8 minutes |
 Based on the reports from the years 2002 - 2018 the average number of fire-related yearly deaths is 0. The highest number of reported deaths - 1 took place in 2005, and the lowest - 0 in 2002. The data has a constant trend.
 36.7% incidents where reported in the morning and 63.3% in the evening. The most fires (16.8%) took place on Saturday, and the least (12.8%) on Wednesday.
 Based on the 2,099 fires from years 2002 - 2018 most fires (11.2%) took place during January, and the least (6.1%) in November.
 Out of all 3,611 cases reported during the years 2002 - 2018, the most belonged to the categories: Fire (58.1%), Good Intent Call (15.7%), and False Alarm (11.7%).
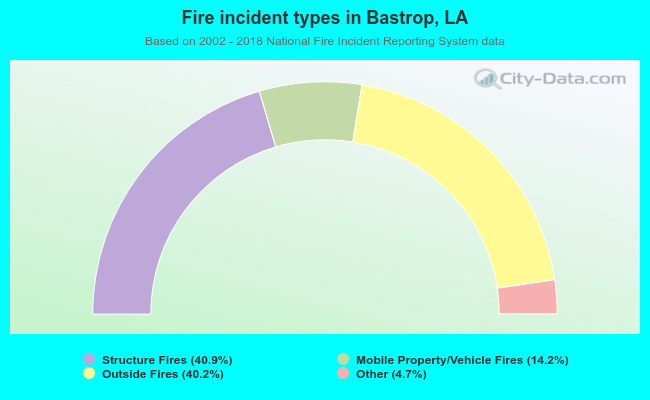 When looking into fire subcategories, the most reports belonged to: Structure Fires (40.9%), and Outside Fires (40.2%).