Ruston: Fire Incidents, Louisiana (LA)
Where are fire incidents reported in Ruston, LA
Something went wrong! Please refresh the page.
| Fire incidents reported | |
|---|---|
| Sreet name | Count |
| HIGHWAY 80 | 102 |
| BEACON LIGHT RD | 92 |
| HIGHWAY 33 | 84 |
| WATER TANK RD | 84 |
| HIGHWAY 818 | 72 |
| HIGHWAY 146 | 58 |
| BURGESSVILLE RD | 54 |
| ALABAMA AVE | 48 |
| MONDY RD | 46 |
| CALIFORNIA AVE | 42 |
| LONGSTRAW RD | 42 |
| FLETCHER LANE | 40 |
| GARR RD | 38 |
| ROUGH EDGE RD | 38 |
| SERVICE RD | 38 |
| TRENTON ST | 36 |
| INTERSTATE 20 | 34 |
| TARBUTTON RD | 30 |
| MITCHAM ORCHARD RD | 28 |
| VIENNA ST | 28 |
| MCDONALD AVE | 26 |
| SIMMONS RD | 26 |
| CHANDLER RD | 24 |
| EASTLAND AVE | 24 |
| FARMERVILLE HWY | 24 |
| FRAZIER RD | 24 |
| HIGHWAY 821 | 24 |
| CHEATWOOD RD | 22 |
| CHINA GROVE RD | 22 |
| HIGHWAY 167 | 22 |
| Other | 518 |
2002 - 2018 National Fire Incident Reporting System (NFIRS) incidents
- Incident types reported to NFIRS in Ruston, LA
- 3,87351.0%Rescue & EMS
- 1,79023.6%Fire
- 7089.3%False Alarm
- 6058.0%Hazardous Condition
- 4475.9%Good Intent Call
- 1221.6%Service Call
- 290.4%Overpressure Rupture
- 100.1%Severe Weather
- Fire incident types reported to NFIRS in Ruston, LA
- 85847.9%Outside Fires
- 54030.2%Structure Fires
- 34119.1%Mobile Property/Vehicle Fires
- 512.8%Other
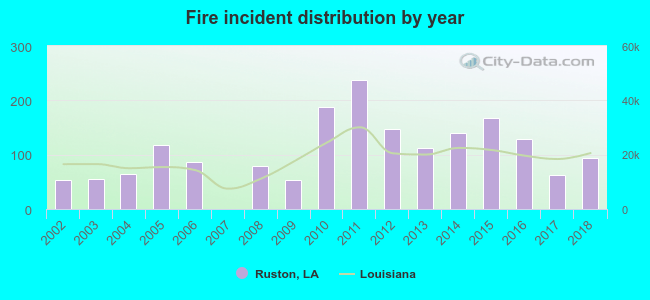 According to the data from the years 2002 - 2018 the average number of fire incidents per year is 105. The highest number of reported fires - 237 took place in 2011, and the least - 0 in 2007. The data has an increasing trend.
The average number of yearly fire incidents per 10k residents in Ruston, LA compared to nearest cities:
(Note: Based on data for the last 3 years, including only cities with population 5,000 and above)
| Ruston: | 42.6 |
| Grambling: | 33.8 |
| West Monroe: | 210.8 |
| Monroe: | 70.4 |
| Minden: | 91.1 |
| Bastrop: | 126.2 |
 The median response time based on all reported fire incidents is 6 minutes. This is about the same as the Louisiana median value.
The median response time in Ruston, LA compared to nearest cities:
(Note: Based on data for all years, including only cities with at least 500 fire incidents)
| Ruston: | 6 minutes |
| Choudrant: | 8 minutes |
| Simsboro: | 9 minutes |
| Dubach: | 9 minutes |
| Calhoun: | 7 minutes |
| Jonesboro: | 3 minutes |
| Farmerville: | 7 minutes |
| West Monroe: | 6 minutes |
| Homer: | 7 minutes |
 Based on the data from the years 2002 - 2018 the average number of fire-related fatalities per year is 0. The highest number of reported deaths - 2 took place in 2010, and the lowest - 0 in 2002. The data has a constant trend.
 According to the data from the years 2002 - 2018 the average number of fire-related yearly casualties is 1. The highest number of reported casualties - 3 took place in 2005, and the lowest - 0 in 2004. The data has a decreasing trend.
The average number of injuries per 1,000 fires is 10. This indicator was the highest - 37 in 2002, and the lowest 0 in 2004. The trend for injuries per 1,000 fires is declining. Compared to the state value the number of injuries per 1,000 incidents is higher.
According to the data from the years 2002 - 2018 the average number of fire-related yearly casualties is 1. The highest number of reported casualties - 3 took place in 2005, and the lowest - 0 in 2004. The data has a decreasing trend.
The average number of injuries per 1,000 fires is 10. This indicator was the highest - 37 in 2002, and the lowest 0 in 2004. The trend for injuries per 1,000 fires is declining. Compared to the state value the number of injuries per 1,000 incidents is higher.Casualties per 1,000 incidents in Ruston, LA compared to nearest cities:
(Note: Based on data for all years, including only cities with at least 500 fire incidents)
| Ruston: | 8.9 |
| Choudrant: | 1.7 |
| Simsboro: | 11.8 |
| Dubach: | 21.4 |
| Calhoun: | 10.8 |
| Jonesboro: | 1.7 |
| Farmerville: | 4.7 |
| West Monroe: | 4.6 |
| Homer: | 5.1 |
 30.9% incidents where reported in the morning and 69.1% in the evening. The most fires (15.6%) took place on Wednesday, and the least (12.2%) on Friday.
 According to the 1,790 fire incident reports from years 2002 - 2018 most fires (12.3%) took place during January, and the least (5.6%) in November.
 Out of all 7,591 cases reported during the years 2002 - 2018, the most belonged to the categories: Rescue & EMS (51.0%), Fire (23.6%), and False Alarm (9.3%).
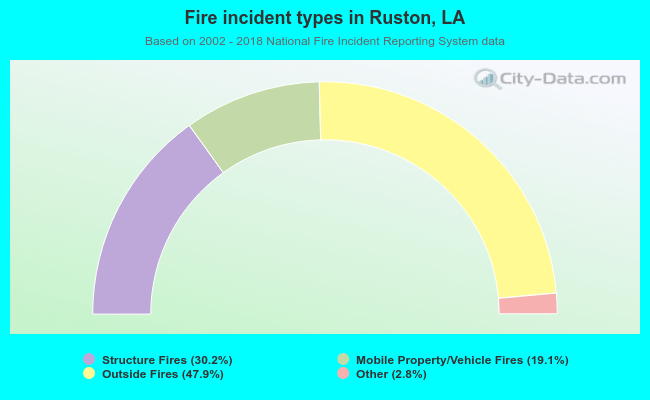 When looking into fire subcategories, the most incidents belonged to: Outside Fires (47.9%), and Structure Fires (30.2%).