West Monroe: Fire Incidents, Louisiana (LA)
Where are fire incidents reported in West Monroe, LA
Something went wrong! Please refresh the page.
| Fire incidents reported | |
|---|---|
| Sreet name | Count |
| CYPRESS ST | 318 |
| NEW NATCHITOCHES RD | 282 |
| JONESBORO RD | 232 |
| ARKANSAS RD | 198 |
| WASHINGTON ST | 156 |
| CAPLES RD | 140 |
| EVERGREEN ST | 136 |
| HIGHWAY 3033 | 120 |
| WHITES FERRY RD | 120 |
| OLIVE ST | 102 |
| PINK ST | 102 |
| SMITH ST | 102 |
| 7TH ST | 94 |
| THOMAS RD | 86 |
| PUCKETT LAKE RD | 80 |
| WELL RD | 80 |
| HIGHWAY 546 | 72 |
| LILAC ST | 72 |
| EDWARDS RD | 70 |
| OLD NATCHITOCHES RD | 70 |
| WINNFIELD RD | 68 |
| INTERSTATE 20 W | 66 |
| WALLACE DEAN RD | 66 |
| BAWCOM ST | 64 |
| PHILPOT RD | 62 |
| AVANT RD | 60 |
| INTERSTATE 20 E | 60 |
| HIGHWAY 15 | 58 |
| HIGHWAY 34 | 58 |
| HIGHWAY 557 | 58 |
| Other | 2,236 |
2002 - 2018 National Fire Incident Reporting System (NFIRS) incidents
- Incident types reported to NFIRS in West Monroe, LA
- 17,89553.9%Rescue & EMS
- 5,48816.5%Fire
- 4,67414.1%Good Intent Call
- 2,5337.6%Service Call
- 1,3684.1%Hazardous Condition
- 1,1693.5%False Alarm
- 400.1%Severe Weather
- Fire incident types reported to NFIRS in West Monroe, LA
- 3,07756.1%Outside Fires
- 1,65330.1%Structure Fires
- 67112.2%Mobile Property/Vehicle Fires
- 871.6%Other
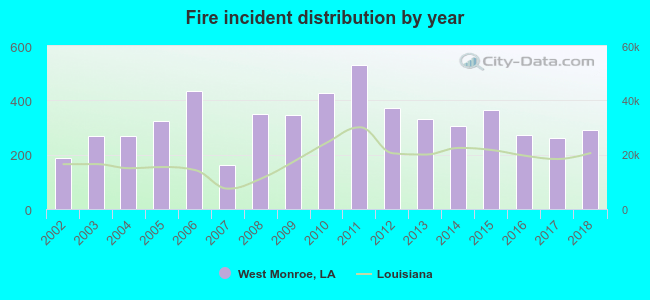 According to the data from the years 2002 - 2018 the average number of fire incidents per year is 323. The highest number of reported fire incidents - 529 took place in 2011, and the least - 161 in 2007. The data has a growing trend.
 The median response time based on all reported fire incidents is 6 minutes. This is about the same as the state median value.
The median response time in West Monroe, LA compared to nearest cities:
(Note: Based on data for all years, including only cities with at least 500 fire incidents)
| West Monroe: | 6 minutes |
| Monroe: | 5 minutes |
| Calhoun: | 7 minutes |
| Choudrant: | 8 minutes |
| Rayville: | 5 minutes |
| Bastrop: | 4 minutes |
| Farmerville: | 7 minutes |
| Ruston: | 6 minutes |
| Dubach: | 9 minutes |
 Based on the reports from the years 2002 - 2018 the average number of fire-related fatalities per year is 1. The highest number of deaths - 4 took place in 2013, and the lowest - 0 in 2002. The data has an increasing trend.
The average number of deaths per 1,000 fire incidents is 3. This indicator was the highest - 12 in 2013, and the lowest 0 in 2002. The trend for fatalities per 1,000 incidents is growing. Compared to the state value the number of deaths per 1,000 fires is higher.
Based on the reports from the years 2002 - 2018 the average number of fire-related fatalities per year is 1. The highest number of deaths - 4 took place in 2013, and the lowest - 0 in 2002. The data has an increasing trend.
The average number of deaths per 1,000 fire incidents is 3. This indicator was the highest - 12 in 2013, and the lowest 0 in 2002. The trend for fatalities per 1,000 incidents is growing. Compared to the state value the number of deaths per 1,000 fires is higher.Deaths per 1,000 incidents in West Monroe, LA compared to nearest cities:
(Note: Based on data for all years, including only cities with at least 2,500 fire incidents)
| West Monroe: | 2.7 |
| Monroe: | 2.0 |
 Based on the reports from the years 2002 - 2018 the average number of fire-related yearly casualties is 1. The highest number of injuries - 6 took place in 2017, and the lowest - 0 in 2002. The data has a growing trend.
The average number of injuries per 1,000 fires is 5. This indicator was the highest - 23 in 2017, and the lowest 0 in 2002. The trend for casualties per 1,000 fires is growing. Compared to the state value the number of casualties per 1,000 incidents is lower.
Based on the reports from the years 2002 - 2018 the average number of fire-related yearly casualties is 1. The highest number of injuries - 6 took place in 2017, and the lowest - 0 in 2002. The data has a growing trend.
The average number of injuries per 1,000 fires is 5. This indicator was the highest - 23 in 2017, and the lowest 0 in 2002. The trend for casualties per 1,000 fires is growing. Compared to the state value the number of casualties per 1,000 incidents is lower.
 26.3% incidents where reported in the morning and 73.7% in the evening. The most fires (15.3%) took place on Saturday, and the least (13.3%) on Wednesday.
 Based on the 5,488 fire incidents from years 2002 - 2018 most fires (12.1%) took place during January, and the least (5.8%) in June.
 Out of all 33,199 cases reported during the years 2002 - 2018, the most belonged to the categories: Rescue & EMS (53.9%), Fire (16.5%), and Good Intent Call (14.1%).
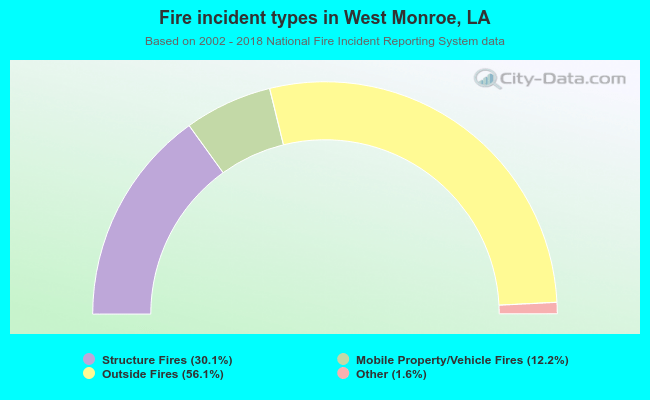 When looking into fire subcategories, the most incidents belonged to: Outside Fires (56.1%), and Structure Fires (30.1%).