Bel Aire: Fire Incidents, Kansas (KS)
Where are fire incidents reported in Bel Aire, KS
Something went wrong! Please refresh the page.
|
| |||||||||||||||||||||||||||||||||||||||||||||||||||||||||||||||||||||||||||||||||||||||||||||||||||||||||||||
2002 - 2018 National Fire Incident Reporting System (NFIRS) incidents
- Incident types reported to NFIRS in Bel Aire, KS
- 1,41956.9%Rescue & EMS
- 27611.1%Good Intent Call
- 25410.2%Fire
- 2429.7%Service Call
- 1496.0%False Alarm
- 1465.9%Hazardous Condition
- 30.1%Overpressure Rupture
- Fire incident types reported to NFIRS in Bel Aire, KS
- 12047.2%Outside Fires
- 9537.4%Structure Fires
- 3313.0%Mobile Property/Vehicle Fires
- 62.4%Other
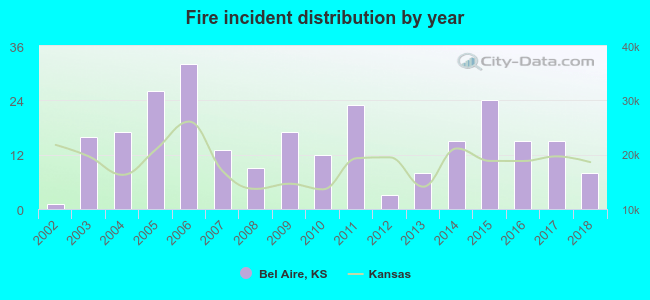 According to the data from the years 2002 - 2018 the average number of fire incidents per year is 15. The highest number of reported fire incidents - 32 took place in 2006, and the least - 1 in 2002. The data has an increasing trend.
The average number of yearly fire incidents per 10k residents in Bel Aire, KS compared to nearest cities:
(Note: Based on data for the last 3 years, including only cities with population 5,000 and above)
| Bel Aire: | 17.4 |
| Park City: | 41.9 |
| Wichita: | 48.0 |
| Valley Center: | 119.5 |
| Andover: | 51.4 |
| Derby: | 66.0 |
| Haysville: | 53.7 |
| Augusta: | 154.4 |
| Mulvane: | 130.9 |
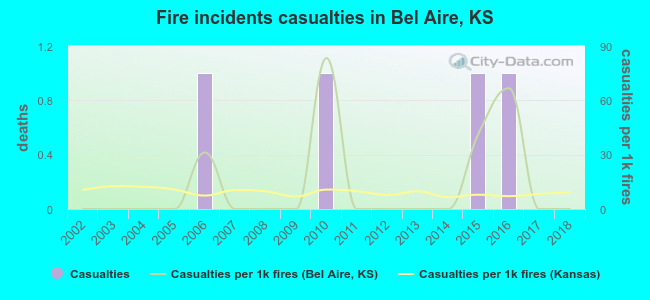 According to the data from the years 2002 - 2018 the average number of fire-related casualties per year is 0. The highest number of reported casualties - 1 took place in 2006, and the lowest - 0 in 2002. The data has a constant trend.
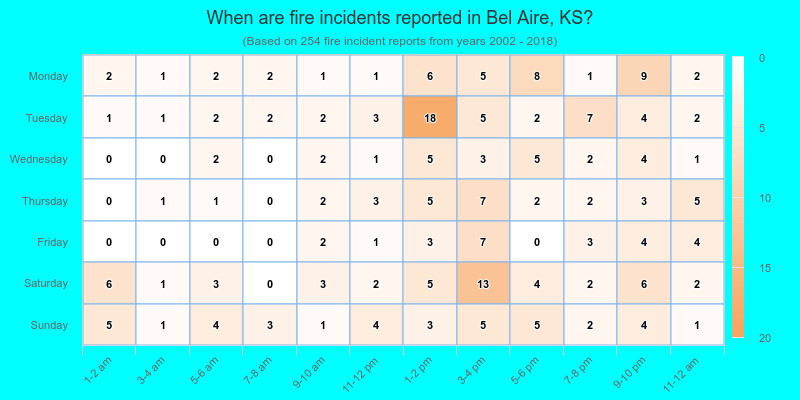
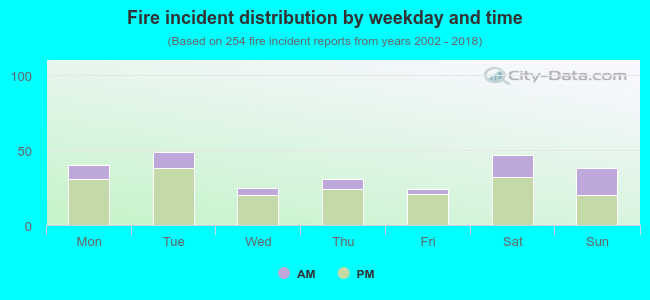 26.8% incidents where reported in the morning and 73.2% in the evening. The most fires (19.3%) took place on Tuesday, and the least (9.4%) on Friday.
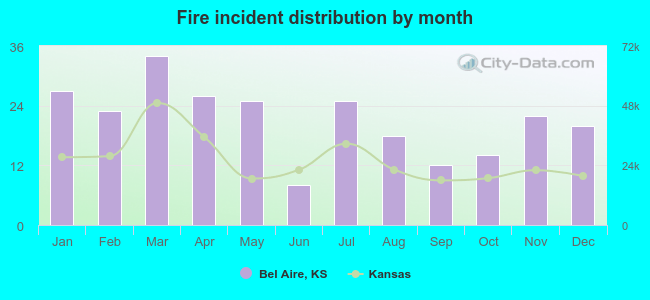 Based on the 254 fire incident reports from years 2002 - 2018 most fires (13.4%) took place during March, and the least (3.1%) in June.
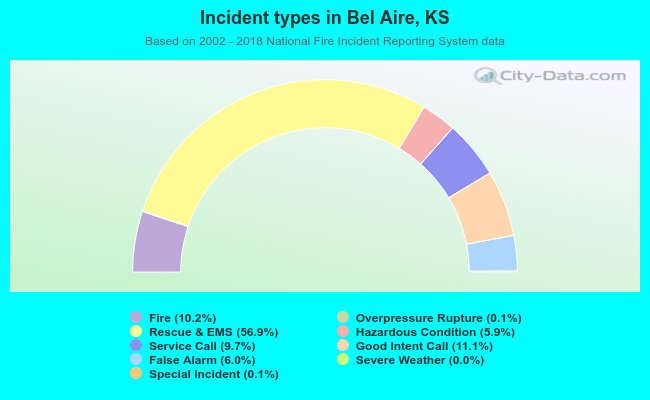 Out of all 2,492 cases reported during the years 2002 - 2018, the most belonged to the categories: Rescue & EMS (56.9%), Good Intent Call (11.1%), and Fire (10.2%).
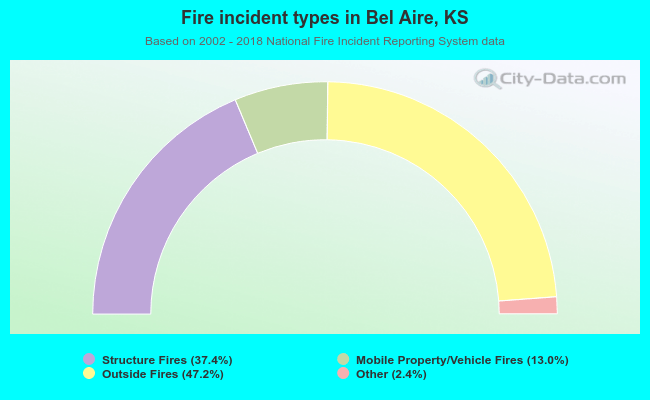 When looking into fire subcategories, the most reports belonged to: Outside Fires (47.2%), and Structure Fires (37.4%).