Valley Center: Fire Incidents, Kansas (KS)
Where are fire incidents reported in Valley Center, KS
Something went wrong! Please refresh the page.
| Fire incidents reported | |
|---|---|
| Sreet name | Count |
| 85TH ST | 114 |
| MERIDIAN | 112 |
| 101ST ST | 94 |
| 77TH ST | 88 |
| BROADWAY ST | 74 |
| BROADWAY AVE | 72 |
| 93 N | 64 |
| 93RD ST | 62 |
| 101 N | 48 |
| 109TH ST | 46 |
| RIDGE RD | 46 |
| SENECA ST | 46 |
| 69TH ST | 40 |
| I-135 HWY | 38 |
| 77 N | 36 |
| 117TH ST | 34 |
| 71ST ST | 34 |
| 85 N | 34 |
| ABILENE AVE | 34 |
| 125TH ST | 32 |
| 47TH ST | 32 |
| HILLSIDE AVE | 30 |
| MERIDIAN AVE | 30 |
| HYDRAULIC AVE | 28 |
| INTERURBAN | 28 |
| MERIDIAN ST | 28 |
| 109 N | 26 |
| 111TH ST | 26 |
| 127TH ST | 26 |
| I135 HWY | 26 |
| Other | 110 |
2002 - 2018 National Fire Incident Reporting System (NFIRS) incidents
- Incident types reported to NFIRS in Valley Center, KS
- 1,81427.4%Rescue & EMS
- 1,53823.2%Fire
- 1,14817.3%Good Intent Call
- 81312.3%Special Incident
- 69610.5%Hazardous Condition
- 3935.9%Service Call
- 1942.9%False Alarm
- 190.3%Severe Weather
- Fire incident types reported to NFIRS in Valley Center, KS
- 1,07069.6%Outside Fires
- 25716.7%Structure Fires
- 17911.6%Mobile Property/Vehicle Fires
- 322.1%Other
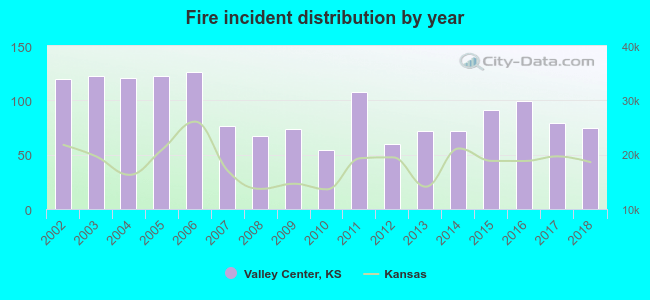 According to the data from the years 2002 - 2018 the average number of fire incidents per year is 90. The highest number of reported fire incidents - 126 took place in 2006, and the least - 54 in 2010. The data has a dropping trend.
The average number of yearly fire incidents per 10k residents in Valley Center, KS compared to nearest cities:
(Note: Based on data for the last 3 years, including only cities with population 5,000 and above)
| Valley Center: | 119.5 |
| Park City: | 41.9 |
| Bel Aire: | 17.4 |
| Wichita: | 48.0 |
| Newton: | 59.3 |
| Andover: | 51.4 |
| Haysville: | 53.7 |
| Derby: | 66.0 |
| Augusta: | 154.4 |
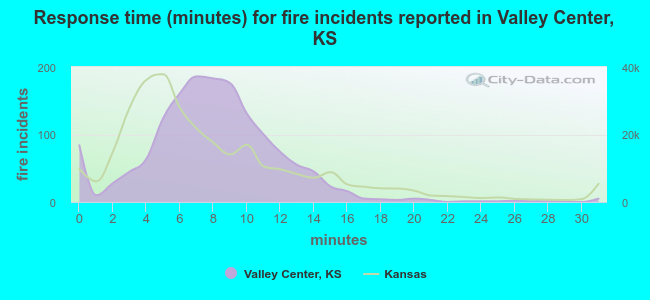 The median response time based on all reported fire incidents is 8 minutes. This is higher compared to the Kansas median value.
The median response time in Valley Center, KS compared to nearest cities:
(Note: Based on data for all years, including only cities with at least 500 fire incidents)
| Valley Center: | 8 minutes |
| Wichita: | 4 minutes |
| Halstead: | 6 minutes |
| Benton: | 10 minutes |
| Newton: | 7 minutes |
| Andover: | 5 minutes |
| Goddard: | 7 minutes |
| Haysville: | 6 minutes |
| Derby: | 5 minutes |
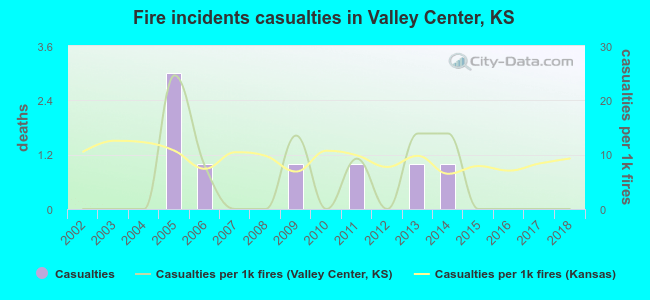 Based on the reports from the years 2002 - 2018 the average number of fire-related casualties per year is 0. The highest number of reported injuries - 3 took place in 2005, and the lowest - 0 in 2002. The data has a constant trend.
The average number of injuries per 1,000 fires is 5. This indicator was the highest - 25 in 2005, and the lowest 0 in 2002. The trend for injuries per 1,000 fires is constant. Compared to the Kansas value the number of injuries per 1,000 fires is lower.
Based on the reports from the years 2002 - 2018 the average number of fire-related casualties per year is 0. The highest number of reported injuries - 3 took place in 2005, and the lowest - 0 in 2002. The data has a constant trend.
The average number of injuries per 1,000 fires is 5. This indicator was the highest - 25 in 2005, and the lowest 0 in 2002. The trend for injuries per 1,000 fires is constant. Compared to the Kansas value the number of injuries per 1,000 fires is lower.
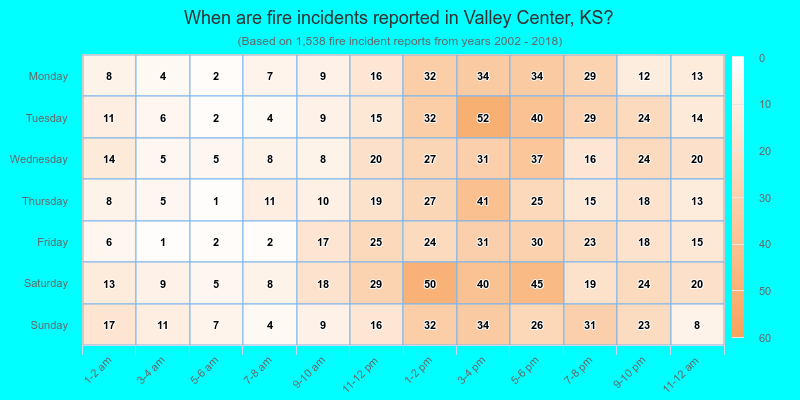
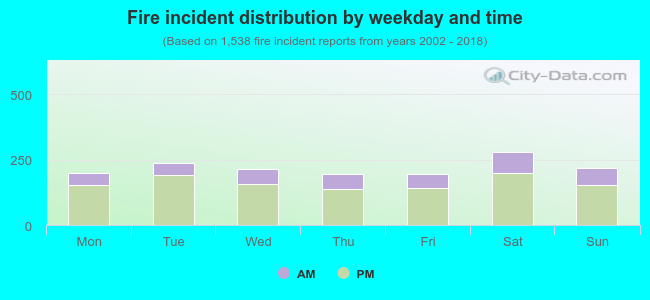 26.4% incidents where reported in the morning and 73.6% in the evening. The most fires (18.2%) took place on Saturday, and the least (12.5%) on Thursday.
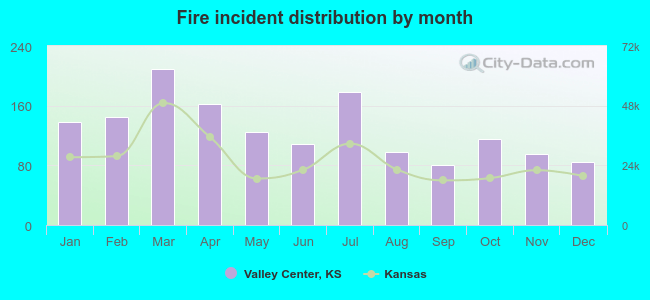 Based on the 1,538 fire incident reports from years 2002 - 2018 most fires (13.6%) took place during March, and the least (5.2%) in September.
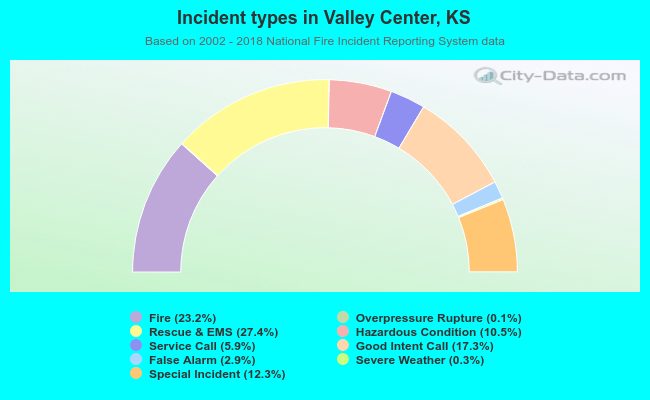 Out of all 6,620 cases reported during the years 2002 - 2018, the most belonged to the categories: Rescue & EMS (27.4%), Fire (23.2%), and Good Intent Call (17.3%).
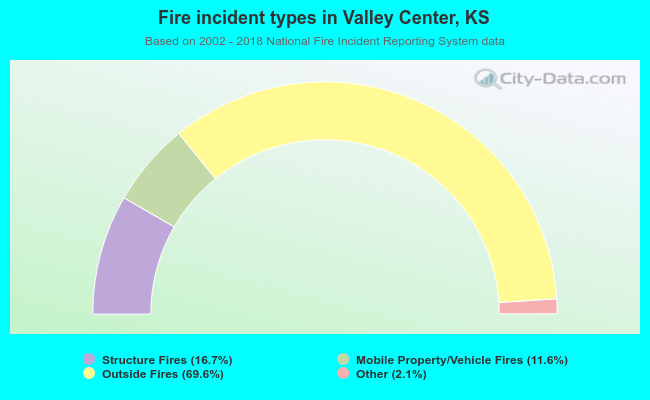 When looking into fire subcategories, the most reports belonged to: Outside Fires (69.6%), and Structure Fires (16.7%).