Bella Vista: Fire Incidents, Arkansas (AR)
Where are fire incidents reported in Bella Vista, AR
Something went wrong! Please refresh the page.
| Fire incidents reported | |
|---|---|
| Sreet name | Count |
| SKYLINE DR | 40 |
| BELLA VISTA WAY | 38 |
| MCNELLY RD | 34 |
| FOREST HILLS BLVD | 18 |
| LEICESTER DR | 18 |
| KENSINGTON DR | 16 |
| SUITS US DR | 16 |
| BILLINGSLEY DR | 12 |
| CIEMNY LN | 12 |
| DUVALL LN | 12 |
| EVESHAM LN | 12 |
| LOOKOUT DR | 12 |
| MELANIE DR | 12 |
| SPANKER RD | 12 |
| BASILDON DR | 10 |
| CHELSEA LN | 10 |
| HIGHLANDS BLVD | 10 |
| HOPE DR | 10 |
| LANCASHIRE BLVD | 10 |
| MAYFAIR DR | 10 |
| RIORDAN RD | 10 |
| ROCHDALE DR | 10 |
| ULVERSTON DR | 10 |
| ALDERSHOT DR | 8 |
| BASORE DR | 8 |
| BENTON COUNTY 40 | 8 |
| BROMPTON LN | 8 |
| CHAPEL LN | 8 |
| DARTMOOR RD | 8 |
| ELIZABETH DR | 8 |
| Other | 662 |
2003 - 2018 National Fire Incident Reporting System (NFIRS) incidents
- Incident types reported to NFIRS in Bella Vista, AR
- 8,76766.0%Rescue & EMS
- 1,83113.8%Service Call
- 1,0728.1%Fire
- 6685.0%Good Intent Call
- 5974.5%Hazardous Condition
- 3212.4%False Alarm
- Fire incident types reported to NFIRS in Bella Vista, AR
- 55551.8%Outside Fires
- 36534.0%Structure Fires
- 1039.6%Mobile Property/Vehicle Fires
- 494.6%Other
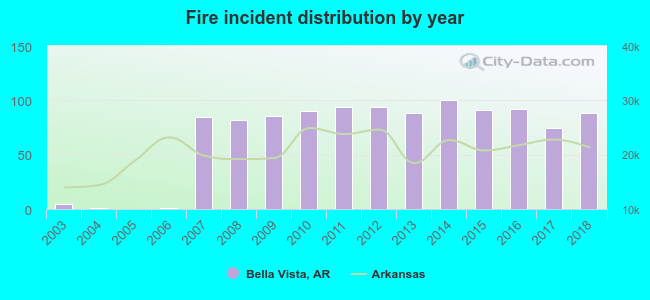 Based on the data from the years 2003 - 2018 the average number of fires per year is 67. The highest number of reported fires - 100 took place in 2014, and the least - 0 in 2005. The data has an increasing trend.
The average number of yearly fire incidents per 10k residents in Bella Vista, AR compared to nearest cities:
(Note: Based on data for the last 3 years, including only cities with population 5,000 and above)
| Bella Vista: | 30.7 |
| Centerton: | 41.7 |
| Bentonville: | 36.0 |
| Pea Ridge: | 27.4 |
| Rogers: | 34.1 |
| Lowell: | 81.2 |
| Springdale: | 34.6 |
| Siloam Springs: | 56.9 |
| Fayetteville: | 40.9 |
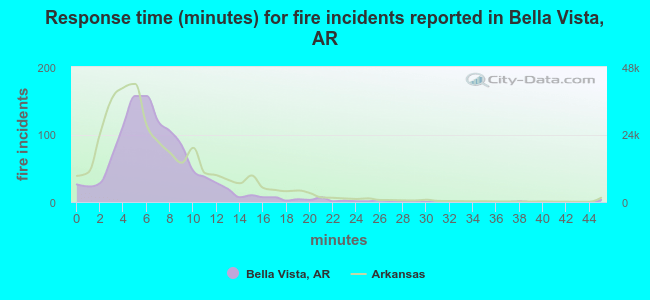 The median response time based on all reported fire incidents is 6 minutes. This is about the same as the state median value.
The median response time in Bella Vista, AR compared to nearest cities:
(Note: Based on data for all years, including only cities with at least 500 fire incidents)
| Bella Vista: | 6 minutes |
| Centerton: | 6 minutes |
| Bentonville: | 5 minutes |
| Pea Ridge: | 9 minutes |
| Rogers: | 6 minutes |
| Lowell: | 5 minutes |
| Garfield: | 12 minutes |
| Gentry: | 8 minutes |
| Springdale: | 5 minutes |
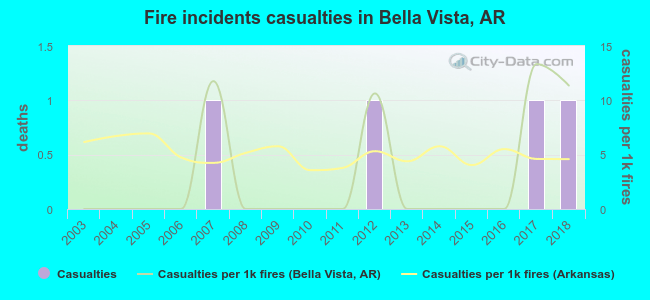 Based on the data from the years 2003 - 2018 the average number of fire-related yearly casualties is 0. The highest number of reported injuries - 1 took place in 2007, and the lowest - 0 in 2003. The data has a rising trend.
The average number of injuries per 1,000 fire incidents is 3. This indicator was the highest - 13 in 2017, and the lowest 0 in 2003. The trend for injuries per 1,000 fire incidents is growing. Compared to the Arkansas value the number of injuries per 1,000 fire incidents is lower.
Based on the data from the years 2003 - 2018 the average number of fire-related yearly casualties is 0. The highest number of reported injuries - 1 took place in 2007, and the lowest - 0 in 2003. The data has a rising trend.
The average number of injuries per 1,000 fire incidents is 3. This indicator was the highest - 13 in 2017, and the lowest 0 in 2003. The trend for injuries per 1,000 fire incidents is growing. Compared to the Arkansas value the number of injuries per 1,000 fire incidents is lower.Casualties per 1,000 incidents in Bella Vista, AR compared to nearest cities:
(Note: Based on data for all years, including only cities with at least 500 fire incidents)
| Bella Vista: | 3.7 |
| Centerton: | 0.0 |
| Bentonville: | 8.7 |
| Pea Ridge: | 4.0 |
| Rogers: | 9.7 |
| Lowell: | 1.3 |
| Garfield: | 3.5 |
| Gentry: | 3.6 |
| Springdale: | 17.8 |
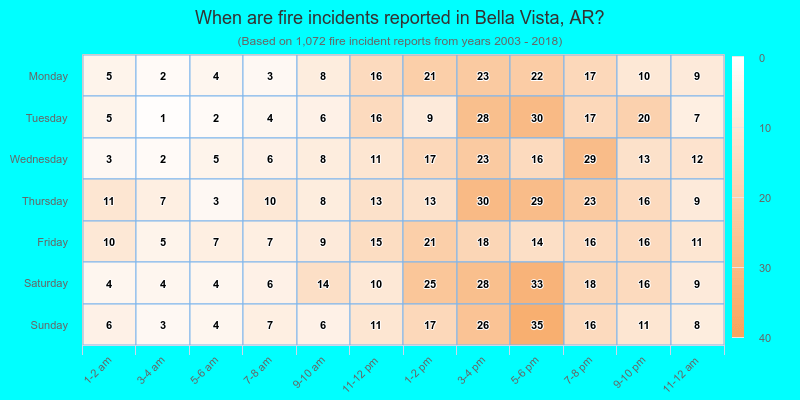
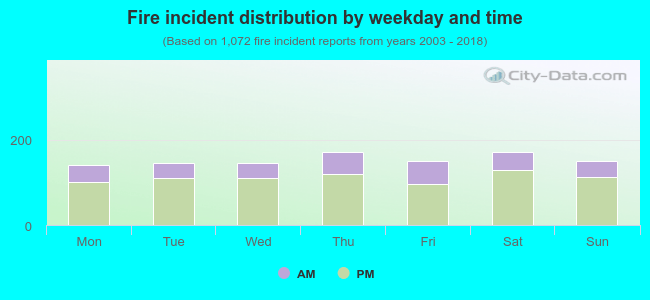 27.1% incidents where reported in the morning and 72.9% in the evening. The most fires (16.0%) took place on Thursday, and the least (13.1%) on Monday.
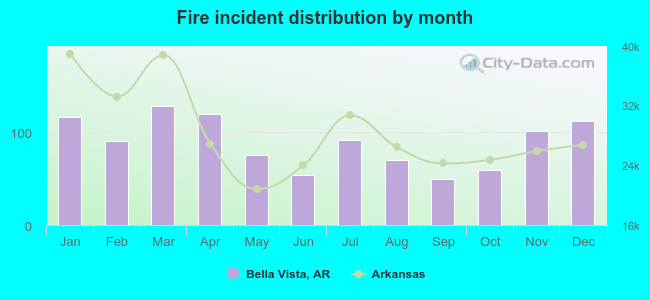 According to the 1,072 fire incident reports from years 2003 - 2018 most fires (12.0%) took place during March, and the least (4.7%) in September.
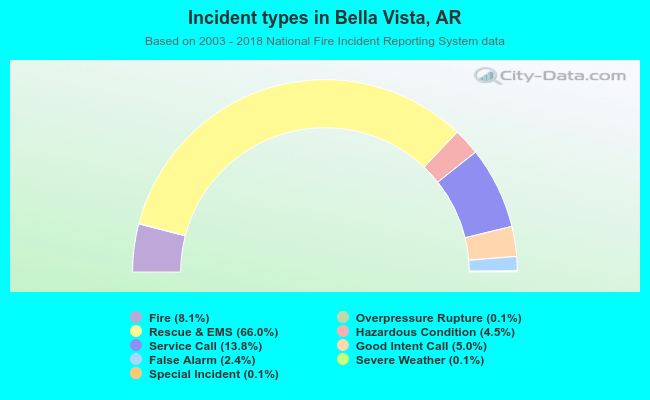 Out of all 13,285 cases reported during the years 2003 - 2018, the most belonged to the categories: Rescue & EMS (66.0%), Service Call (13.8%), and Fire (8.1%).
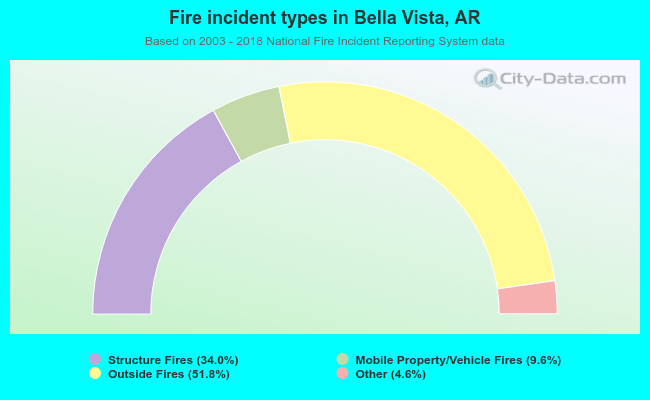 When looking into fire subcategories, the most incidents belonged to: Outside Fires (51.8%), and Structure Fires (34.0%).