Belle Glade: Fire Incidents, Florida (FL)
Where are fire incidents reported in Belle Glade, FL
Something went wrong! Please refresh the page.
| Fire incidents reported | |
|---|---|
| Sreet name | Count |
| CANAL ST | 94 |
| MAIN ST | 94 |
| 5TH ST | 58 |
| 6TH ST | 48 |
| AVENUE D | 48 |
| 16TH ST | 46 |
| AVENUE A | 42 |
| PALM GLADE DR | 40 |
| 11TH ST | 38 |
| 2ND ST | 38 |
| 8TH ST | 38 |
| AVENUE L | 38 |
| 10TH ST | 36 |
| 1ST ST | 36 |
| 9TH ST | 34 |
| STATE ROAD 715 | 34 |
| STATE ROAD 80 | 32 |
| 3RD ST | 30 |
| 4TH ST | 30 |
| AVENUE B | 28 |
| COVENANT DR | 26 |
| MARTIN LUTHER KING BLVD | 22 |
| AVENUE C | 20 |
| DR MARTIN LUTHER KING JR BLVD | 20 |
| 15TH ST | 18 |
| 7TH ST | 18 |
| AVENUE F | 18 |
| 20TH ST | 16 |
| AVENUE G | 16 |
| COUNTY ROAD 880 | 16 |
2002 - 2018 National Fire Incident Reporting System (NFIRS) incidents
- Incident types reported to NFIRS in Belle Glade, FL
- 9,20670.6%Rescue & EMS
- 1,41410.8%Good Intent Call
- 8276.3%Fire
- 6975.3%Service Call
- 4743.6%False Alarm
- 3893.0%Hazardous Condition
- 310.2%Special Incident
- Fire incident types reported to NFIRS in Belle Glade, FL
- 38246.2%Outside Fires
- 26832.4%Structure Fires
- 16319.7%Mobile Property/Vehicle Fires
- 141.7%Other
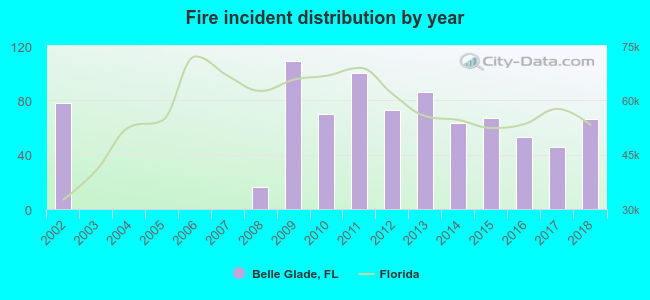 According to the data from the years 2002 - 2018 the average number of fires per year is 49. The highest number of fire incidents - 109 took place in 2009, and the least - 0 in 2003. The data has a decreasing trend.
The average number of yearly fire incidents per 10k residents in Belle Glade, FL compared to nearest cities:
(Note: Based on data for the last 3 years, including only cities with population 5,000 and above)
| Belle Glade: | 30.5 |
| South Bay: | 29.2 |
| Pahokee: | 36.5 |
| Glades: | 0.5 |
| Clewiston: | 226.9 |
| Wellington: | 8.3 |
| Indiantown: | 54.2 |
| Royal Palm Beach: | 11.2 |
| Greenacres: | 14.3 |
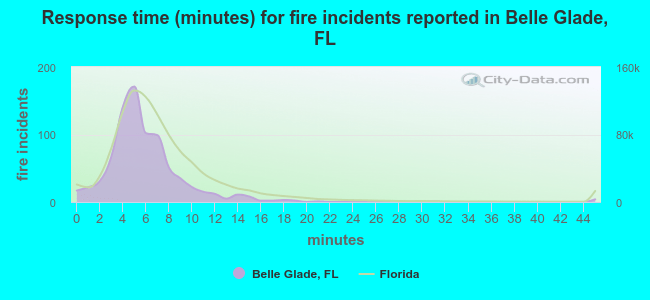 The median response time based on all reported fire incidents is 5 minutes. This is lower compared to the Florida median value.
The median response time in Belle Glade, FL compared to nearest cities:
(Note: Based on data for all years, including only cities with at least 500 fire incidents)
| Belle Glade: | 5 minutes |
| Clewiston: | 8 minutes |
| Wellington: | 7 minutes |
| Greenacres: | 5 minutes |
| Palm Beach Gardens: | 6 minutes |
| West Palm Beach: | 6 minutes |
| Riviera Beach: | 5 minutes |
| Lake Worth: | 6 minutes |
| Boynton Beach: | 5 minutes |
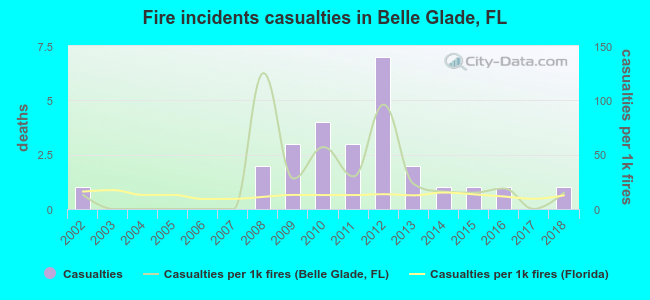 According to the reports from the years 2002 - 2018 the average number of fire-related casualties per year is 2. The highest number of injuries - 7 took place in 2012, and the lowest - 0 in 2003. The data has a constant trend.
The average number of casualties per 1,000 fires is 26. This indicator was the highest - 125 in 2008, and the lowest 0 in 2003. The trend for injuries per 1,000 fires is growing. Compared to the Florida value the number of injuries per 1,000 incidents is much higher.
According to the reports from the years 2002 - 2018 the average number of fire-related casualties per year is 2. The highest number of injuries - 7 took place in 2012, and the lowest - 0 in 2003. The data has a constant trend.
The average number of casualties per 1,000 fires is 26. This indicator was the highest - 125 in 2008, and the lowest 0 in 2003. The trend for injuries per 1,000 fires is growing. Compared to the Florida value the number of injuries per 1,000 incidents is much higher.Casualties per 1,000 incidents in Belle Glade, FL compared to nearest cities:
(Note: Based on data for all years, including only cities with at least 500 fire incidents)
| Belle Glade: | 31.4 |
| Clewiston: | 2.3 |
| Wellington: | 29.8 |
| Greenacres: | 34.9 |
| Palm Beach Gardens: | 4.4 |
| West Palm Beach: | 23.5 |
| Riviera Beach: | 50.2 |
| Lake Worth: | 38.4 |
| Boynton Beach: | 17.3 |
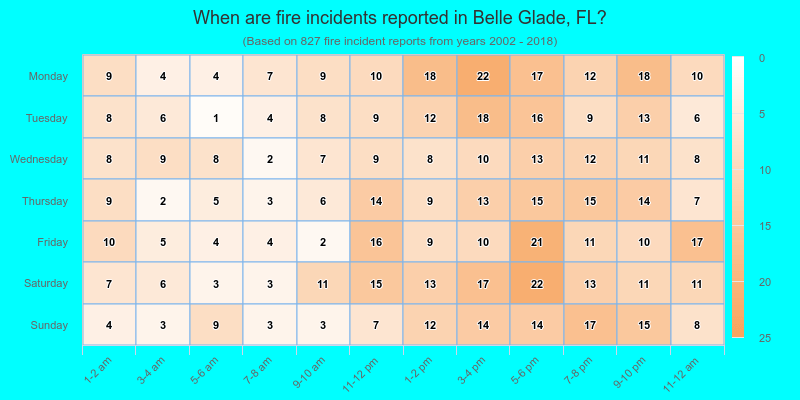
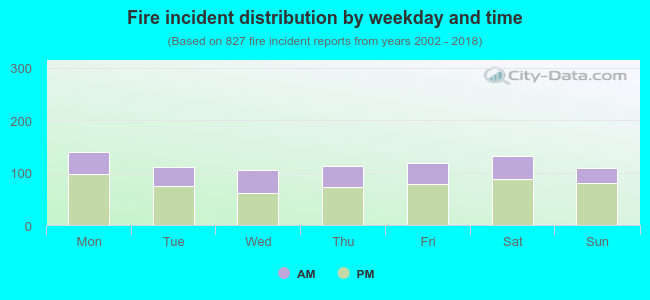 33.4% incidents where reported in the morning and 66.6% in the evening. The most fires (16.9%) took place on Monday, and the least (12.7%) on Wednesday.
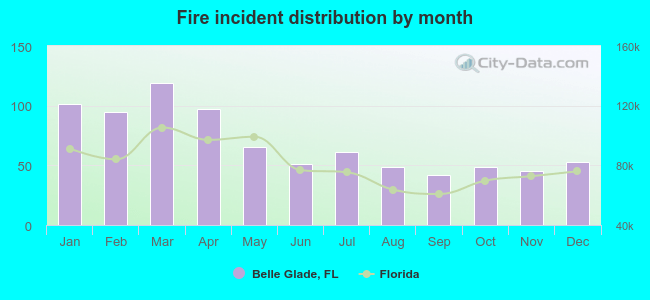 According to the 827 reports from years 2002 - 2018 most fires (14.4%) took place during March, and the least (5.1%) in September.
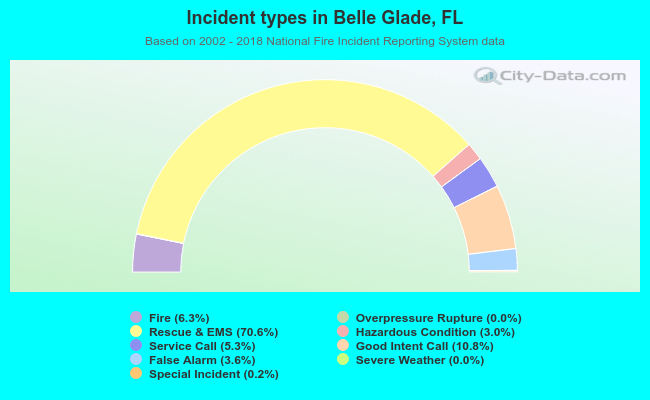 Out of all 13,044 cases reported during the years 2002 - 2018, the most belonged to the categories: Rescue & EMS (70.6%), Good Intent Call (10.8%), and Fire (6.3%).
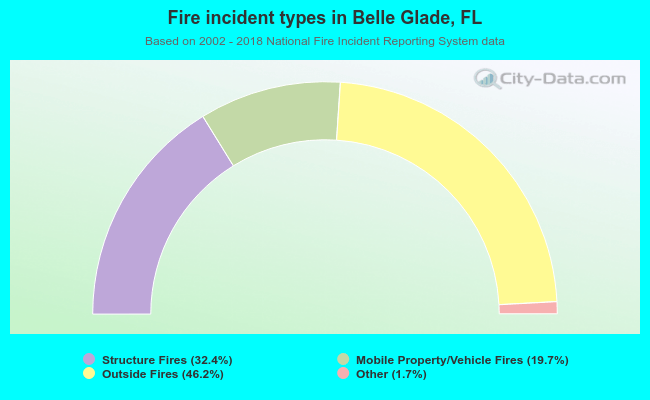 When looking into fire subcategories, the most incidents belonged to: Outside Fires (46.2%), and Structure Fires (32.4%).