Bellevue: Fire Incidents, Kentucky (KY)
Where are fire incidents reported in Bellevue, KY
Something went wrong! Please refresh the page.
|
| |||||||||||||||||||||||||||||||||||||||||||||||||||||||||||||||||||||||||||||||||||||||||||||||||||||||||||||
2002 - 2018 National Fire Incident Reporting System (NFIRS) incidents
- Incident types reported to NFIRS in Bellevue, KY
- 64133.7%Rescue & EMS
- 45123.7%Hazardous Condition
- 26714.0%Fire
- 25913.6%Service Call
- 1739.1%False Alarm
- 834.4%Good Intent Call
- 201.1%Severe Weather
- 40.2%Special Incident
- 30.2%Overpressure Rupture
- Fire incident types reported to NFIRS in Bellevue, KY
- 11342.3%Outside Fires
- 11041.2%Structure Fires
- 3814.2%Mobile Property/Vehicle Fires
- 62.2%Other
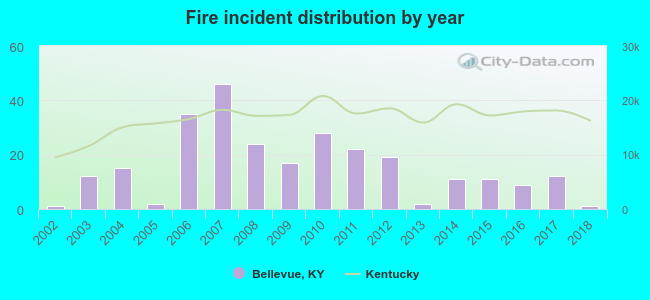 Based on the data from the years 2002 - 2018 the average number of fire incidents per year is 16. The highest number of reported fire incidents - 46 took place in 2007, and the least - 1 in 2002. The data has a constant trend.
The average number of yearly fire incidents per 10k residents in Bellevue, KY compared to nearest cities:
(Note: Based on data for the last 3 years, including only cities with population 5,000 and above)
| Bellevue: | 12.4 |
| Dayton: | 30.1 |
| Newport: | 44.7 |
| Fort Thomas: | 0.6 |
| Covington: | 49.4 |
| Highland Heights: | 13.4 |
| Fort Wright: | 20.3 |
| Fort Mitchell: | 26.6 |
| Taylor Mill: | 24.8 |

 According to the data from the years 2002 - 2018 the average number of fire-related yearly casualties is 0. The highest number of injuries - 4 took place in 2007, and the lowest - 0 in 2002. The data has a constant trend.
 30.7% incidents where reported in the morning and 69.3% in the evening. The most fires (16.5%) took place on Thursday, and the least (11.6%) on Friday.
 According to the 267 incident reports from years 2002 - 2018 most fires (12.0%) took place during May, and the least (5.2%) in September.
 Out of all 1,901 cases reported during the years 2002 - 2018, the most belonged to the categories: Rescue & EMS (33.7%), Hazardous Condition (23.7%), and Fire (14.0%).
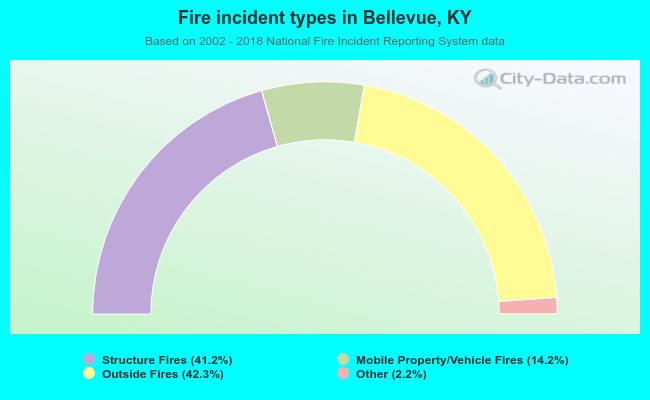 When looking into fire subcategories, the most incidents belonged to: Outside Fires (42.3%), and Structure Fires (41.2%).