Bellmore: Fire Incidents, New York (NY)
Where are fire incidents reported in Bellmore, NY
Something went wrong! Please refresh the page.
|
| |||||||||||||||||||||||||||||||||||||||||||||||||||||||||||||||||||||||||||||||||||||||||||||||||||||||||||||
2005 - 2018 National Fire Incident Reporting System (NFIRS) incidents
- Incident types reported to NFIRS in Bellmore, NY
- 2,05352.0%Rescue & EMS
- 67117.0%Hazardous Condition
- 66016.7%False Alarm
- 2366.0%Service Call
- 1644.2%Good Intent Call
- 1594.0%Fire
- Fire incident types reported to NFIRS in Bellmore, NY
- 7647.8%Structure Fires
- 3823.9%Outside Fires
- 3320.8%Mobile Property/Vehicle Fires
- 127.5%Other
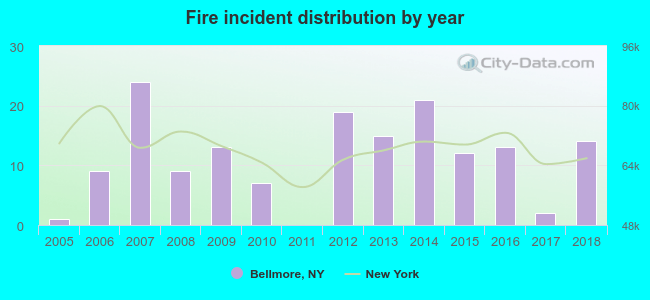 Based on the data from the years 2005 - 2018 the average number of fire incidents per year is 11. The highest number of fires - 24 took place in 2007, and the least - 0 in 2011. The data has a growing trend.
The average number of yearly fire incidents per 10k residents in Bellmore, NY compared to nearest cities:
(Note: Based on data for the last 3 years, including only cities with population 5,000 and above)
| Bellmore: | 6.0 |
| Merrick: | 13.0 |
| Wantagh: | 9.5 |
| Seaford: | 3.3 |
| North Bellmore: | 5.8 |
| North Merrick: | 6.9 |
| Freeport: | 20.8 |
| Massapequa: | 22.9 |
| Roosevelt: | 39.4 |
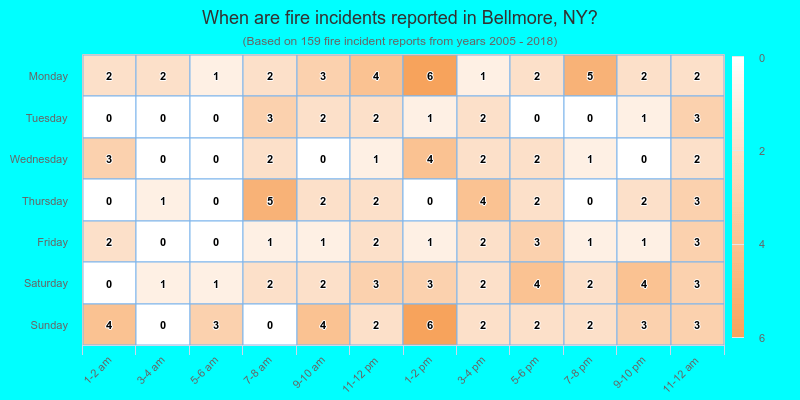
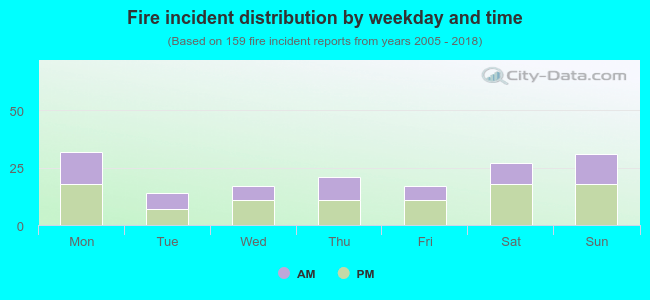 40.9% incidents where reported in the morning and 59.1% in the evening. The most fires (20.1%) took place on Monday, and the least (8.8%) on Tuesday.
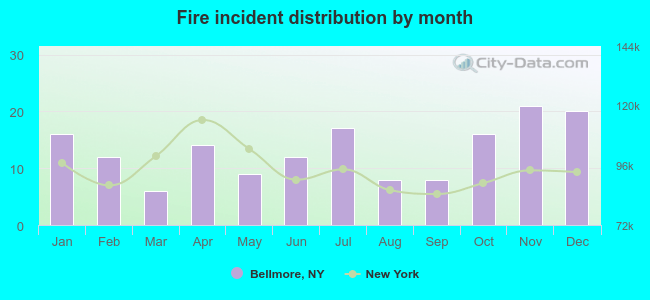 According to the 159 fire incidents from years 2005 - 2018 most fires (13.2%) took place during November, and the least (3.8%) in March.
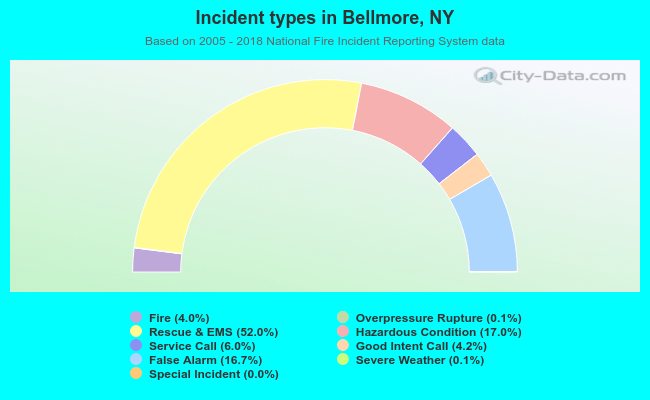 Out of all 3,949 cases reported during the years 2005 - 2018, the most belonged to the categories: Rescue & EMS (52.0%), Hazardous Condition (17.0%), and False Alarm (16.7%).
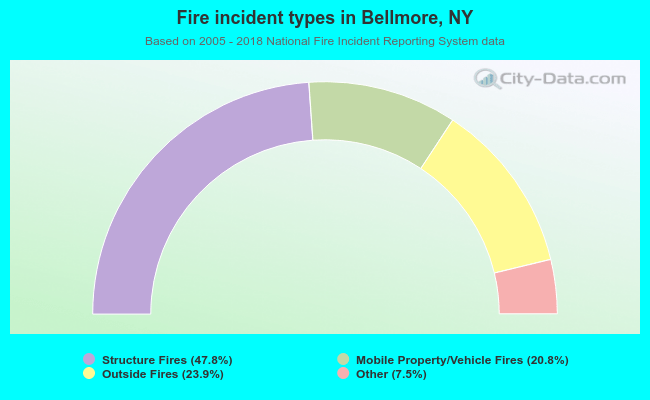 When looking into fire subcategories, the most incidents belonged to: Structure Fires (47.8%), and Outside Fires (23.9%).