| Fire incidents reported |
|---|
| Sreet name | Count |
|---|
| MERRICK AVENUE | 26 | | MEADOWBROOK ROAD | 10 | | PARK AVENUE | 10 | | SOUTHERN STATE PARKWAY | 10 | | JERUSALEM AVE | 8 | | 1260 MEADOWBROOK ROAD | 4 | | 1599 PARK AVENUE | 4 | | 1775 OLD MILL ROAD | 4 | | 2260 LAURA COURT | 4 | | BRIARCLIFF DRIVE | 4 | | JERUSALEM AVENUE | 4 | | LITTLE WHALENECK ROAD | 4 | | MERRICK AVE | 4 | | NORTHRIDGE AVENUE | 4 | | OLD MILL ROAD | 4 | | PUTNAM AVENUE | 4 | | STEVENS AVENUE | 4 | | WELLINGTON RD | 4 | | 1371 HARRY LANE | 2 | | 1399 JERUSLAEM AVE | 2 | | 1400 WHITTIER AVENUE | 2 | | 1426 RHODE AVENUE | 2 | | 1447 CHAPIN AVENUE | 2 | | 1485 RICHARD AVENUE | 2 | | 1567 SYCAMORE AVENUE | 2 |
| | | Fire incidents reported |
|---|
| Sreet name | Count |
|---|
| 1587 WESLEY AVENUE | 2 | | 16 KENSINGTON AVENUE | 2 | | 1624 LAKE AVENUE | 2 | | 1708 SUTTON PLACE | 2 | | 1708 WEBSTER AVENUE | 2 | | 1712 MERRICK AVENUE | 2 | | 1757 MERRICK AVENUE | 2 | | 1795 RELYEA DRIVE | 2 | | 1818 BUSHWICK AVENUE | 2 | | 1854 FREDERICK AVENUE | 2 | | 1878 CARROLL AVENUE | 2 | | 2169 DECKER AVENUE | 2 | | 218 RICHARD AVENUE | 2 | | 2192 REDMOND ROAD | 2 | | 30 NORTHRIDGE AVENUE | 2 | | 5 FIRST AVENUE | 2 | | 5 OAK COURT | 2 | | 50 LEWIS ROAD | 2 | | 52 NANCY BOULEVARD | 2 | | 56 WINIFRED DRIVE | 2 | | 80 DECKER AVENUE | 2 | | BAKER AVENUE | 2 | | BRIAR PLACE | 2 | | BRUCE LANE | 2 | | BUSHWICK AVENUE | 2 |
|
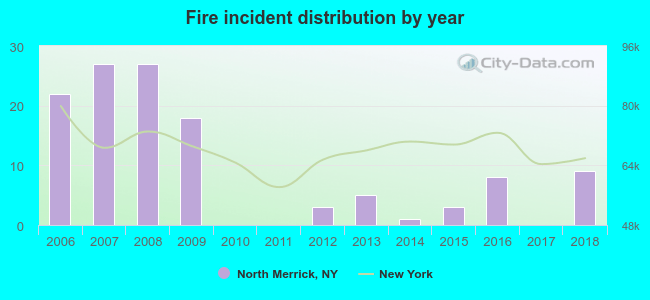 Based on the data from the years 2006 - 2018 the average number of fire incidents per year is 9. The highest number of reported fire incidents - 27 took place in 2007, and the least - 0 in 2010. The data has a dropping trend.
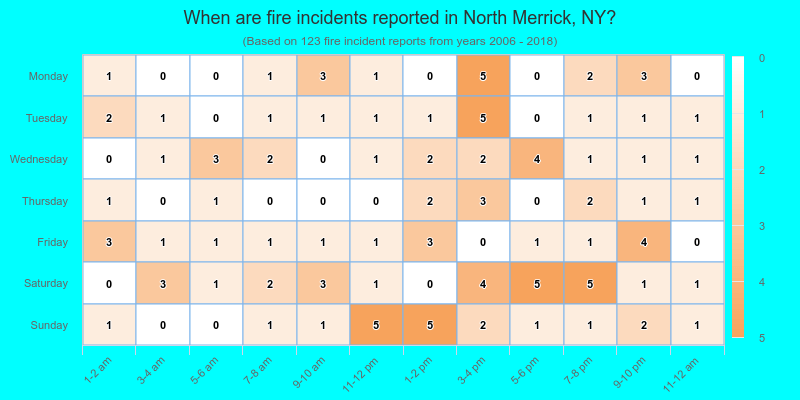
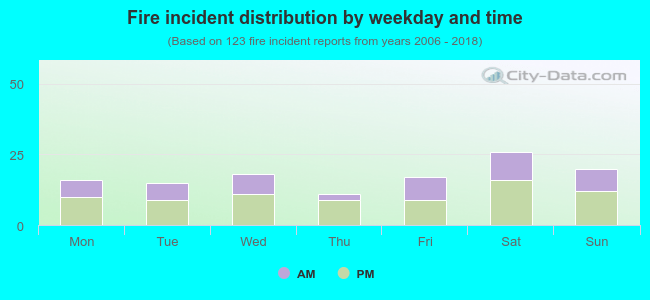 38.2% incidents where reported in the morning and 61.8% in the evening. The most fires (21.1%) took place on Saturday, and the least (8.9%) on Thursday.
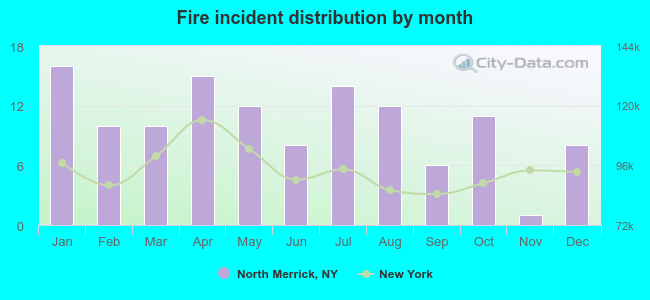 According to the 123 reports from years 2006 - 2018 most fires (13.0%) took place during January, and the least (0.8%) in November.
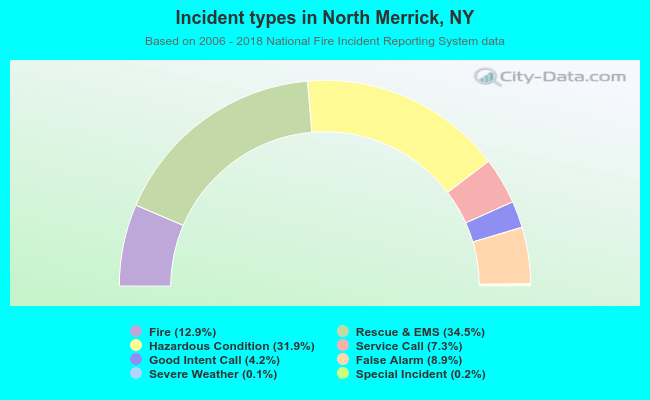 Out of all 955 cases reported during the years 2006 - 2018, the most belonged to the categories: Overpressure Rupture (34.5%), Rescue & EMS (31.9%), and Fire (12.9%).
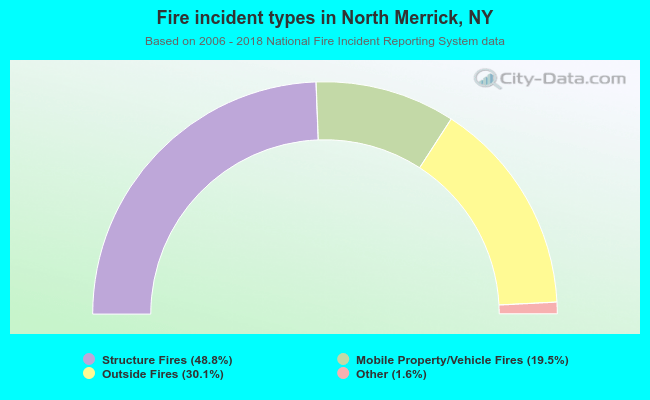 When looking into fire subcategories, the most incidents belonged to: Structure Fires (48.8%), and Outside Fires (30.1%).