Belvidere: Fire Incidents, Illinois (IL)
Where are fire incidents reported in Belvidere, IL
Something went wrong! Please refresh the page.
| Fire incidents reported | |
|---|---|
| Sreet name | Count |
| STATE ST | 170 |
| PEARL ST | 116 |
| LOCUST ST | 70 |
| I-90 INTERSTATE HWY | 66 |
| CHRYSLER DR | 64 |
| NEWBURG RD | 60 |
| BYPASS ROUTE 20 HWY | 58 |
| I90 INTERSTATE HWY | 54 |
| LAWRENCEVILLE RD | 54 |
| MAIN ST | 52 |
| JACKSON ST | 50 |
| WOODSTOCK RD | 44 |
| 6TH ST | 42 |
| MADISON AVE | 42 |
| APPLETON RD | 38 |
| LINCOLN AVE | 38 |
| MCKINLEY RD | 38 |
| IRENE RD | 34 |
| LOGAN AVE | 34 |
| SHATTUCK RD | 32 |
| BELOIT RD | 30 |
| WARREN AVE | 30 |
| 9TH ST | 28 |
| PLEASANT ST | 28 |
| POPLAR GROVE RD | 28 |
| CASWELL ST | 26 |
| SOUTHTOWNE DR | 26 |
| CHERRY VALLEY RD | 24 |
| GATEWAY CENTER DR | 24 |
| GENOA RD | 24 |
| Other | 527 |
2002 - 2018 National Fire Incident Reporting System (NFIRS) incidents
- Incident types reported to NFIRS in Belvidere, IL
- 11,09957.1%Rescue & EMS
- 2,05410.6%Service Call
- 1,95110.0%Fire
- 1,5287.9%Hazardous Condition
- 1,4207.3%Good Intent Call
- 1,2976.7%False Alarm
- 640.3%Special Incident
- 220.1%Overpressure Rupture
- Fire incident types reported to NFIRS in Belvidere, IL
- 76539.2%Outside Fires
- 60831.2%Structure Fires
- 36518.7%Mobile Property/Vehicle Fires
- 21310.9%Other
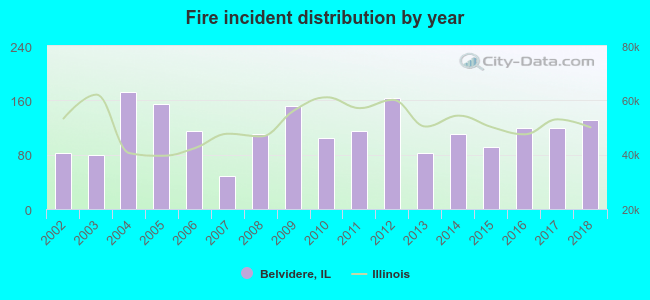 Based on the data from the years 2002 - 2018 the average number of fire incidents per year is 115. The highest number of reported fire incidents - 172 took place in 2004, and the least - 48 in 2007. The data has an increasing trend.
The average number of yearly fire incidents per 10k residents in Belvidere, IL compared to nearest cities:
(Note: Based on data for the last 3 years, including only cities with population 5,000 and above)
| Belvidere: | 48.8 |
| Poplar Grove: | 31.0 |
| Loves Park: | 28.6 |
| Rockford: | 49.6 |
| Machesney Park: | 32.0 |
| Marengo: | 57.3 |
| Genoa: | 68.9 |
| Roscoe: | 46.8 |
| Harvard: | 53.8 |
 The median response time based on all reported fire incidents is 5 minutes. This is similar to the Illinois median value.
The median response time in Belvidere, IL compared to nearest cities:
(Note: Based on data for all years, including only cities with at least 500 fire incidents)
| Belvidere: | 5 minutes |
| Loves Park: | 9 minutes |
| Rockford: | 5 minutes |
| Machesney Park: | 7 minutes |
| Marengo: | 8 minutes |
| Genoa: | 11 minutes |
| Roscoe: | 6 minutes |
| Harvard: | 9 minutes |
| Rockton: | 7 minutes |
 Based on the reports from the years 2002 - 2018 the average number of fire-related yearly deaths is 1. The highest number of reported deaths - 3 took place in 2012, and the lowest - 0 in 2003. The data has a dropping trend.
 According to the data from the years 2002 - 2018 the average number of fire-related casualties per year is 1. The highest number of casualties - 3 took place in 2011, and the lowest - 0 in 2002. The data has a rising trend.
The average number of casualties per 1,000 fires is 6. This indicator was the highest - 26 in 2011, and the lowest 0 in 2002. The trend for casualties per 1,000 fires is rising. Compared to the state value the number of casualties per 1,000 fire incidents is lower.
According to the data from the years 2002 - 2018 the average number of fire-related casualties per year is 1. The highest number of casualties - 3 took place in 2011, and the lowest - 0 in 2002. The data has a rising trend.
The average number of casualties per 1,000 fires is 6. This indicator was the highest - 26 in 2011, and the lowest 0 in 2002. The trend for casualties per 1,000 fires is rising. Compared to the state value the number of casualties per 1,000 fire incidents is lower.Casualties per 1,000 incidents in Belvidere, IL compared to nearest cities:
(Note: Based on data for all years, including only cities with at least 500 fire incidents)
| Belvidere: | 5.6 |
| Loves Park: | 11.2 |
| Rockford: | 16.6 |
| Machesney Park: | 7.3 |
| Marengo: | 0.0 |
| Genoa: | 1.8 |
| Roscoe: | 6.5 |
| Harvard: | 12.4 |
| Rockton: | 2.1 |
 32.9% incidents where reported in the morning and 67.1% in the evening. The most fires (16.0%) took place on Sunday, and the least (13.2%) on Wednesday.
 Based on the 1,951 incident reports from years 2002 - 2018 most fires (10.9%) took place during May, and the least (5.2%) in January.
 Out of all 19,449 cases reported during the years 2002 - 2018, the most belonged to the categories: Rescue & EMS (57.1%), Service Call (10.6%), and Fire (10.0%).
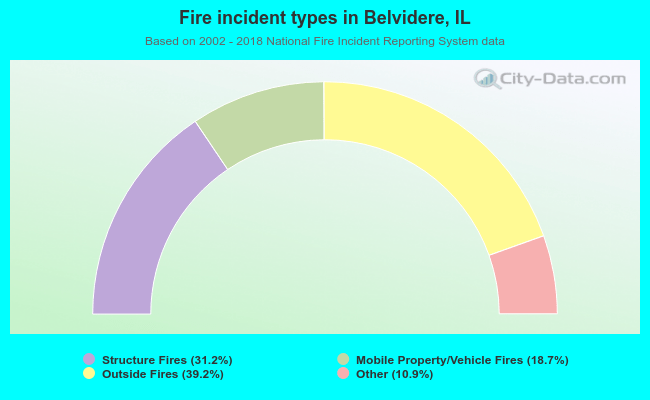 When looking into fire subcategories, the most reports belonged to: Outside Fires (39.2%), and Structure Fires (31.2%).