Loves Park: Fire Incidents, Illinois (IL)
Where are fire incidents reported in Loves Park, IL
Something went wrong! Please refresh the page.
| Fire incidents reported | |
|---|---|
| Sreet name | Count |
| RIVERSIDE BLVD | 118 |
| FOREST HILLS RD | 104 |
| HARLEM RD | 88 |
| 2ND ST | 74 |
| SECOND ST | 72 |
| WINDSOR RD | 54 |
| PERRYVILLE RD | 48 |
| RIVER LN | 34 |
| ALPINE RD | 32 |
| EAST DR | 32 |
| NIMTZ RD | 30 |
| EVELYN AVE | 24 |
| GRAND AVE | 24 |
| INDUSTRIAL CT | 24 |
| CLIFFORD AVE | 22 |
| RIVER PARK RD | 22 |
| CLINTON RD | 20 |
| SHERIDAN DR | 20 |
| PARK RIDGE RD | 16 |
| ARLINGTON ST | 14 |
| BENNETT ST | 14 |
| GRANITE ST | 14 |
| MAPLE AVE | 14 |
| MARBLE DR | 14 |
| MERRILL AVE | 14 |
| PEARL AVE | 14 |
| PENNSYLVANIA AVE | 14 |
| GRAND BLVD | 12 |
| I90 | 12 |
| WINTERS DR | 12 |
2002 - 2018 National Fire Incident Reporting System (NFIRS) incidents
- Incident types reported to NFIRS in Loves Park, IL
- 1,04025.7%Hazardous Condition
- 98424.3%Fire
- 65716.2%Good Intent Call
- 59914.8%False Alarm
- 46111.4%Rescue & EMS
- 2806.9%Service Call
- 260.6%Overpressure Rupture
- 60.1%Special Incident
- Fire incident types reported to NFIRS in Loves Park, IL
- 49650.4%Structure Fires
- 27928.4%Outside Fires
- 17017.3%Mobile Property/Vehicle Fires
- 394.0%Other
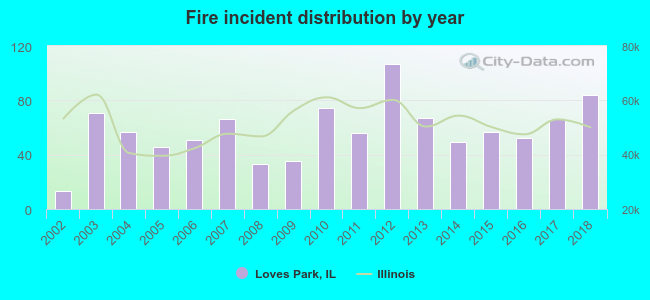 According to the data from the years 2002 - 2018 the average number of fire incidents per year is 58. The highest number of fires - 107 took place in 2012, and the least - 13 in 2002. The data has a growing trend.
The average number of yearly fire incidents per 10k residents in Loves Park, IL compared to nearest cities:
(Note: Based on data for the last 3 years, including only cities with population 5,000 and above)
| Loves Park: | 28.6 |
| Machesney Park: | 32.0 |
| Rockford: | 49.6 |
| Roscoe: | 46.8 |
| Rockton: | 74.1 |
| Poplar Grove: | 31.0 |
| Belvidere: | 48.8 |
| South Beloit: | 46.2 |
| Harvard: | 53.8 |
 The median response time based on all reported fire incidents is 9 minutes. This is higher compared to the Illinois median value.
The median response time in Loves Park, IL compared to nearest cities:
(Note: Based on data for all years, including only cities with at least 500 fire incidents)
| Loves Park: | 9 minutes |
| Machesney Park: | 7 minutes |
| Rockford: | 5 minutes |
| Roscoe: | 6 minutes |
| Rockton: | 7 minutes |
| Belvidere: | 5 minutes |
| Winnebago: | 12 minutes |
| Byron: | 7 minutes |
| Harvard: | 9 minutes |
 Based on the reports from the years 2002 - 2018 the average number of fire-related yearly casualties is 1. The highest number of reported injuries - 5 took place in 2016, and the lowest - 0 in 2006. The data has a declining trend.
The average number of casualties per 1,000 fires is 15. This indicator was the highest - 96 in 2016, and the lowest 0 in 2006. The trend for injuries per 1,000 incidents is decreasing. Compared to the state value the number of injuries per 1,000 fires is similar.
Based on the reports from the years 2002 - 2018 the average number of fire-related yearly casualties is 1. The highest number of reported injuries - 5 took place in 2016, and the lowest - 0 in 2006. The data has a declining trend.
The average number of casualties per 1,000 fires is 15. This indicator was the highest - 96 in 2016, and the lowest 0 in 2006. The trend for injuries per 1,000 incidents is decreasing. Compared to the state value the number of injuries per 1,000 fires is similar.
 33.6% incidents where reported in the morning and 66.4% in the evening. The most fires (16.1%) took place on Monday, and the least (12.4%) on Wednesday.
 Based on the 984 fires from years 2002 - 2018 most fires (14.7%) took place during June, and the least (5.3%) in January.
 Out of all 4,054 cases reported during the years 2002 - 2018, the most belonged to the categories: Hazardous Condition (25.7%), Fire (24.3%), and Good Intent Call (16.2%).
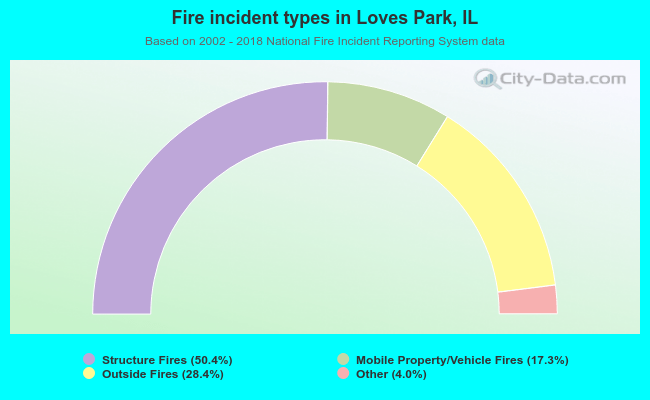 When looking into fire subcategories, the most incidents belonged to: Structure Fires (50.4%), and Outside Fires (28.4%).