Roscoe: Fire Incidents, Illinois (IL)
Where are fire incidents reported in Roscoe, IL
Something went wrong! Please refresh the page.
|
| |||||||||||||||||||||||||||||||||||||||||||||||||||||||||||||||||||||||||||||||||||||||||||||||||||||||||||||
| Other | 27 | |||||||||||||||||||||||||||||||||||||||||||||||||||||||||||||||||||||||||||||||||||||||||||||||||||||||||||||
2002 - 2018 National Fire Incident Reporting System (NFIRS) incidents
- Incident types reported to NFIRS in Roscoe, IL
- 5,73262.1%Rescue & EMS
- 1,43415.5%Hazardous Condition
- 7678.3%Fire
- 4474.8%Service Call
- 4404.8%False Alarm
- 3744.1%Good Intent Call
- 180.2%Special Incident
- 150.2%Severe Weather
- Fire incident types reported to NFIRS in Roscoe, IL
- 31140.5%Structure Fires
- 22829.7%Outside Fires
- 14518.9%Mobile Property/Vehicle Fires
- 8310.8%Other
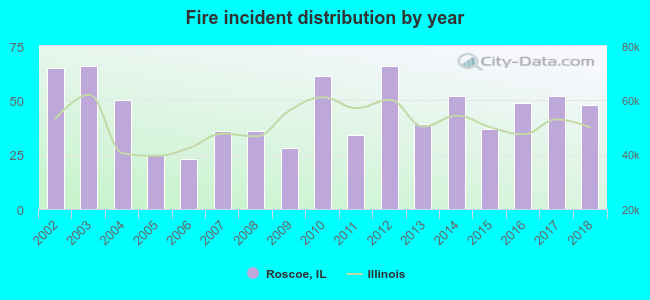 Based on the data from the years 2002 - 2018 the average number of fires per year is 45. The highest number of reported fire incidents - 66 took place in 2003, and the least - 23 in 2006. The data has a decreasing trend.
The average number of yearly fire incidents per 10k residents in Roscoe, IL compared to nearest cities:
(Note: Based on data for the last 3 years, including only cities with population 5,000 and above)
| Roscoe: | 46.8 |
| Rockton: | 74.1 |
| Machesney Park: | 32.0 |
| South Beloit: | 46.2 |
| Loves Park: | 28.6 |
| Poplar Grove: | 31.0 |
| Rockford: | 49.6 |
| Belvidere: | 48.8 |
| Harvard: | 53.8 |
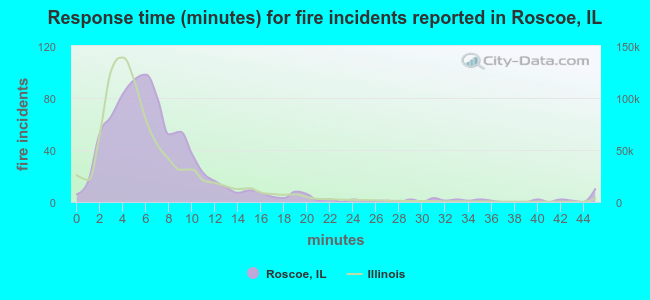 The median response time based on all reported fire incidents is 6 minutes. This is about the same as the Illinois median value.
The median response time in Roscoe, IL compared to nearest cities:
(Note: Based on data for all years, including only cities with at least 500 fire incidents)
| Roscoe: | 6 minutes |
| Rockton: | 7 minutes |
| Machesney Park: | 7 minutes |
| Loves Park: | 9 minutes |
| Rockford: | 5 minutes |
| Belvidere: | 5 minutes |
| Winnebago: | 12 minutes |
| Harvard: | 9 minutes |
| Marengo: | 8 minutes |
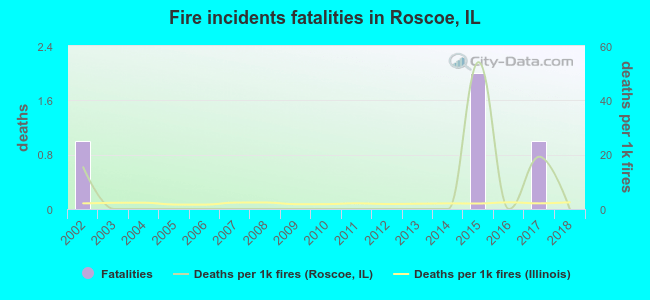 Based on the reports from the years 2002 - 2018 the average number of fire-related yearly deaths is 0. The highest number of reported deaths - 2 took place in 2015, and the lowest - 0 in 2003. The data has a declining trend.
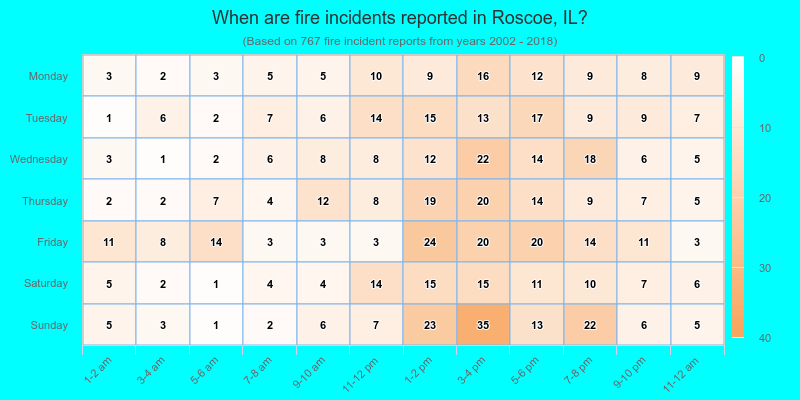
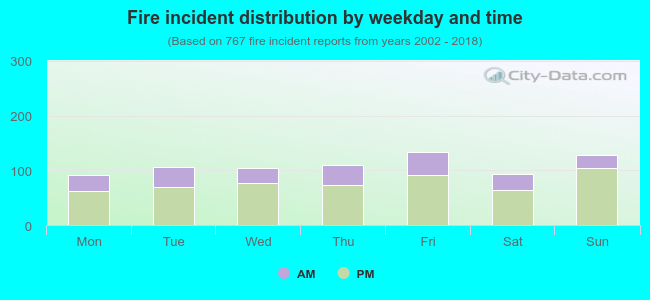 29.1% incidents where reported in the morning and 70.9% in the evening. The most fires (17.5%) took place on Friday, and the least (11.9%) on Monday.
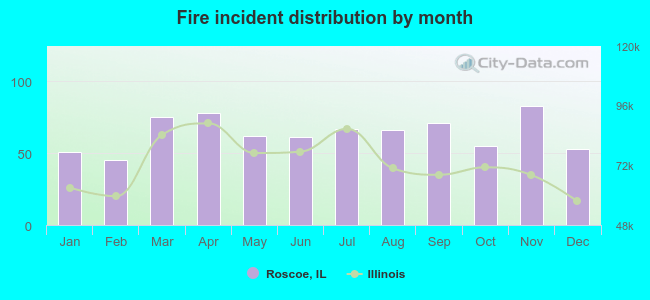 According to the 767 fire incident reports from years 2002 - 2018 most fires (10.8%) took place during November, and the least (5.9%) in February.
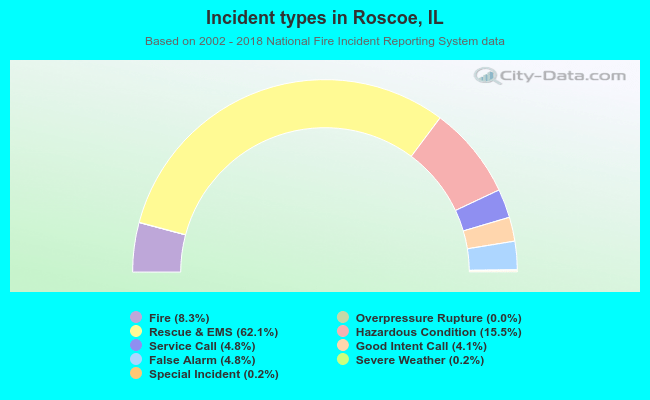 Out of all 9,229 cases reported during the years 2002 - 2018, the most belonged to the categories: Rescue & EMS (62.1%), Hazardous Condition (15.5%), and Fire (8.3%).
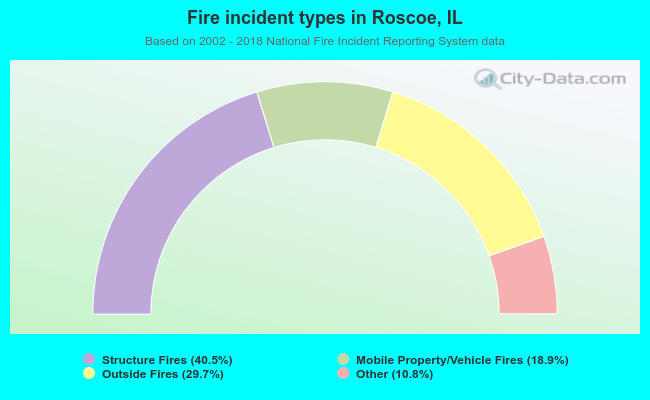 When looking into fire subcategories, the most incidents belonged to: Structure Fires (40.5%), and Outside Fires (29.7%).