Benton: Fire Incidents, Illinois (IL)
Where are fire incidents reported in Benton, IL
Something went wrong! Please refresh the page.
| Fire incidents reported | |
|---|---|
| Sreet name | Count |
| MAIN ST | 168 |
| WEBSTER ST | 74 |
| MCLEANSBORO ST | 66 |
| CHURCH ST | 50 |
| MADISON ST | 50 |
| COMMERCIAL ST | 42 |
| BUCHANAN ST | 32 |
| WASHINGTON ST | 32 |
| BAILEY LN | 30 |
| BOND ST | 26 |
| GRAND ST | 26 |
| INTERSTATE 57 | 26 |
| STATE HIGHWAY 37 | 26 |
| FAIRLAND ST | 24 |
| POPE ST | 22 |
| DUQUOIN ST | 20 |
| STOTLAR ST | 20 |
| TAYLOR ST | 20 |
| WILSON ST | 20 |
| STATE HIGHWAY 14 | 18 |
| STATE HIGHWAY 34 | 18 |
| CENTER ST | 16 |
| MAIN | 16 |
| MAPLE ST | 16 |
| SHERIDAN DR | 16 |
| 8TH ST | 14 |
| BAILEY LANE | 14 |
| DU QUOIN ST | 14 |
| ELECTION ST | 14 |
| FORREST ST | 14 |
| Other | 343 |
2002 - 2018 National Fire Incident Reporting System (NFIRS) incidents
- Incident types reported to NFIRS in Benton, IL
- 1,59538.5%Rescue & EMS
- 1,28731.0%Fire
- 54913.2%Hazardous Condition
- 2796.7%False Alarm
- 2135.1%Service Call
- 1443.5%Good Intent Call
- 631.5%Special Incident
- 100.2%Severe Weather
- 80.2%Overpressure Rupture
- Fire incident types reported to NFIRS in Benton, IL
- 61647.9%Structure Fires
- 46135.8%Outside Fires
- 14111.0%Mobile Property/Vehicle Fires
- 695.4%Other
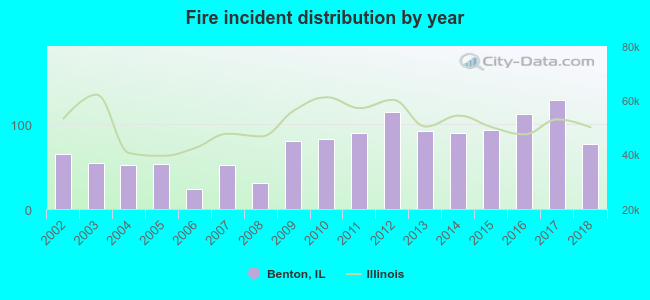 Based on the data from the years 2002 - 2018 the average number of fire incidents per year is 76. The highest number of reported fire incidents - 128 took place in 2017, and the least - 23 in 2006. The data has an increasing trend.
The average number of yearly fire incidents per 10k residents in Benton, IL compared to nearest cities:
(Note: Based on data for the last 3 years, including only cities with population 5,000 and above)
| Benton: | 150.6 |
| West Frankfort: | 153.5 |
| Herrin: | 51.6 |
| Du Quoin: | 63.8 |
| Marion: | 107.8 |
| Carterville: | 69.3 |
| Mount Vernon: | 16.0 |
| Carbondale: | 52.3 |
| Pinckneyville: | 36.7 |
 The median response time based on all reported fire incidents is 4 minutes. This is lower than the Illinois median value.
The median response time in Benton, IL compared to nearest cities:
(Note: Based on data for all years, including only cities with at least 500 fire incidents)
| Benton: | 4 minutes |
| West Frankfort: | 5 minutes |
| Mitchell: | 5 minutes |
| Johnston City: | 6 minutes |
| Herrin: | 4 minutes |
| Marion: | 5 minutes |
| Carterville: | 6 minutes |
| Mount Vernon: | 4 minutes |
| Carbondale: | 4 minutes |
 Based on the reports from the years 2002 - 2018 the average number of fire-related yearly casualties is 1. The highest number of reported casualties - 4 took place in 2011, and the lowest - 0 in 2002. The data has a constant trend.
The average number of injuries per 1,000 fires is 5. This indicator was the highest - 44 in 2011, and the lowest 0 in 2002. The trend for injuries per 1,000 incidents is constant. Compared to the state value the number of injuries per 1,000 fire incidents is lower.
Based on the reports from the years 2002 - 2018 the average number of fire-related yearly casualties is 1. The highest number of reported casualties - 4 took place in 2011, and the lowest - 0 in 2002. The data has a constant trend.
The average number of injuries per 1,000 fires is 5. This indicator was the highest - 44 in 2011, and the lowest 0 in 2002. The trend for injuries per 1,000 incidents is constant. Compared to the state value the number of injuries per 1,000 fire incidents is lower.Casualties per 1,000 incidents in Benton, IL compared to nearest cities:
(Note: Based on data for all years, including only cities with at least 500 fire incidents)
| Benton: | 7.0 |
| West Frankfort: | 6.2 |
| Mitchell: | 5.9 |
| Johnston City: | 1.3 |
| Herrin: | 3.8 |
| Marion: | 6.2 |
| Carterville: | 1.8 |
| Mount Vernon: | 27.8 |
| Carbondale: | 24.0 |
 29.9% incidents where reported in the morning and 70.1% in the evening. The most fires (15.5%) took place on Saturday, and the least (12.5%) on Tuesday.
 According to the 1,287 fire incident reports from years 2002 - 2018 most fires (12.4%) took place during March, and the least (6.4%) in January.
 Out of all 4,148 cases reported during the years 2002 - 2018, the most belonged to the categories: Rescue & EMS (38.5%), Fire (31.0%), and Hazardous Condition (13.2%).
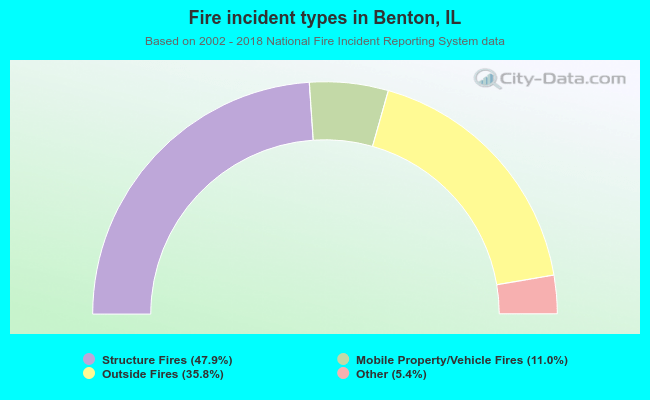 When looking into fire subcategories, the most incidents belonged to: Structure Fires (47.9%), and Outside Fires (35.8%).