Johnston City: Fire Incidents, Illinois (IL)
Where are fire incidents reported in Johnston City, IL
Something went wrong! Please refresh the page.
|
| |||||||||||||||||||||||||||||||||||||||||||||||||||||||||||||||||||||||||||||||||||||||||||||||||||||||||||||
| Other | 134 | |||||||||||||||||||||||||||||||||||||||||||||||||||||||||||||||||||||||||||||||||||||||||||||||||||||||||||||
2002 - 2018 National Fire Incident Reporting System (NFIRS) incidents
- Incident types reported to NFIRS in Johnston City, IL
- 74638.9%Fire
- 52727.5%Rescue & EMS
- 23512.3%Hazardous Condition
- 1829.5%Service Call
- 1176.1%Good Intent Call
- 854.4%False Alarm
- 140.7%Severe Weather
- 60.3%Special Incident
- 50.3%Overpressure Rupture
- Fire incident types reported to NFIRS in Johnston City, IL
- 34245.8%Outside Fires
- 28738.5%Structure Fires
- 8311.1%Mobile Property/Vehicle Fires
- 344.6%Other
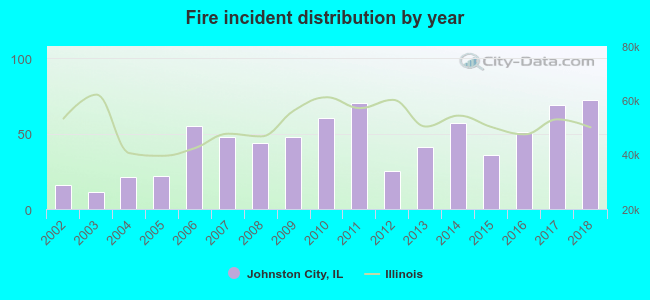 According to the data from the years 2002 - 2018 the average number of fire incidents per year is 44. The highest number of reported fire incidents - 72 took place in 2018, and the least - 11 in 2003. The data has a rising trend.
 The median response time based on all reported fire incidents is 6 minutes. This is similar to the state median value.
The median response time in Johnston City, IL compared to nearest cities:
(Note: Based on data for all years, including only cities with at least 500 fire incidents)
| Johnston City: | 6 minutes |
| West Frankfort: | 5 minutes |
| Herrin: | 4 minutes |
| Marion: | 5 minutes |
| Carterville: | 6 minutes |
| Mitchell: | 5 minutes |
| Benton: | 4 minutes |
| Carbondale: | 4 minutes |
| Harrisburg: | 4 minutes |
 35.9% incidents where reported in the morning and 64.1% in the evening. The most fires (18.1%) took place on Sunday, and the least (9.9%) on Thursday.
 Based on the 746 incident reports from years 2002 - 2018 most fires (11.4%) took place during March, and the least (4.8%) in December.
 Out of all 1,917 cases reported during the years 2002 - 2018, the most belonged to the categories: Fire (38.9%), Rescue & EMS (27.5%), and Hazardous Condition (12.3%).
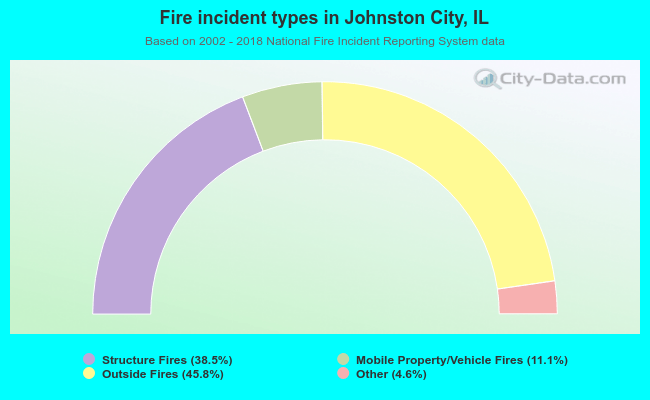 When looking into fire subcategories, the most incidents belonged to: Outside Fires (45.8%), and Structure Fires (38.5%).