Marion: Fire Incidents, Illinois (IL)
Where are fire incidents reported in Marion, IL
Something went wrong! Please refresh the page.
| Fire incidents reported | |
|---|---|
| Sreet name | Count |
| MAIN ST | 224 |
| DEYOUNG ST | 82 |
| CARBON ST | 72 |
| COURT ST | 68 |
| MAIN | 64 |
| DEYOUNG | 62 |
| MARKET ST | 54 |
| MIDWAY CT | 54 |
| MARKET | 52 |
| COURT | 50 |
| ROUTE 37 HWY | 50 |
| BOULEVARD ST | 44 |
| RUSSELL ST | 44 |
| MADISON ST | 38 |
| MAIN STREET | 38 |
| WARDS MILL RD | 38 |
| BENTLEY ST | 36 |
| LAKE OF EGYPT RD | 34 |
| MONROE | 32 |
| VICKSBURG ST | 32 |
| MARKET RD | 30 |
| MAUREEN DR | 30 |
| ROUTE 166 | 30 |
| BOYTON ST | 28 |
| BUCHANAN | 28 |
| CARBON | 28 |
| CHERRY ST | 28 |
| HENDRICKSON | 26 |
| VAN BUREN ST | 26 |
| VICKSBURG | 26 |
| Other | 1,942 |
2002 - 2018 National Fire Incident Reporting System (NFIRS) incidents
- Incident types reported to NFIRS in Marion, IL
- 3,39034.3%Fire
- 1,80918.3%Hazardous Condition
- 1,38314.0%Rescue & EMS
- 1,27012.9%False Alarm
- 1,07910.9%Service Call
- 8979.1%Good Intent Call
- 270.3%Overpressure Rupture
- 170.2%Special Incident
- Fire incident types reported to NFIRS in Marion, IL
- 1,68349.6%Outside Fires
- 1,15834.2%Structure Fires
- 49314.5%Mobile Property/Vehicle Fires
- 561.7%Other
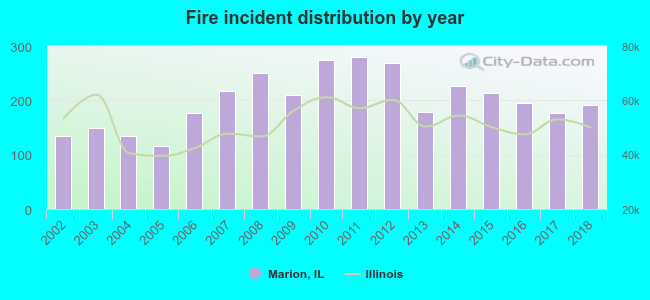 According to the data from the years 2002 - 2018 the average number of fire incidents per year is 199. The highest number of fires - 279 took place in 2011, and the least - 116 in 2005. The data has a growing trend.
The average number of yearly fire incidents per 10k residents in Marion, IL compared to nearest cities:
(Note: Based on data for the last 3 years, including only cities with population 5,000 and above)
| Marion: | 107.8 |
| Herrin: | 51.6 |
| Carterville: | 69.3 |
| West Frankfort: | 153.5 |
| Carbondale: | 52.3 |
| Benton: | 150.6 |
| Harrisburg: | 71.4 |
| Murphysboro: | 108.4 |
| Du Quoin: | 63.8 |
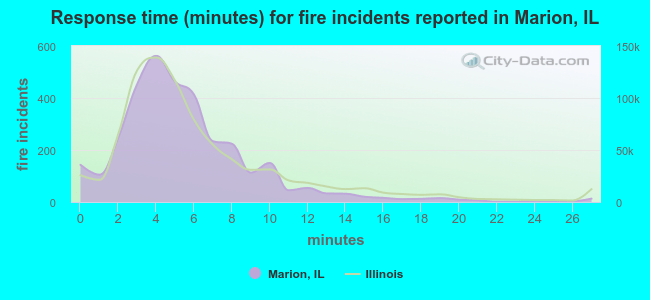 The median response time based on all reported fire incidents is 5 minutes. This is similar to the state median value.
The median response time in Marion, IL compared to nearest cities:
(Note: Based on data for all years, including only cities with at least 500 fire incidents)
| Marion: | 5 minutes |
| Johnston City: | 6 minutes |
| Herrin: | 4 minutes |
| Carterville: | 6 minutes |
| West Frankfort: | 5 minutes |
| Mitchell: | 5 minutes |
| Carbondale: | 4 minutes |
| Benton: | 4 minutes |
| Harrisburg: | 4 minutes |
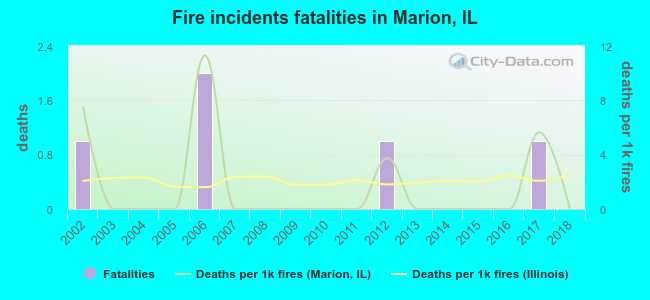 According to the data from the years 2002 - 2018 the average number of fire-related yearly deaths is 0. The highest number of deaths - 2 took place in 2006, and the lowest - 0 in 2003. The data has a dropping trend.
The average number of fatalities per 1,000 fire incidents is 2. This indicator was the highest - 11 in 2006, and the lowest 0 in 2003. The trend for deaths per 1,000 incidents is dropping. Compared to the state value the number of deaths per 1,000 fire incidents is lower.
According to the data from the years 2002 - 2018 the average number of fire-related yearly deaths is 0. The highest number of deaths - 2 took place in 2006, and the lowest - 0 in 2003. The data has a dropping trend.
The average number of fatalities per 1,000 fire incidents is 2. This indicator was the highest - 11 in 2006, and the lowest 0 in 2003. The trend for deaths per 1,000 incidents is dropping. Compared to the state value the number of deaths per 1,000 fire incidents is lower.Deaths per 1,000 incidents in Marion, IL compared to nearest cities:
(Note: Based on data for all years, including only cities with at least 2,500 fire incidents)
| Marion: | 1.5 |
| Carbondale: | 1.3 |
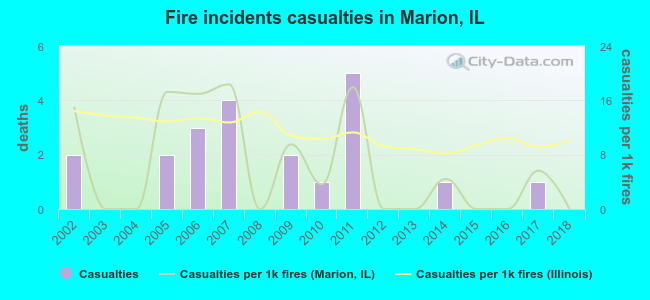 Based on the data from the years 2002 - 2018 the average number of fire-related yearly casualties is 1. The highest number of reported injuries - 5 took place in 2011, and the lowest - 0 in 2003. The data has a decreasing trend.
The average number of casualties per 1,000 fire incidents is 6. This indicator was the highest - 18 in 2007, and the lowest 0 in 2003. The trend for casualties per 1,000 fires is declining. Compared to the Illinois value the number of injuries per 1,000 fires is lower.
Based on the data from the years 2002 - 2018 the average number of fire-related yearly casualties is 1. The highest number of reported injuries - 5 took place in 2011, and the lowest - 0 in 2003. The data has a decreasing trend.
The average number of casualties per 1,000 fire incidents is 6. This indicator was the highest - 18 in 2007, and the lowest 0 in 2003. The trend for casualties per 1,000 fires is declining. Compared to the Illinois value the number of injuries per 1,000 fires is lower.Casualties per 1,000 incidents in Marion, IL compared to nearest cities:
(Note: Based on data for all years, including only cities with at least 500 fire incidents)
| Marion: | 6.2 |
| Johnston City: | 1.3 |
| Herrin: | 3.8 |
| Carterville: | 1.8 |
| West Frankfort: | 6.2 |
| Mitchell: | 5.9 |
| Carbondale: | 24.0 |
| Benton: | 7.0 |
| Harrisburg: | 6.9 |
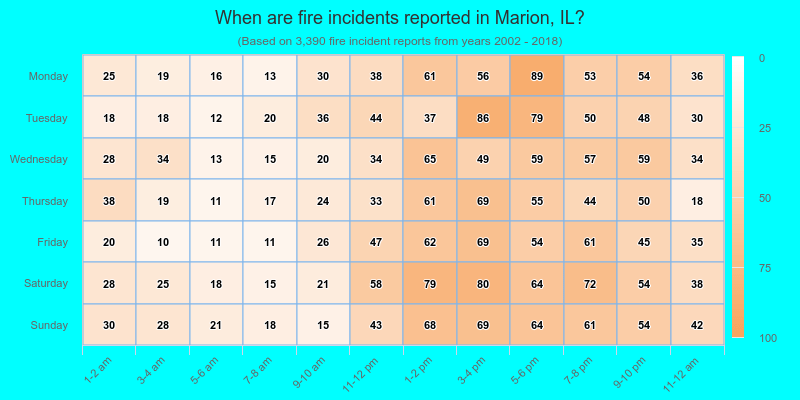
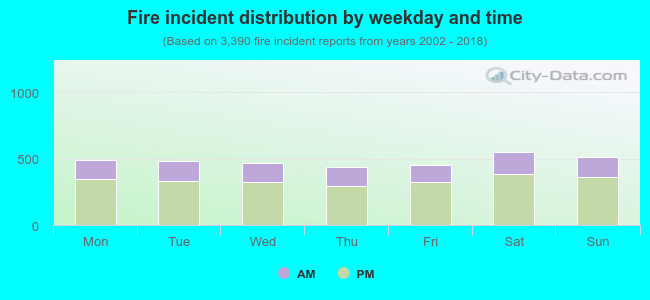 30.1% incidents where reported in the morning and 69.9% in the evening. The most fires (16.3%) took place on Saturday, and the least (12.9%) on Thursday.
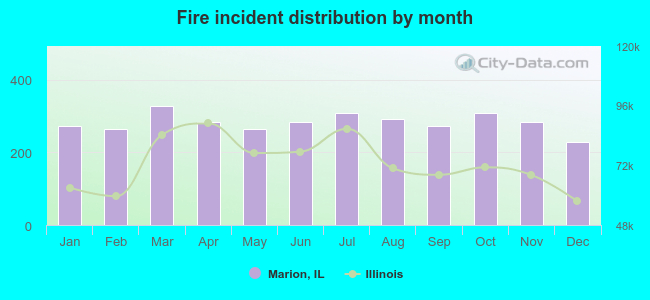 Based on the 3,390 fires from years 2002 - 2018 most fires (9.7%) took place during March, and the least (6.7%) in December.
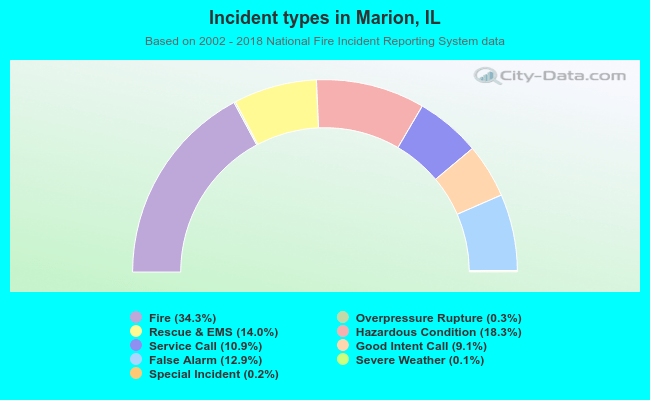 Out of all 9,878 cases reported during the years 2002 - 2018, the most belonged to the categories: Fire (34.3%), Hazardous Condition (18.3%), and Rescue & EMS (14.0%).
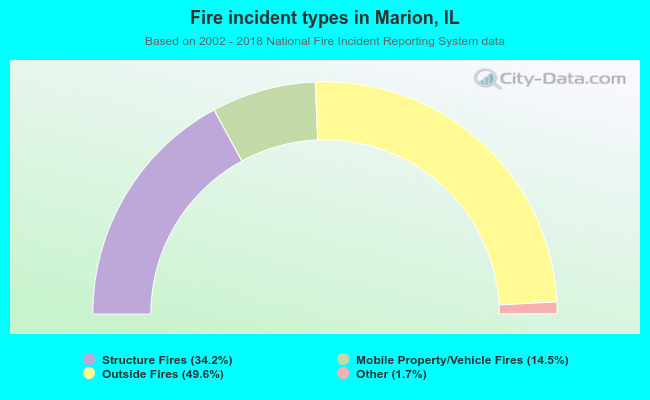 When looking into fire subcategories, the most incidents belonged to: Outside Fires (49.6%), and Structure Fires (34.2%).