Bertram: Fire Incidents, Texas (TX)
Where are fire incidents reported in Bertram, TX
Something went wrong! Please refresh the page.
|
| |||||||||||||||||||||||||||||||||||||||||||||||||||||||||||||||||||||||||||||||||||||||||||||||||||||||||||||
2003 - 2018 National Fire Incident Reporting System (NFIRS) incidents
- Incident types reported to NFIRS in Bertram, TX
- 1,26845.7%Rescue & EMS
- 94033.9%Fire
- 2268.1%Good Intent Call
- 2057.4%Hazardous Condition
- 1013.6%Service Call
- 271.0%False Alarm
- 30.1%Special Incident
- Fire incident types reported to NFIRS in Bertram, TX
- 73578.2%Outside Fires
- 13914.8%Structure Fires
- 424.5%Mobile Property/Vehicle Fires
- 242.6%Other
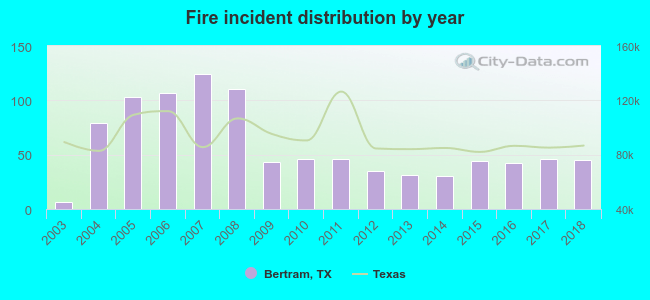 According to the data from the years 2003 - 2018 the average number of fires per year is 59. The highest number of fire incidents - 124 took place in 2007, and the least - 6 in 2003. The data has a rising trend.
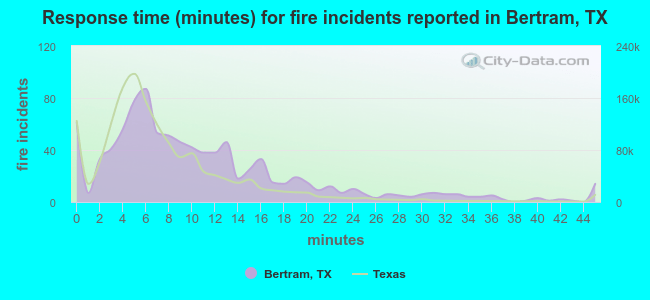 The median response time based on all reported fire incidents is 9 minutes. This is higher compared to the Texas median value.
The median response time in Bertram, TX compared to nearest cities:
(Note: Based on data for all years, including only cities with at least 500 fire incidents)
| Bertram: | 9 minutes |
| Burnet: | 8 minutes |
| Liberty Hill: | 10 minutes |
| Florence: | 10 minutes |
| Leander: | 7 minutes |
| Marble Falls: | 7 minutes |
| Cedar Park: | 6 minutes |
| Georgetown: | 7 minutes |
| Kempner: | 13 minutes |
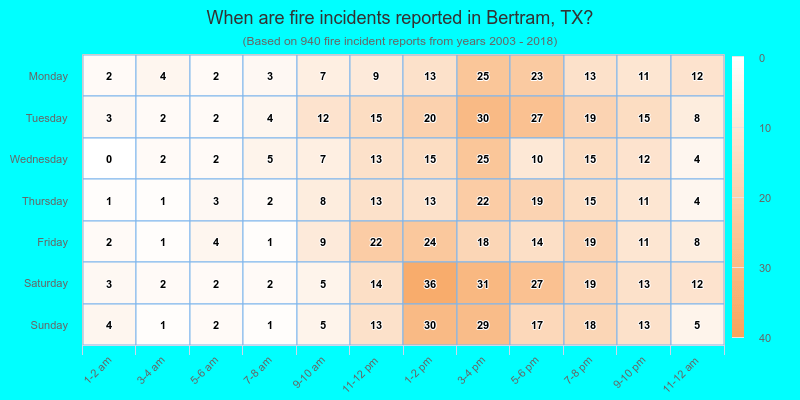
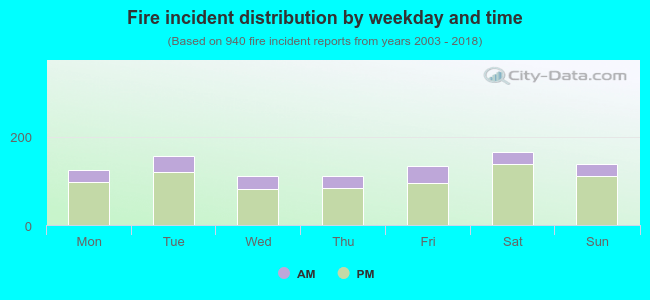 22.9% incidents where reported in the morning and 77.1% in the evening. The most fires (17.7%) took place on Saturday, and the least (11.7%) on Wednesday.
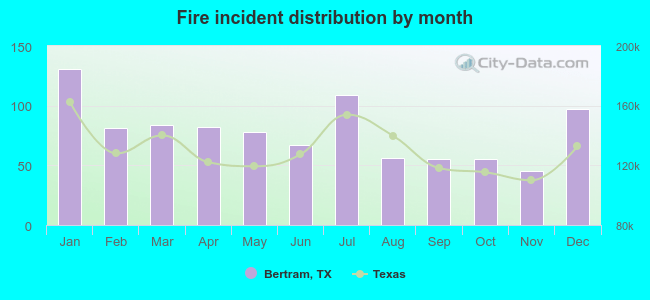 Based on the 940 incident reports from years 2003 - 2018 most fires (13.9%) took place during January, and the least (4.8%) in November.
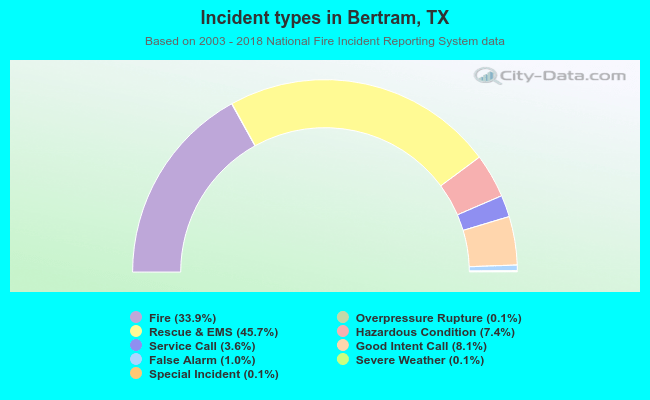 Out of all 2,774 cases reported during the years 2003 - 2018, the most belonged to the categories: Rescue & EMS (45.7%), Fire (33.9%), and Good Intent Call (8.1%).
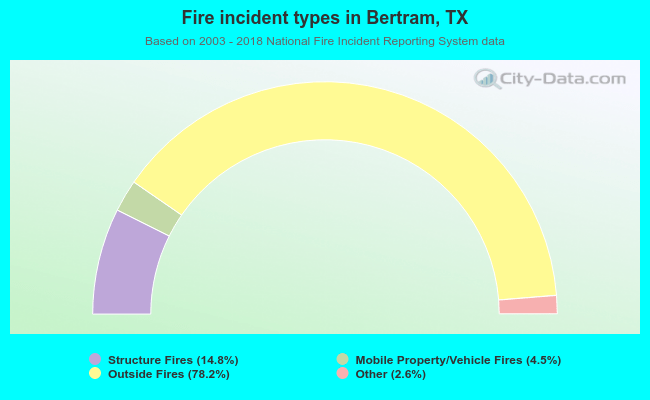 When looking into fire subcategories, the most incidents belonged to: Outside Fires (78.2%), and Structure Fires (14.8%).