Cedar Park: Fire Incidents, Texas (TX)
Where are fire incidents reported in Cedar Park, TX
Something went wrong! Please refresh the page.
| Fire incidents reported | |
|---|---|
| Sreet name | Count |
| WHITESTONE BLVD | 344 |
| CYPRESS CREEK RD | 238 |
| BELL BLVD | 212 |
| LAKELINE BLVD | 210 |
| BRUSHY CREEK RD | 68 |
| NEW HOPE DR | 66 |
| 183A TOLLROAD | 64 |
| ANDERSON MILL RD | 64 |
| BUTTERCUP CREEK BLVD | 54 |
| PARMER LA | 54 |
| DISCOVERY BLVD | 52 |
| LITTLE ELM TRL | 44 |
| SUN CHASE BLVD | 36 |
| SHENANDOAH DR | 32 |
| COUGAR AVE | 30 |
| PARK ST | 30 |
| SUMAC LA | 30 |
| CEDAR PARK DR | 28 |
| WALTON WAY | 28 |
| BUFFALO AVE | 26 |
| CYPRESS LA | 26 |
| MUSTANG AVE | 26 |
| ARROW POINT DR | 24 |
| VISTA RIDGE BLVD | 24 |
| EL SALIDO PKY | 22 |
| PARMER LN | 22 |
| RIVIERA DR | 22 |
| STAPLEFORD DR | 22 |
| BAGDAD RD | 20 |
| BLUEBONNET DR | 20 |
| Other | 454 |
2002 - 2018 National Fire Incident Reporting System (NFIRS) incidents
- Incident types reported to NFIRS in Cedar Park, TX
- 19,59062.6%Rescue & EMS
- 3,63811.6%Hazardous Condition
- 2,3927.6%Fire
- 2,3737.6%Good Intent Call
- 2,1126.8%False Alarm
- 1,1323.6%Service Call
- Fire incident types reported to NFIRS in Cedar Park, TX
- 1,09945.9%Outside Fires
- 93739.2%Structure Fires
- 30012.5%Mobile Property/Vehicle Fires
- 562.3%Other
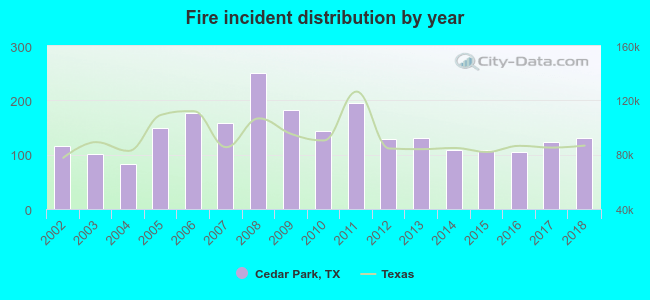 Based on the data from the years 2002 - 2018 the average number of fire incidents per year is 141. The highest number of fires - 250 took place in 2008, and the least - 83 in 2004. The data has a rising trend.
The average number of yearly fire incidents per 10k residents in Cedar Park, TX compared to nearest cities:
(Note: Based on data for the last 3 years, including only cities with population 5,000 and above)
| Cedar Park: | 18.8 |
| Leander: | 38.0 |
| Jollyville: | 0.6 |
| Round Rock: | 17.3 |
| Lago Vista: | 47.3 |
| Pflugerville: | 20.1 |
| Lakeway: | 27.3 |
| Georgetown: | 32.1 |
| Austin: | 17.6 |
 The median response time based on all reported fire incidents is 6 minutes. This is comparable to the Texas median value.
The median response time in Cedar Park, TX compared to nearest cities:
(Note: Based on data for all years, including only cities with at least 500 fire incidents)
| Cedar Park: | 6 minutes |
| Leander: | 7 minutes |
| Round Rock: | 5 minutes |
| Liberty Hill: | 10 minutes |
| Pflugerville: | 7 minutes |
| Georgetown: | 7 minutes |
| Austin: | 5 minutes |
| Hutto: | 8 minutes |
| Manor: | 8 minutes |
 According to the data from the years 2002 - 2018 the average number of fire-related yearly deaths is 0. The highest number of deaths - 2 took place in 2002, and the lowest - 0 in 2004. The data has a decreasing trend.
 Based on the reports from the years 2002 - 2018 the average number of fire-related yearly casualties is 1. The highest number of casualties - 2 took place in 2006, and the lowest - 0 in 2003. The data has a growing trend.
The average number of casualties per 1,000 fire incidents is 6. This indicator was the highest - 19 in 2016, and the lowest 0 in 2003. The trend for casualties per 1,000 incidents is increasing. Compared to the state value the number of injuries per 1,000 fires is lower.
Based on the reports from the years 2002 - 2018 the average number of fire-related yearly casualties is 1. The highest number of casualties - 2 took place in 2006, and the lowest - 0 in 2003. The data has a growing trend.
The average number of casualties per 1,000 fire incidents is 6. This indicator was the highest - 19 in 2016, and the lowest 0 in 2003. The trend for casualties per 1,000 incidents is increasing. Compared to the state value the number of injuries per 1,000 fires is lower.Casualties per 1,000 incidents in Cedar Park, TX compared to nearest cities:
(Note: Based on data for all years, including only cities with at least 500 fire incidents)
| Cedar Park: | 5.9 |
| Leander: | 4.2 |
| Round Rock: | 8.6 |
| Liberty Hill: | 0.0 |
| Pflugerville: | 2.1 |
| Georgetown: | 10.4 |
| Austin: | 15.1 |
| Hutto: | 3.5 |
| Manor: | 2.5 |
 27.1% incidents where reported in the morning and 72.9% in the evening. The most fires (15.8%) took place on Sunday, and the least (13.2%) on Thursday.
 According to the 2,392 incident reports from years 2002 - 2018 most fires (10.7%) took place during January, and the least (6.8%) in October.
 Out of all 31,285 cases reported during the years 2002 - 2018, the most belonged to the categories: Rescue & EMS (62.6%), Hazardous Condition (11.6%), and Fire (7.6%).
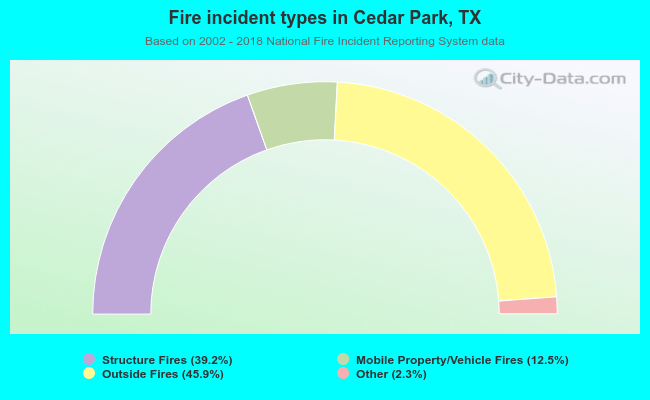 When looking into fire subcategories, the most reports belonged to: Outside Fires (45.9%), and Structure Fires (39.2%).