Leander: Fire Incidents, Texas (TX)
Where are fire incidents reported in Leander, TX
Something went wrong! Please refresh the page.
| Fire incidents reported | |
|---|---|
| Sreet name | Count |
| BAGDAD RD | 158 |
| US 183 HWY | 128 |
| CRYSTAL FALLS PKWY | 86 |
| LAKELINE BLVD | 80 |
| WEST DR | 60 |
| FM 2243 RD | 56 |
| US 183 | 56 |
| HORSESHOE DR | 50 |
| FALCON OAKS DR | 48 |
| NAMELESS RD | 44 |
| OSAGE DR | 42 |
| RONALD W REAGAN BLVD | 38 |
| COUNTY 175 RD | 36 |
| COUNTY 279 RD | 36 |
| CRYSTAL FALLS PKY | 30 |
| FM 2769 | 30 |
| BAKER LN | 28 |
| LEANDER DR | 28 |
| EAGLE'S WY | 26 |
| SONNY DR | 24 |
| HIGH CHAPARRAL DR | 22 |
| PALOS VERDES | 22 |
| SOUTH BROOK DR | 22 |
| CR 270 | 20 |
| FM 2243 | 20 |
| LONE WOLF DR | 20 |
| ORCHARD DR | 20 |
| RONALD REAGAN BLVD | 20 |
| BRENTWOOD DR | 18 |
| GLASS DR | 18 |
| Other | 1,106 |
2002 - 2018 National Fire Incident Reporting System (NFIRS) incidents
- Incident types reported to NFIRS in Leander, TX
- 8,55551.9%Rescue & EMS
- 2,39214.5%Fire
- 1,97512.0%Good Intent Call
- 1,5759.6%Service Call
- 9936.0%Hazardous Condition
- 9535.8%False Alarm
- 230.1%Special Incident
- Fire incident types reported to NFIRS in Leander, TX
- 1,21550.8%Outside Fires
- 94639.5%Structure Fires
- 1636.8%Mobile Property/Vehicle Fires
- 682.8%Other
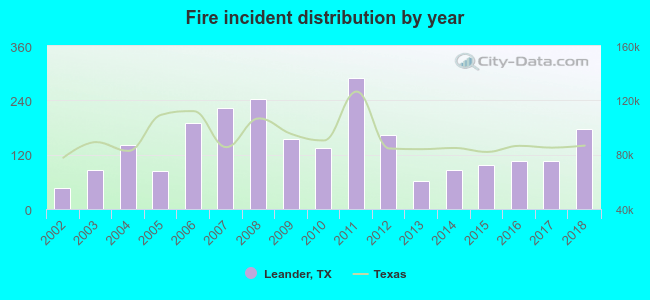 According to the data from the years 2002 - 2018 the average number of fire incidents per year is 141. The highest number of reported fire incidents - 289 took place in 2011, and the least - 46 in 2002. The data has a growing trend.
The average number of yearly fire incidents per 10k residents in Leander, TX compared to nearest cities:
(Note: Based on data for the last 3 years, including only cities with population 5,000 and above)
| Leander: | 38.0 |
| Cedar Park: | 18.8 |
| Jollyville: | 0.6 |
| Lago Vista: | 47.3 |
| Round Rock: | 17.3 |
| Georgetown: | 32.1 |
| Lakeway: | 27.3 |
| Pflugerville: | 20.1 |
| Bee Cave: | 21.8 |
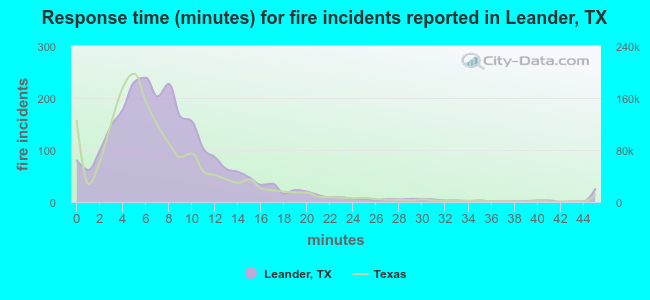 The median response time based on all reported fire incidents is 7 minutes. This is close to the Texas median value.
The median response time in Leander, TX compared to nearest cities:
(Note: Based on data for all years, including only cities with at least 500 fire incidents)
| Leander: | 7 minutes |
| Cedar Park: | 6 minutes |
| Liberty Hill: | 10 minutes |
| Round Rock: | 5 minutes |
| Georgetown: | 7 minutes |
| Pflugerville: | 7 minutes |
| Bertram: | 9 minutes |
| Hutto: | 8 minutes |
| Austin: | 5 minutes |
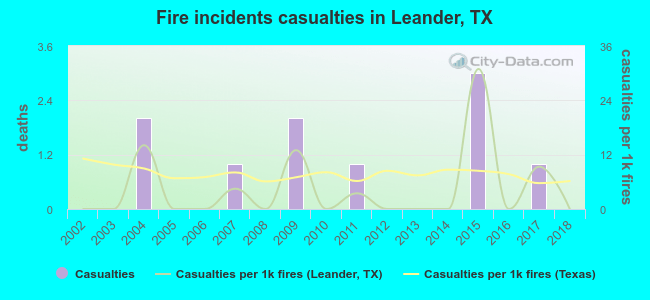 Based on the reports from the years 2002 - 2018 the average number of fire-related yearly casualties is 1. The highest number of injuries - 3 took place in 2015, and the lowest - 0 in 2002. The data has a constant trend.
The average number of casualties per 1,000 fire incidents is 4. This indicator was the highest - 31 in 2015, and the lowest 0 in 2002. The trend for injuries per 1,000 incidents is constant. Compared to the state value the number of casualties per 1,000 fire incidents is lower.
Based on the reports from the years 2002 - 2018 the average number of fire-related yearly casualties is 1. The highest number of injuries - 3 took place in 2015, and the lowest - 0 in 2002. The data has a constant trend.
The average number of casualties per 1,000 fire incidents is 4. This indicator was the highest - 31 in 2015, and the lowest 0 in 2002. The trend for injuries per 1,000 incidents is constant. Compared to the state value the number of casualties per 1,000 fire incidents is lower.Casualties per 1,000 incidents in Leander, TX compared to nearest cities:
(Note: Based on data for all years, including only cities with at least 500 fire incidents)
| Leander: | 4.2 |
| Cedar Park: | 5.9 |
| Liberty Hill: | 0.0 |
| Round Rock: | 8.6 |
| Georgetown: | 10.4 |
| Pflugerville: | 2.1 |
| Bertram: | 0.0 |
| Hutto: | 3.5 |
| Austin: | 15.1 |
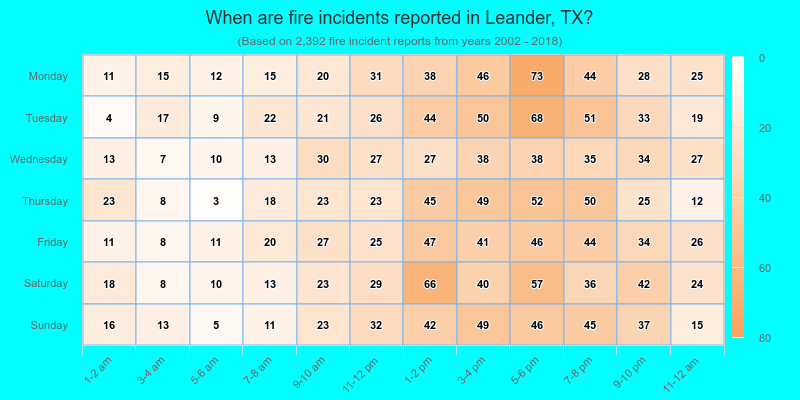
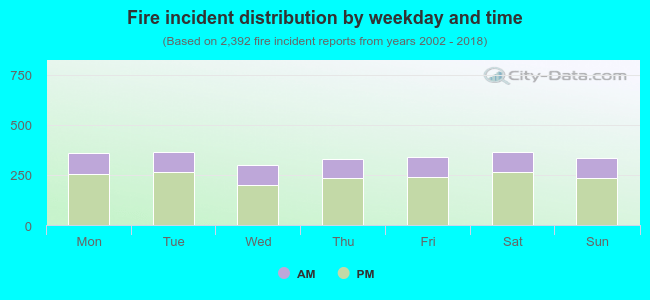 29.4% incidents where reported in the morning and 70.6% in the evening. The most fires (15.3%) took place on Saturday, and the least (12.5%) on Wednesday.
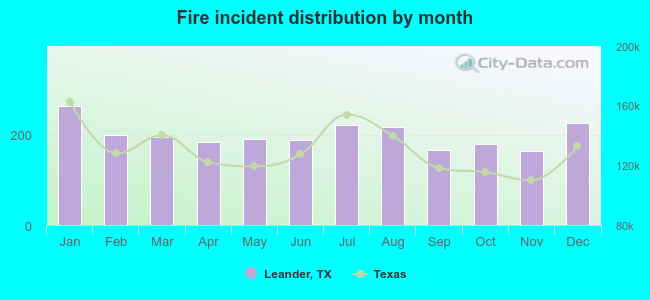 Based on the 2,392 fire incident reports from years 2002 - 2018 most fires (11.0%) took place during January, and the least (6.9%) in November.
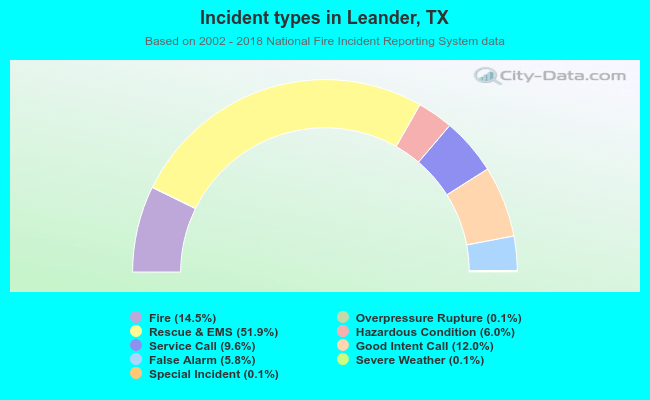 Out of all 16,490 cases reported during the years 2002 - 2018, the most belonged to the categories: Rescue & EMS (51.9%), Fire (14.5%), and Good Intent Call (12.0%).
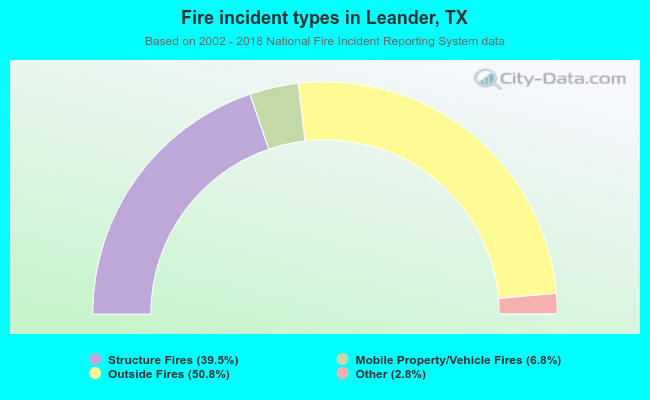 When looking into fire subcategories, the most incidents belonged to: Outside Fires (50.8%), and Structure Fires (39.5%).